Cardano Price Prediction: ADA kick-starts new 78% rally
- Cardano price has successfully bounced off the hypotenuse of an ascending triangle pattern.
- Although bullish, it needs to slice through two levels to have any chance of surging toward $2.
- Unlike technicals, on-chain transactional data shows a free path ahead for ADA.

Cardano price is fast approaching one of two critical supply barriers that could deter the upswing move.
Cardano price eyes higher high
Cardano price has created another higher low as it bounced off the ascending triangle’s hypotenuse, coinciding with the 50 and 100 Simple Moving Averages (SMA) on the twelve-hour chart.
This setup is formed when the swing lows and the series of highs are connected using trend lines. The technical formation forecasts a 46% upswing, determined by adding the distance between the first pivot high and low to the breakout point at $1.48.
ADA has surged nearly 11% at the time of writing as it trades under the Momentum Reversal Indicator’s (MRI) State Trend Resistance at $1.34. Interestingly, this level coincides with the SuperTrend indicator’s sell signal flashed on March 22. Thus, a swift breach of this level will not only flip a resistance into support but also trigger the SuperTrend indicator’s buy signal.
If the bullish momentum manages to slice through the $1.48, ADA will have begun its 46% upswing to $2.16. Although bullish, in this trajectory, the so-called “Ethereum-killer” will face a test of its bullishness at $1.82.
Clearing this level will further propel the Cardano price toward its target of $2.16.
As mentioned in a previous article, the Bollinger Bands have expanded, denoting a surge in volatility. However, a further spike in volatility caused due to the bullish momentum will easily slice through the above levels.
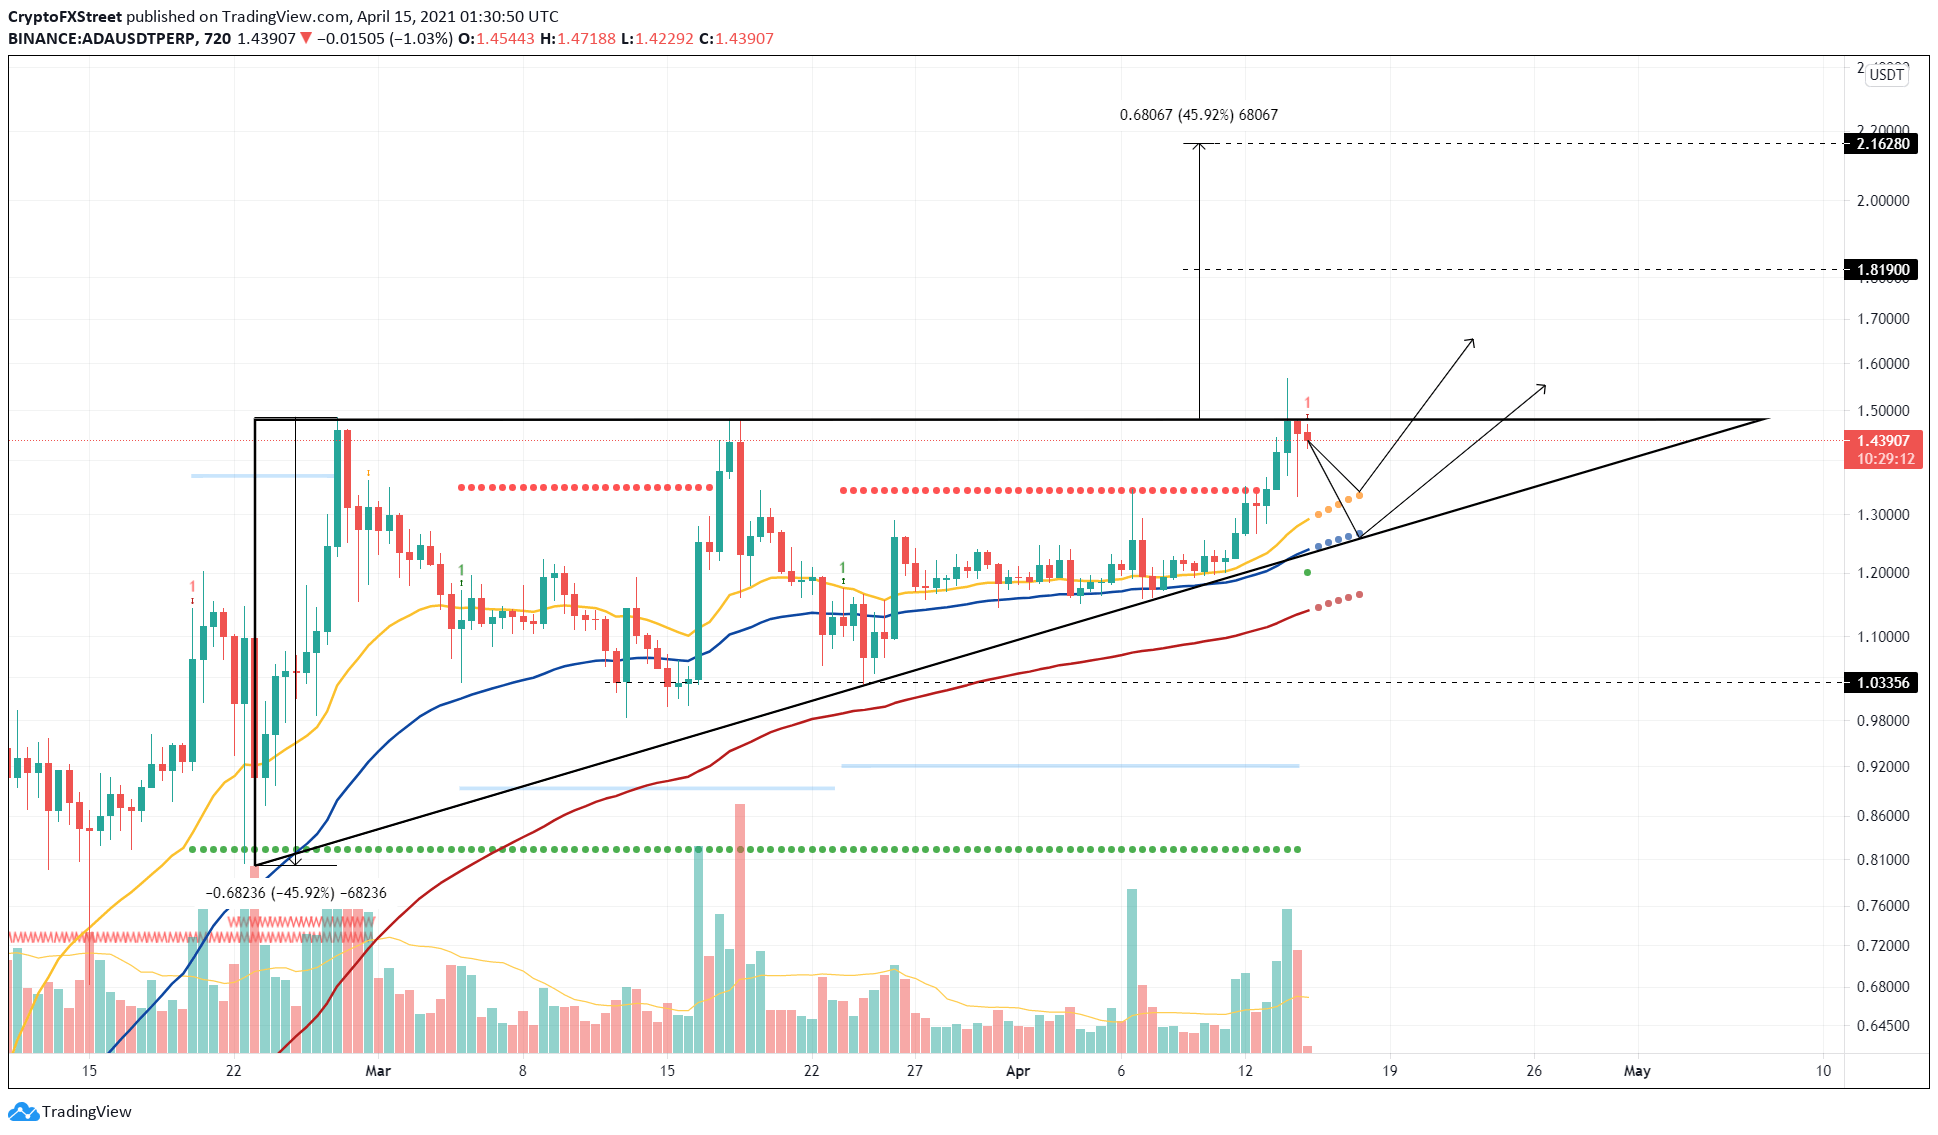
ADA/USDT twelve-hour charts
Based on IntoTheBlock’s In/Out of the Money Around Price (IOMAP) model, the recent surge leaves few supply barriers ahead.
Roughly 15,000 addresses that purchased nearly 200 million ADA at an average price of $1.32 are still “Out of the Money,” suggesting that a breach of this level is necessary. Likewise, 16,500 addresses that hold about 463 million tokens acquired at $1.35 are underwater.
Hence, the buyers need to flip these levels to cruise to higher levels.
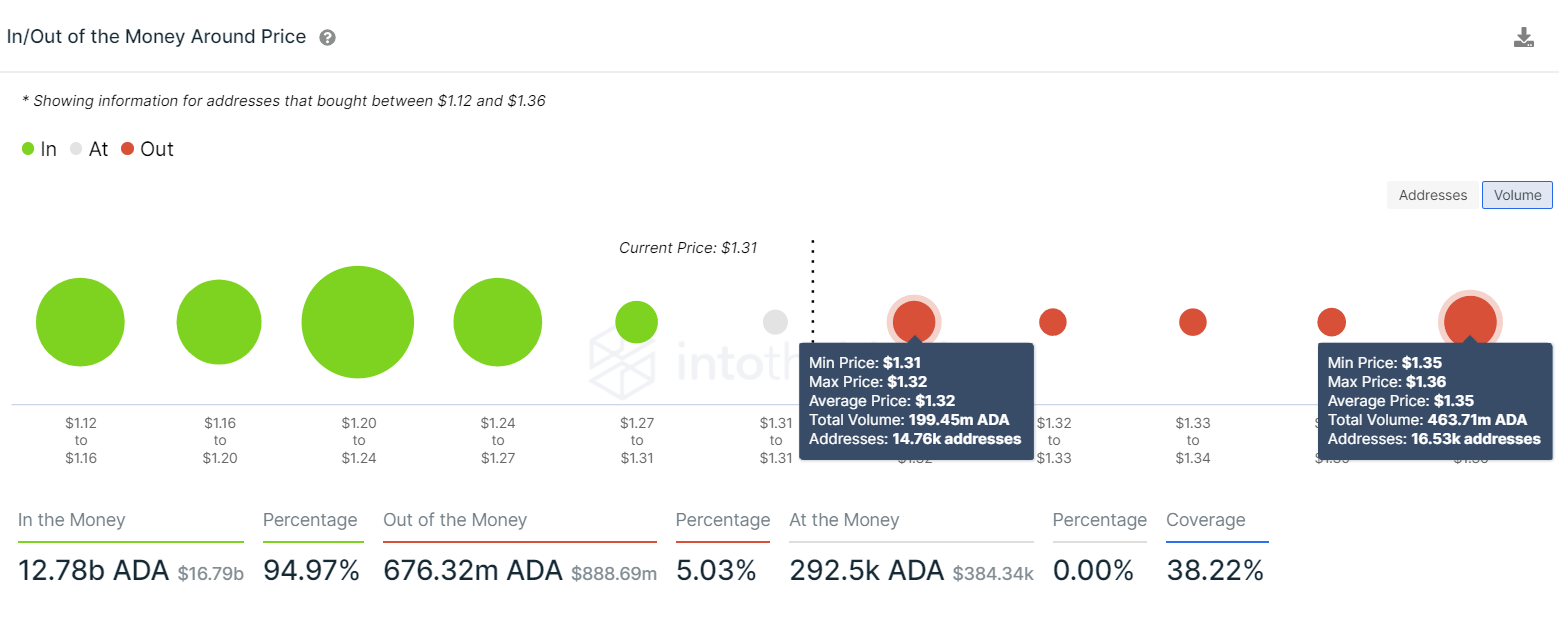
Cardano IOMAP chart
Regardless, it would be bearish if the bulls fail to conquer the immediate supply barrier at $1.34. A reversal here that pushes through the hypotenuse of the ascending triangle pattern at $1.20 might likely stop the bullish outlook.
However, the upswing will be invalidated if the Cardano price dips below $1.12 for an extended period. If the bearish momentum persists, an 18% drop to $0.92 seems plausible.
Author

Akash Girimath
FXStreet
Akash Girimath is a Mechanical Engineer interested in the chaos of the financial markets. Trying to make sense of this convoluted yet fascinating space, he switched his engineering job to become a crypto reporter and analyst.


