- Cardano price shows a slowdown around a crucial supply barrier that ranges from $1.33 to $1.26.
- A 13% retracement to $1.14 would allow the buyers to purchase ADA at a discount for the next leg up.
- If buyers produce a sustained yet decisive close above $1.35, an upswing to $1.48 could ensue.
Cardano price shows the exhaustion of buying pressure as it tries to break out of an area of resistance. A failure to do so will most likely result in a pullback.
Cardano price at inflection point
On the 12-hour chart, Cardano price has tried breaching the supply zone’s upper trend line at $1.33 for more than a day. However, sellers in this area have prevented this, leading to a consolidation here.
This indecisiveness might lead to more sideways movement in ADA, at least until one side overwhelms the other. If ADA slices through the 50% Fibonacci retracement level at $1.26, which coincides with the supply barrier’s lower trend line, it will signal the start of a new downtrend.
Under these conditions, investors can expect a pullback to $1.14, which is approximately 13% lower than the current price.
In some cases, this correction could extend up to $1.11.
This move would allow buyers to scoop up the so-called “Ethereum killer” at a discount, pushing the price higher. Hence, a reversal scenario could play out after a 13% to 15% drop.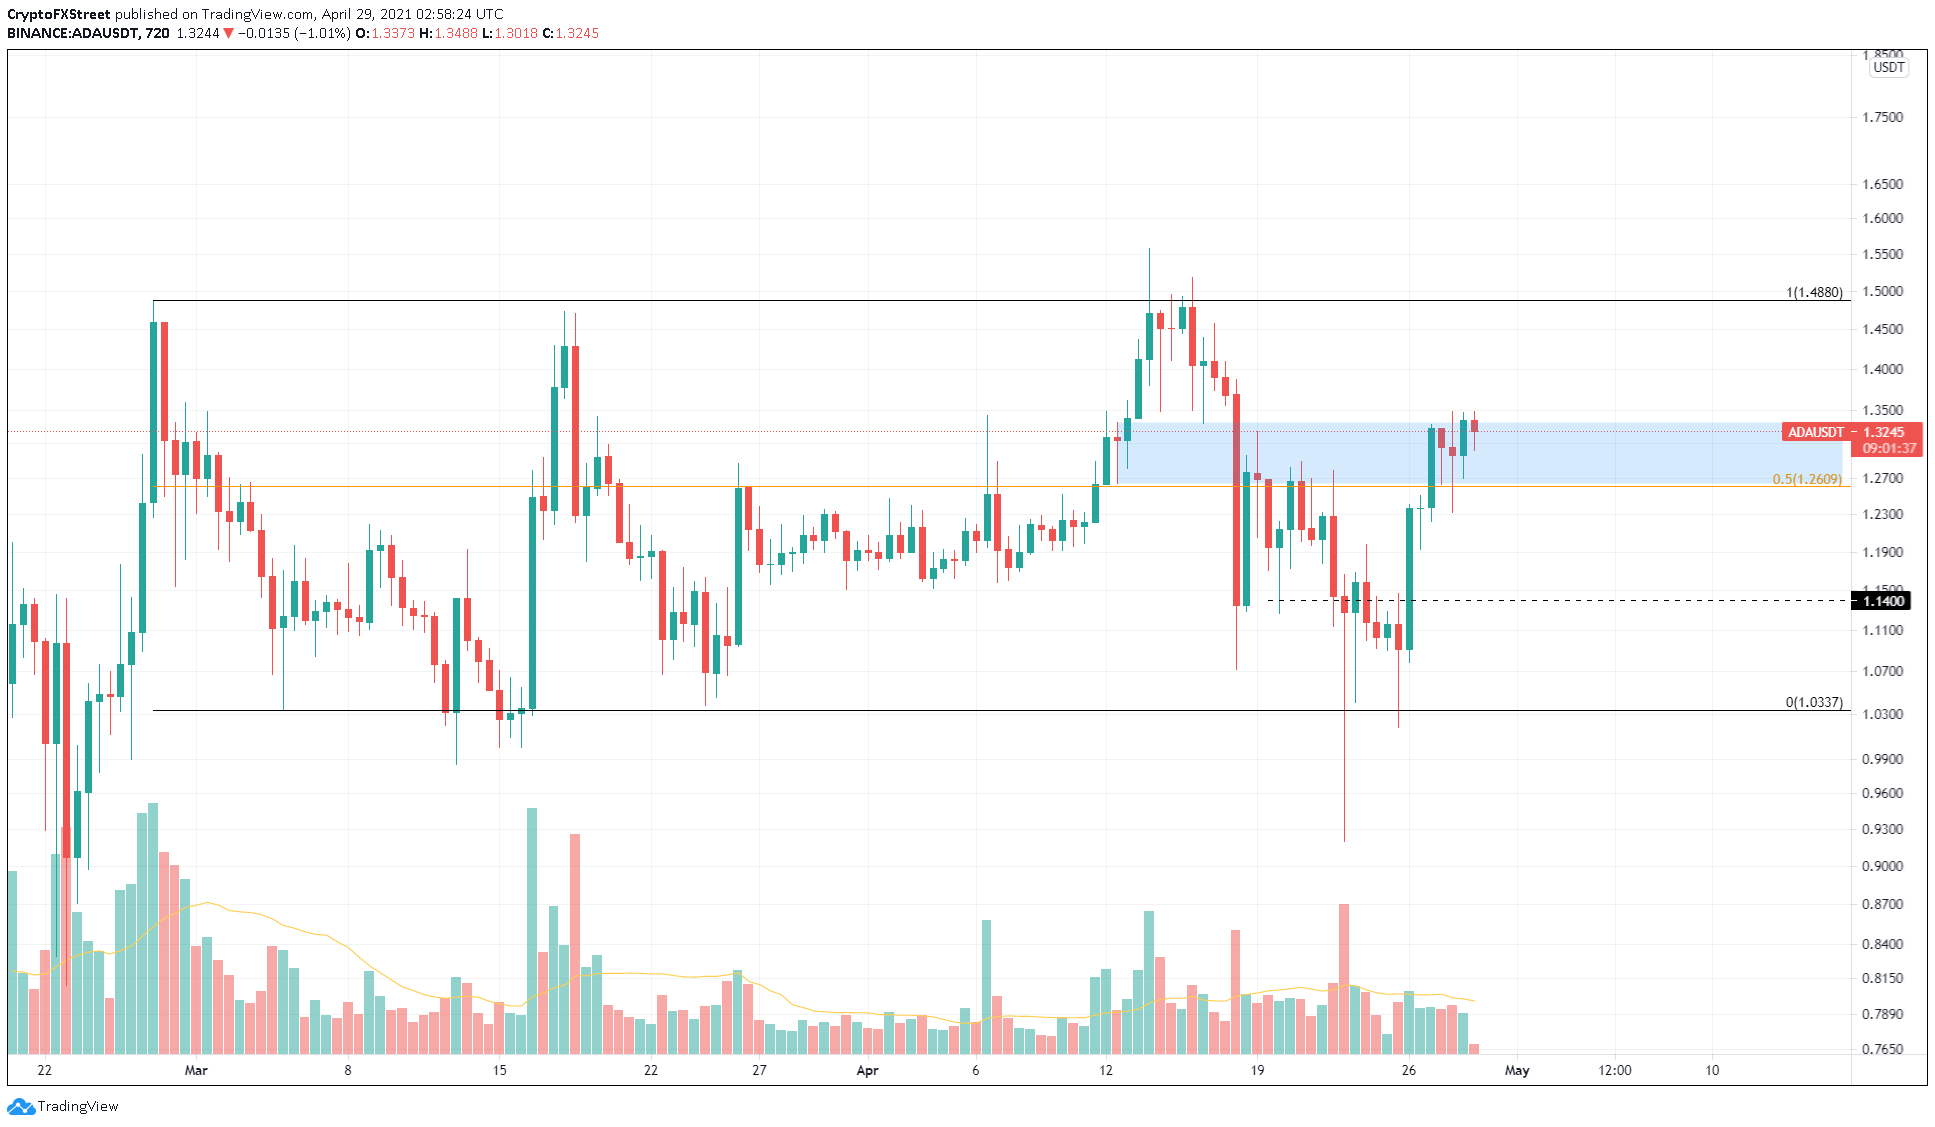
ADA/USDT 12-hour chart
According to IntoTheBlock’s Global In/Out of the Money (GIOM) model, the support levels are stacked below the current Cardano price levels. Hence, a downswing is most likely to be short-lived. Therefore, the bias for ADA is bullish.
Adding credence to this bullish thesis is the presence of only one significant resistance level at $1.44. Here, roughly 76,000 addresses purchased nearly 989 million ADA and might dampen the upswing.
Therefore, clearing this level will provide Cardano price a clear path to retest current all-time highs at $1.5584.
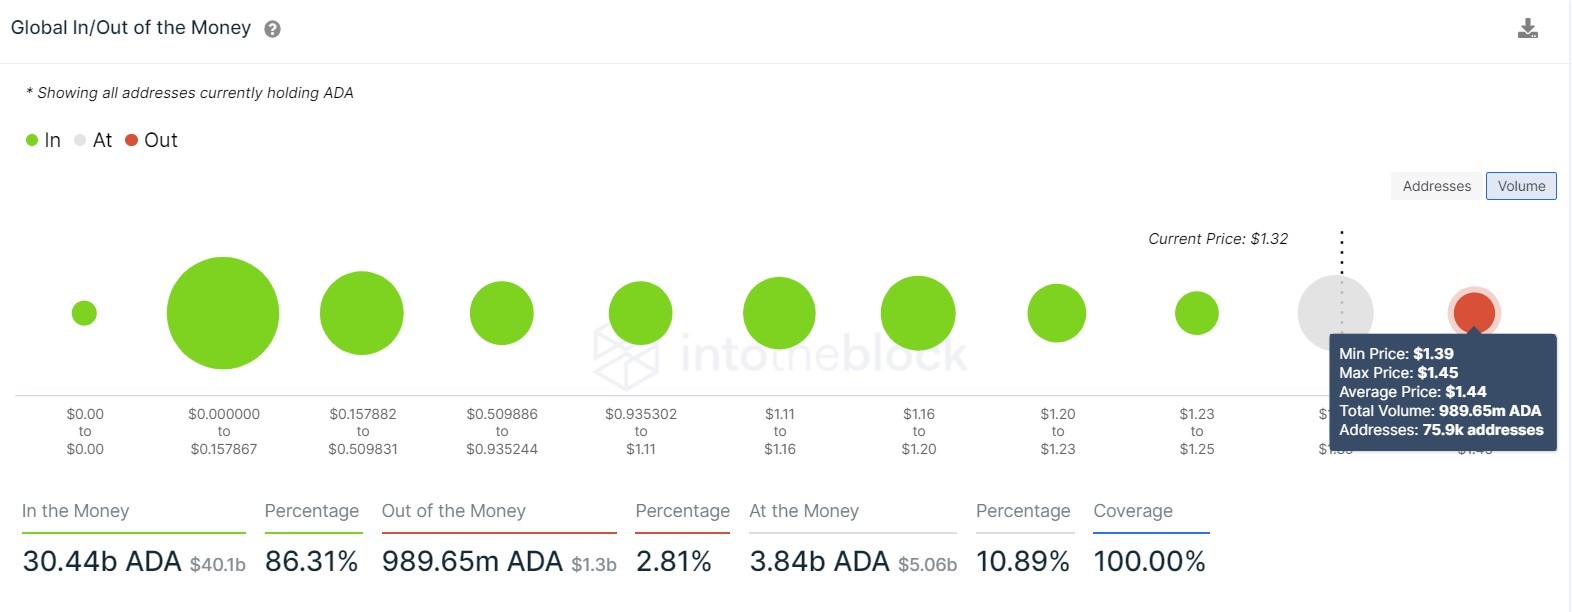
ADA GIOM chart
On the flip side, if the $1.11 support level breaks down and Cardano price spends an extended period below this level, buyers would lose their leverage. Such events could shift the winds toward sellers, leading to a 7% sell-off to the swing low at $1.03.
Information on these pages contains forward-looking statements that involve risks and uncertainties. Markets and instruments profiled on this page are for informational purposes only and should not in any way come across as a recommendation to buy or sell in these assets. You should do your own thorough research before making any investment decisions. FXStreet does not in any way guarantee that this information is free from mistakes, errors, or material misstatements. It also does not guarantee that this information is of a timely nature. Investing in Open Markets involves a great deal of risk, including the loss of all or a portion of your investment, as well as emotional distress. All risks, losses and costs associated with investing, including total loss of principal, are your responsibility. The views and opinions expressed in this article are those of the authors and do not necessarily reflect the official policy or position of FXStreet nor its advertisers. The author will not be held responsible for information that is found at the end of links posted on this page.
If not otherwise explicitly mentioned in the body of the article, at the time of writing, the author has no position in any stock mentioned in this article and no business relationship with any company mentioned. The author has not received compensation for writing this article, other than from FXStreet.
FXStreet and the author do not provide personalized recommendations. The author makes no representations as to the accuracy, completeness, or suitability of this information. FXStreet and the author will not be liable for any errors, omissions or any losses, injuries or damages arising from this information and its display or use. Errors and omissions excepted.
The author and FXStreet are not registered investment advisors and nothing in this article is intended to be investment advice.
Recommended Content
Editors’ Picks

Bitcoin holds $84,000 despite Fed’s hawkish remarks and spot ETFs outflows
Bitcoin is stabilizing around $84,000 at the time of writing on Thursday after facing multiple rejections around the 200-day EMA at $85,000 since Saturday. Despite risk-off sentiment due to the hawkish remarks by the US Fed on Wednesday, BTC remains relatively stable.

Crypto market cap fell more than 18% in Q1, wiping out $633.5 billion after Trump’s inauguration top
CoinGecko’s Q1 Crypto Industry Report highlights that the total crypto market capitalization fell by 18.6% in the first quarter, wiping out $633.5 billion after topping on January 18, just a couple of days ahead of US President Donald Trump’s inauguration.

Top meme coin gainers FARTCOIN, AIDOGE, and MEW as Trump coins litmus test US SEC ethics
Cryptocurrencies have been moving in lockstep since Monday, largely reflecting sentiment across global markets as United States (US) President Donald Trump's tariffs and trade wars take on new shapes and forms each passing day.

XRP buoyant above $2 as court grants Ripple breathing space in SEC lawsuit
A US appellate court temporarily paused the SEC-Ripple case for 60 days, holding the appeal in abeyance. The SEC is expected to file a status report by June 15, signaling a potential end to the four-year legal battle.
Bitcoin Weekly Forecast: Market uncertainty lingers, Trump’s 90-day tariff pause sparks modest recovery
Bitcoin (BTC) price extends recovery to around $82,500 on Friday after dumping to a new year-to-date low of $74,508 to start the week. Market uncertainty remains high, leading to a massive shakeout, with total liquidations hitting $2.18 billion across crypto markets.

The Best brokers to trade EUR/USD
SPONSORED Discover the top brokers for trading EUR/USD in 2025. Our list features brokers with competitive spreads, fast execution, and powerful platforms. Whether you're a beginner or an expert, find the right partner to navigate the dynamic Forex market.