![]() Lorenzo Stroe
Lorenzo Stroe
Independent Analyst
- ADA is currently trading at $0.1 after a notable 41% price surge over the past week.
- The outlook for Cardano is quickly turning bearish as several indicators are showing a potentially deadly selloff.
Cardano established a new 2020-high on July 26 at $0.15. The digital asset is down 50% since its peak, and it’s currently trying to recover.
Several indicators are pointing towards a selloff
Although ADA price has been trending upwards, it seems that many indicators are starting to shift in favor of the bears.
ADA/USD daily chart
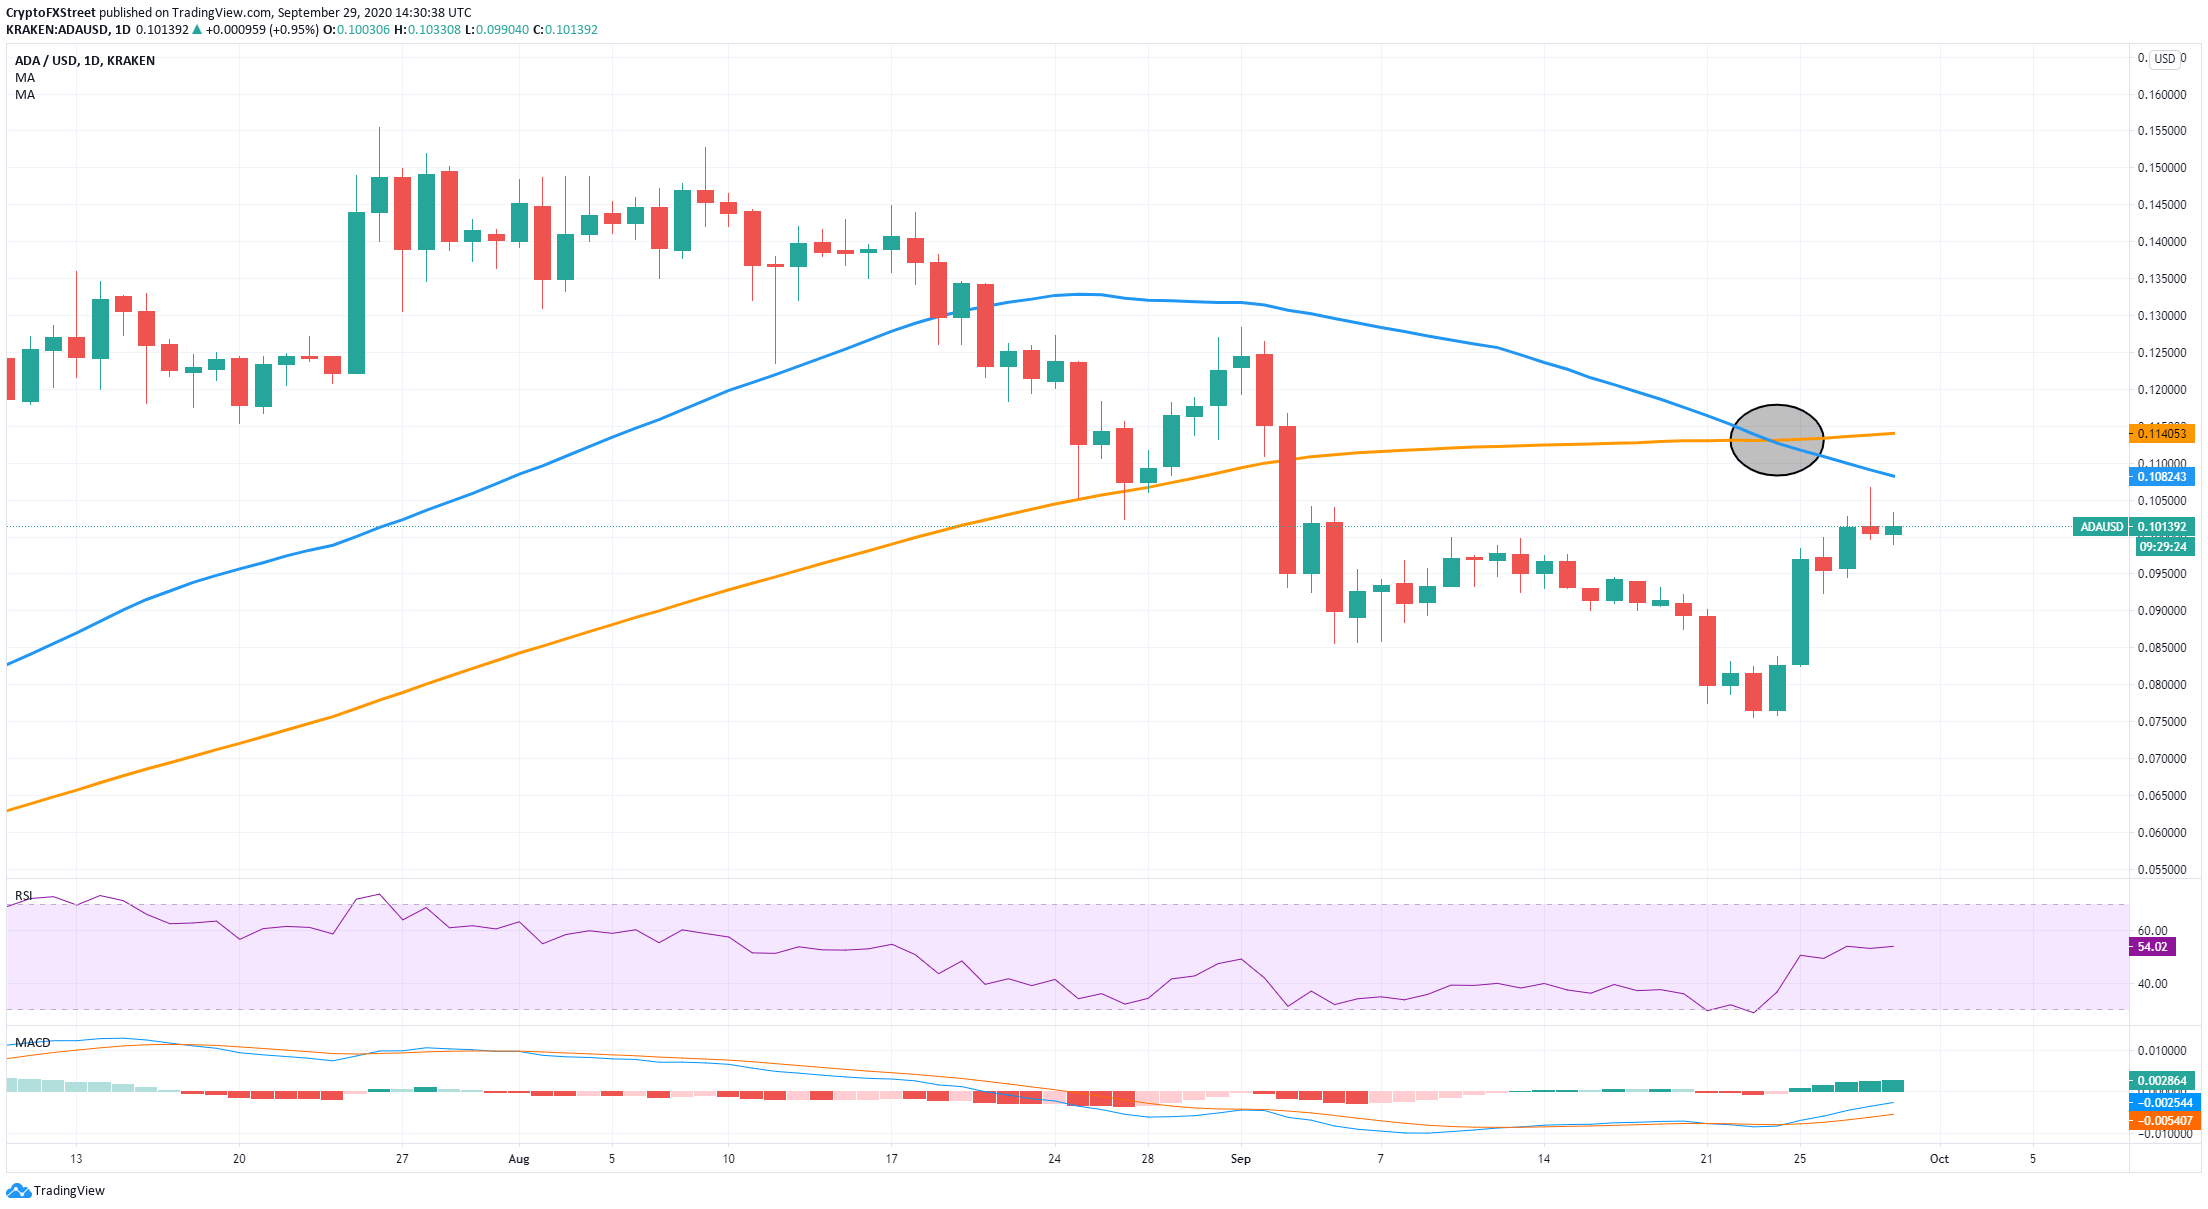
On the daily chart, the 100-MA and the 50-MA had a death cross on September 23. This pattern indicates the potential for a major selloff even though ADA is rebounding. The 50-MA at $0.108 will act as a resistance level in the upcoming days.
ADA IOMAP Chart
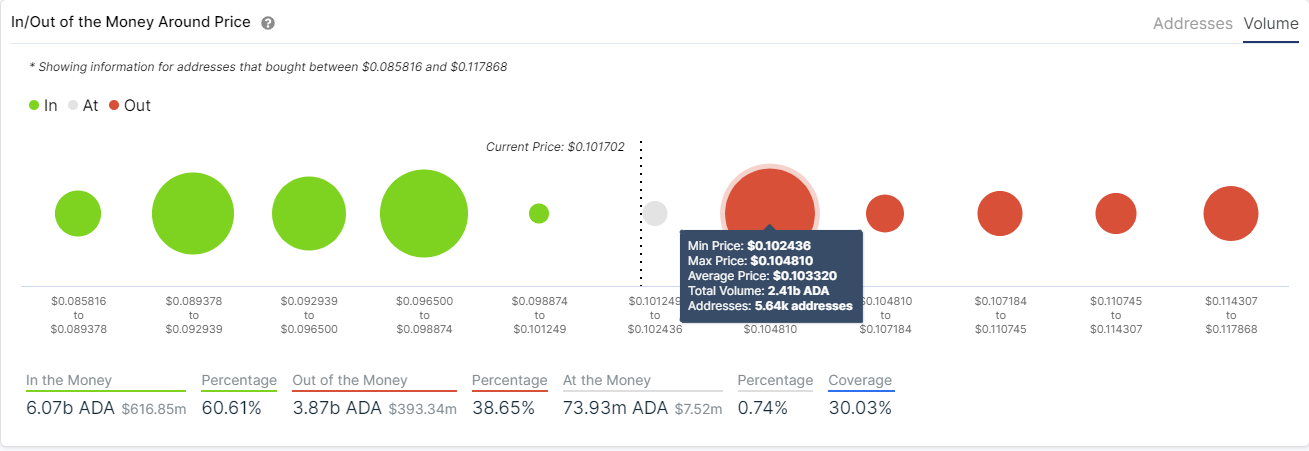
Looking at the In/Out of the Money Around Price chart by IntoTheBlock, it certainly seems that bulls face a lot of resistance ahead. The range between $0.102 and $0.104 is a giant resistance level where more than 5,000 addresses bought 2.4 billion ADA coins.
ADA/USD 12-hour chart
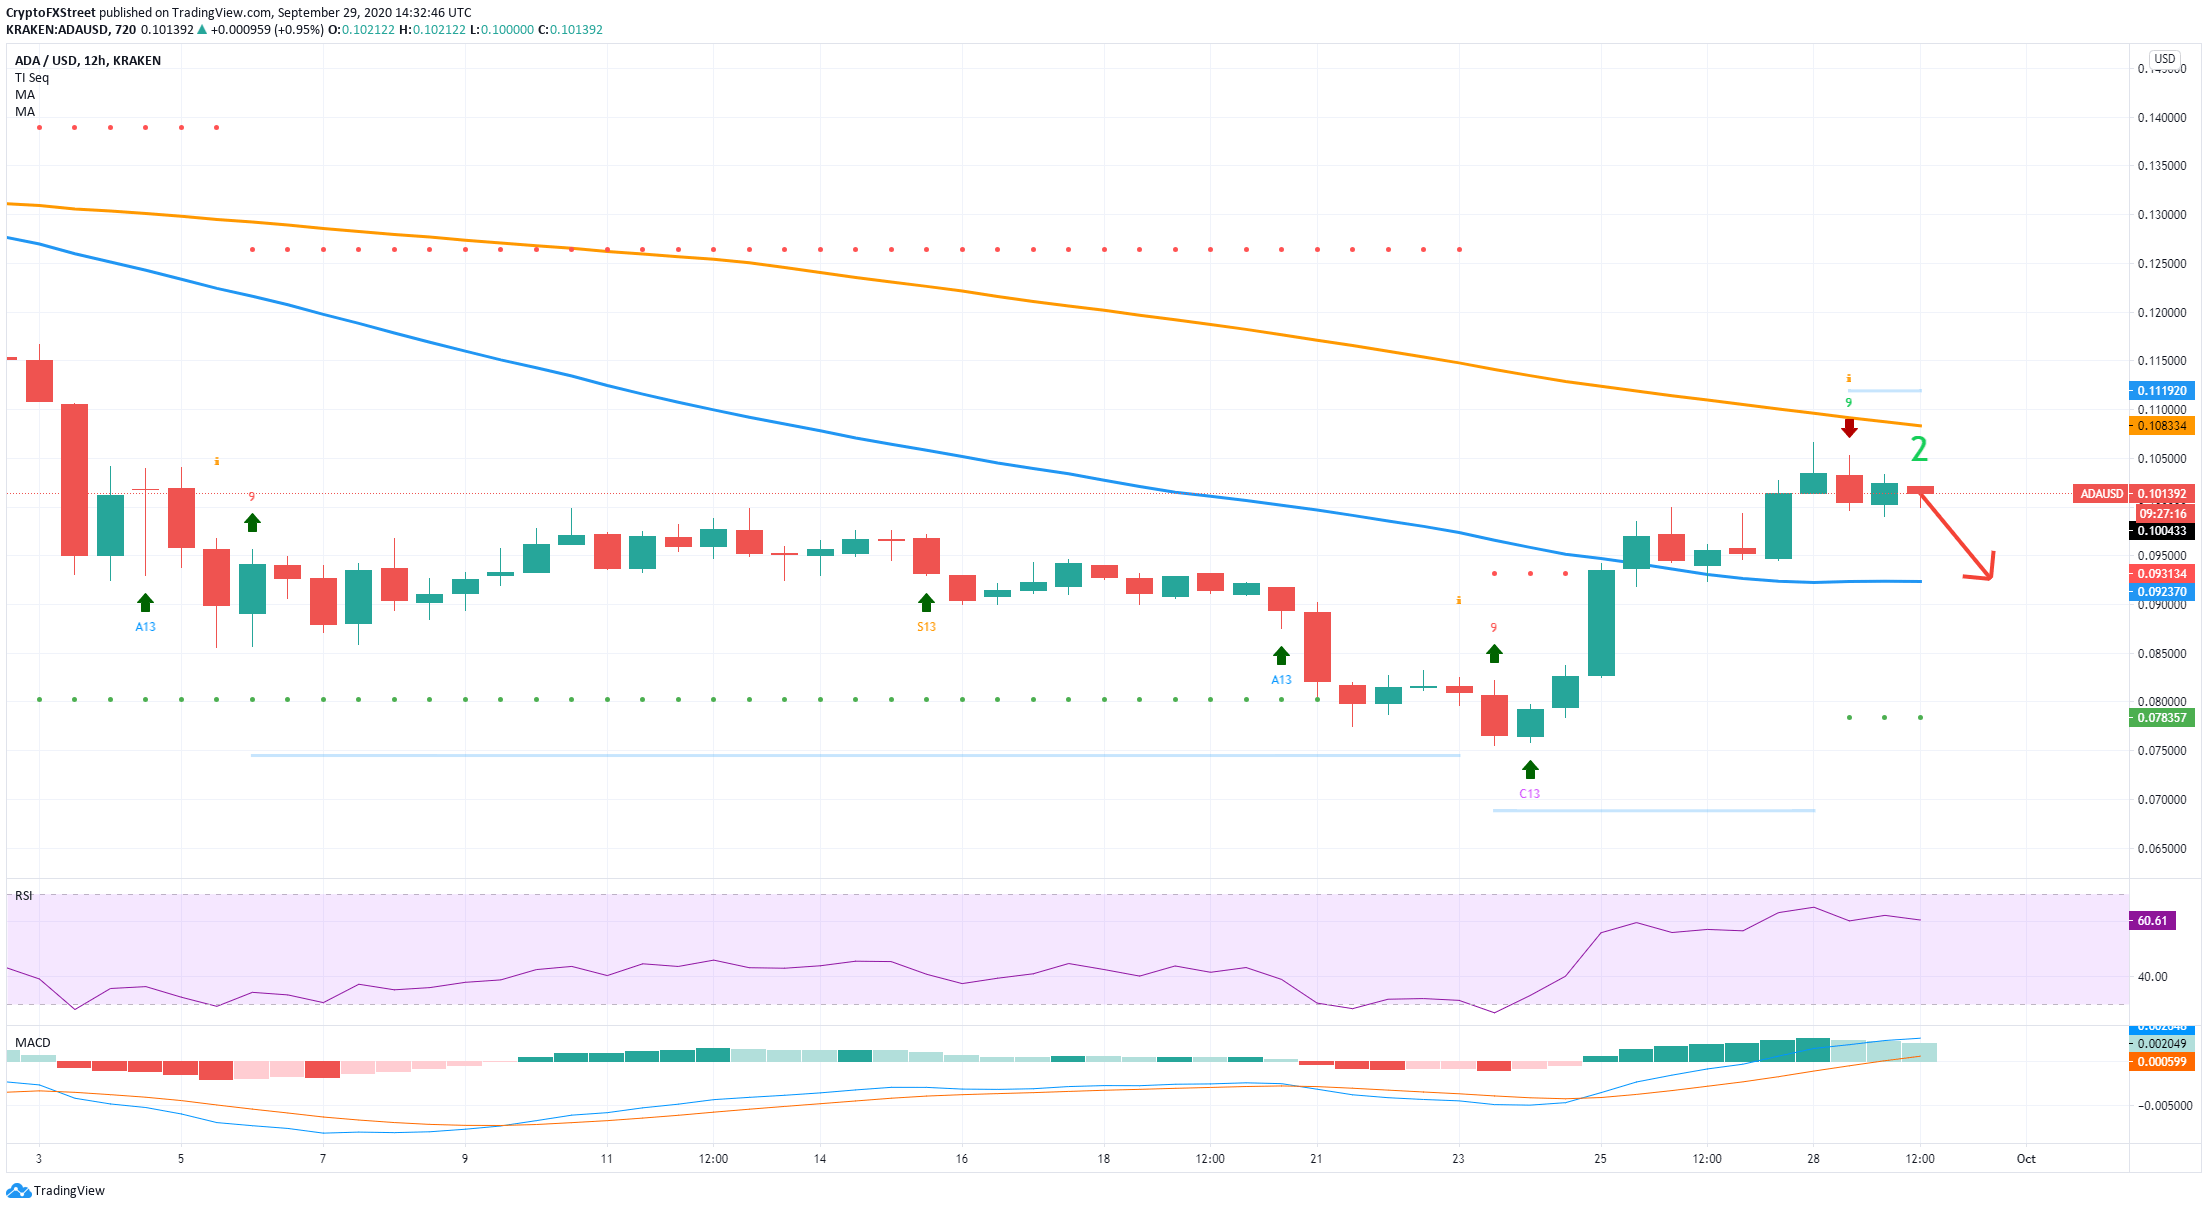
On the 12-hour chart, the TD sequential indicator has presented a sell signal on September 28. ADA faces the 100-MA at $0.108 as a resistance level, and bears are looking at least for a re-test of the 50-MA at $0.092. The RSI is also quite extended, while the MACD remains bullish.
ADA/USD 4-hour chart
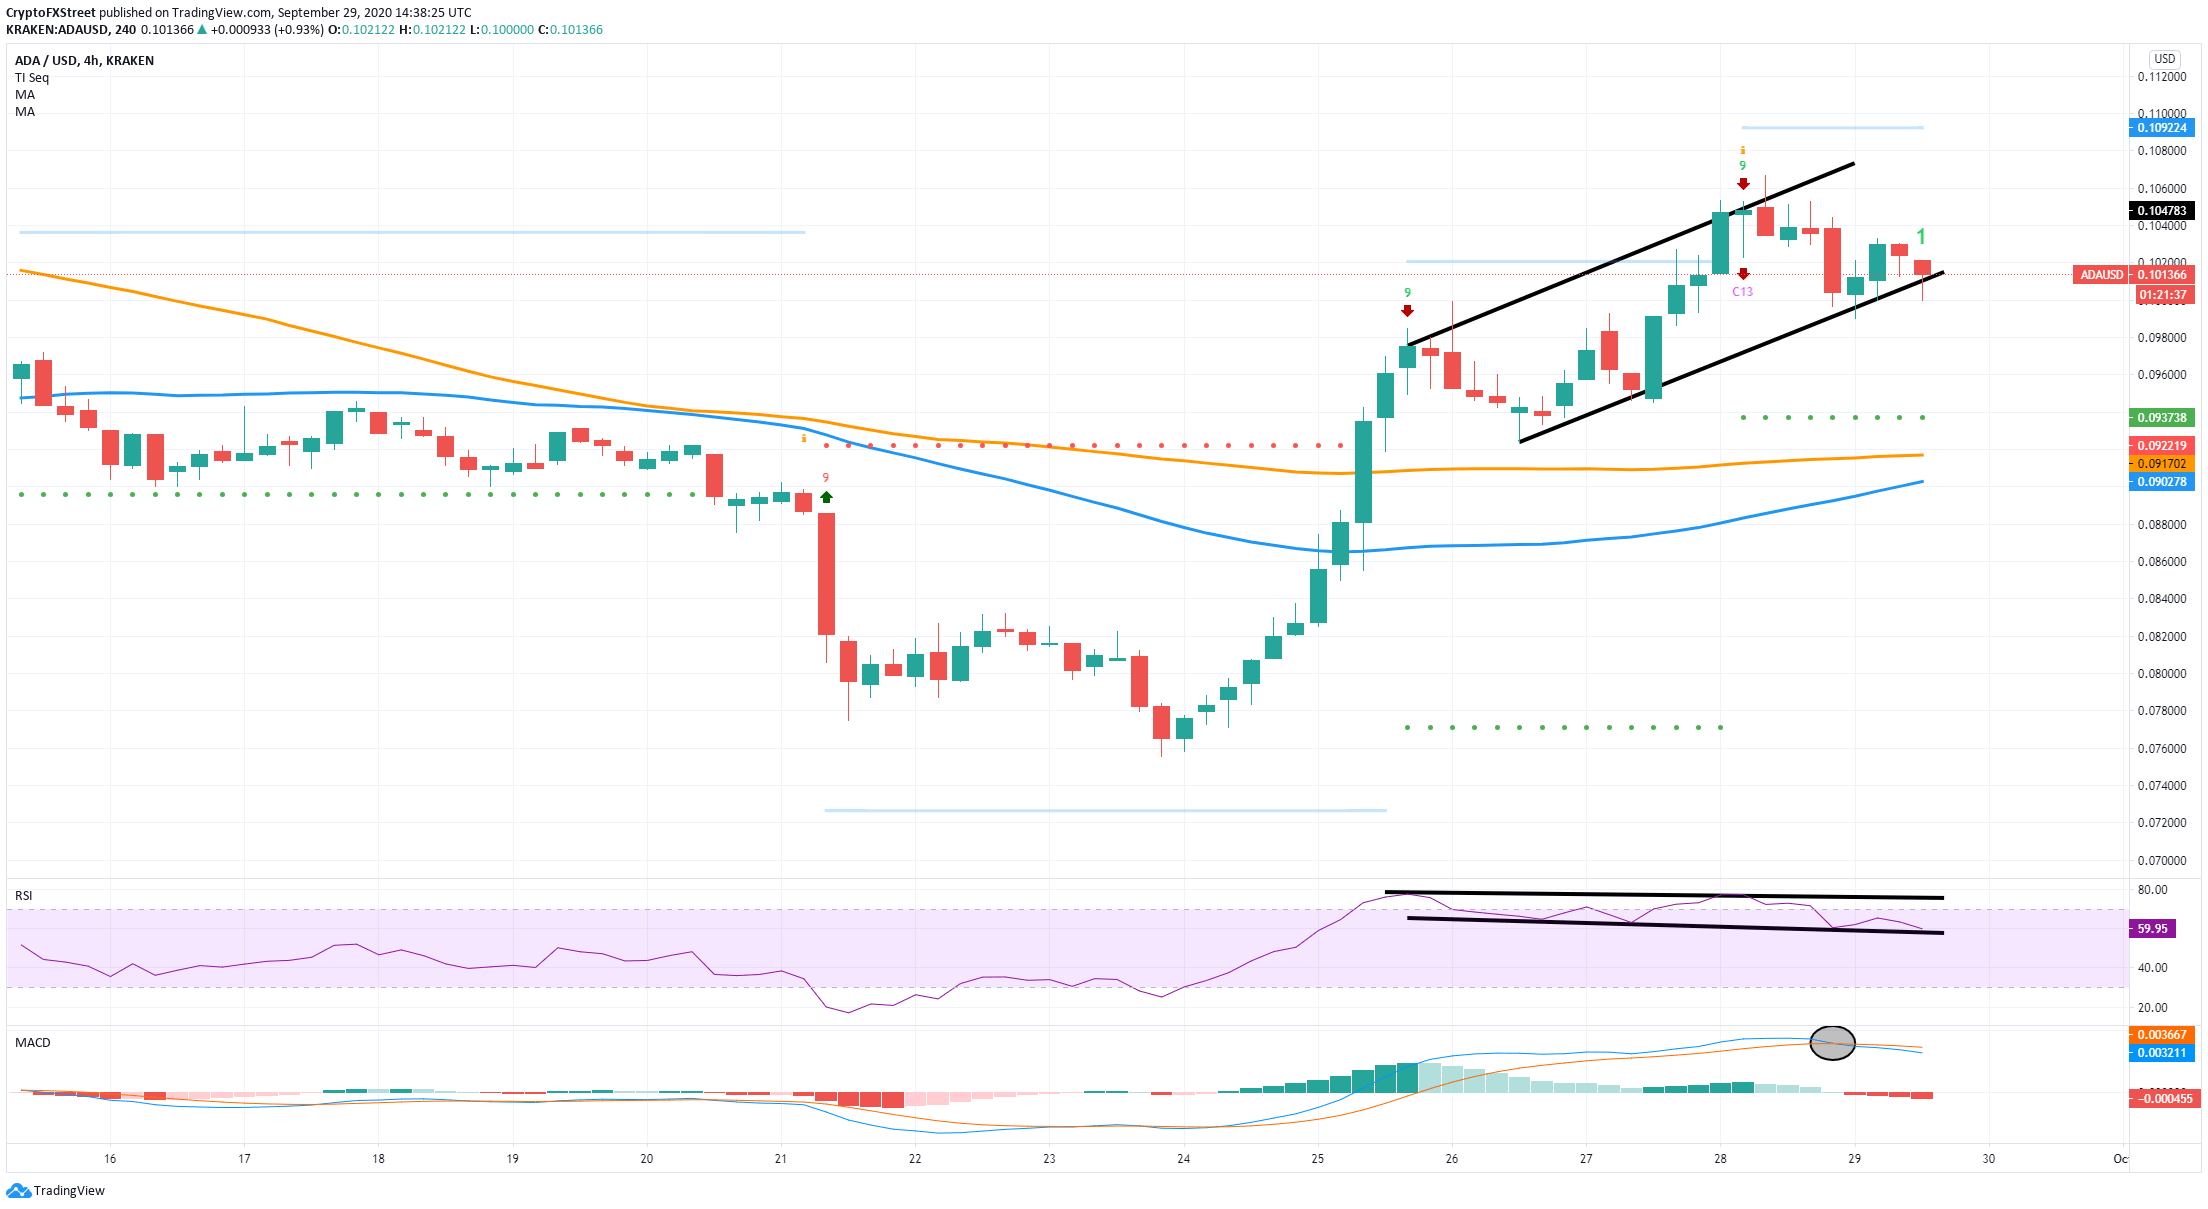
The RSI and the price have created a bearish divergence, which happens when the price posts higher highs, but the RSI doesn’t. Additionally, the MACD just crossed bearishly, and the TD sequential indicator presented another sell signal around 36 hours ago.
The bearish outlook is solid; however, the IOMAP chart shows a ton of support below $0.10. Bears still need to be extremely careful as the only significant resistance level is established between $0.102 and $0.104, meaning that ADA can continue with its recent uptrend if this area is cracked.
ADA New Addresses Chart
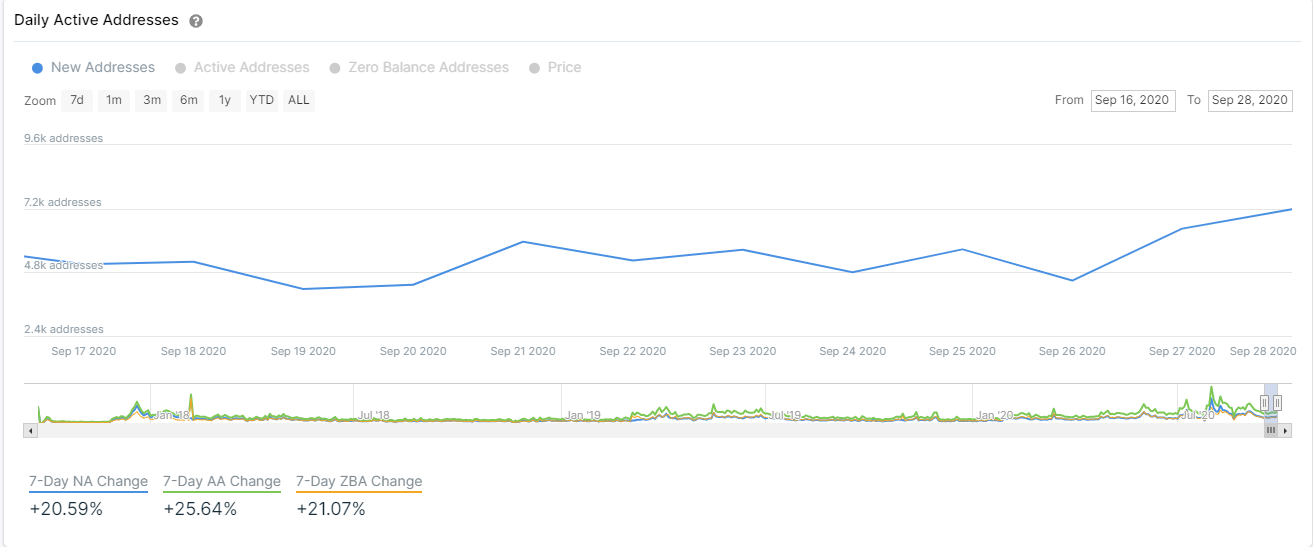
Additionally, according to the chart provided by IntoTheBlock, the number of new ADA addresses joining the network has increased over the past week from a low of 4,500 addresses to a current peak of 7,000. The most recent spike in the number of new addresses happened between August 30 and September 3. At the time, the price of ADA reacted positively to this metric and jumped by 25% within days.
If history repeats itself, the break of the $0.104 resistance point can lead ADA to test the 50-MA resistance at $0.108 and the 100-MA at $0.114.
Note: All information on this page is subject to change. The use of this website constitutes acceptance of our user agreement. Please read our privacy policy and legal disclaimer. Opinions expressed at FXstreet.com are those of the individual authors and do not necessarily represent the opinion of FXstreet.com or its management. Risk Disclosure: Trading foreign exchange on margin carries a high level of risk, and may not be suitable for all investors. The high degree of leverage can work against you as well as for you. Before deciding to invest in foreign exchange you should carefully consider your investment objectives, level of experience, and risk appetite. The possibility exists that you could sustain a loss of some or all of your initial investment and therefore you should not invest money that you cannot afford to lose. You should be aware of all the risks associated with foreign exchange trading, and seek advice from an independent financial advisor if you have any doubts.
Recommended Content
Editors’ Picks

Monero Price Forecast: XMR soars over 19% amid rising demand for privacy coins
Monero (XMR) price is extending its gains by 19% at the time of writing on Monday, following a 9.33% rally the previous week. On-chain metrics support this price surge, with XMR’s open interest reaching its highest level since December 20.

Top 3 Price Prediction Bitcoin, Ethereum, Ripple: BTC and ETH stabilize while XRP shows strength
Bitcoin and Ethereum prices are stabilizing at around $93,500 and $1,770 at the time of writing on Monday, following a rally of over 10% and 12% the previous week. Ripple price also rallied 8.3% and closed above its key resistance level last week, indicating an uptrend ahead.

Ethereum Price Forecast: ETH ETFs post first weekly inflows since February
Ethereum (ETH) recovered the $1,800 price level on Saturday after US spot Ether ETFs (exchange-traded funds) recorded their first weekly inflows since February.

Defi Development Corporation files to offer $1 billion in securities to boost its Solana holdings
Defi Development Corporation (formerly Janover) filed a registration statement with the Securities & Exchange Commission (SEC) on Friday, signaling its intent to offer and sell a wide range of securities, including common and preferred stock, debt instruments and warrants for the purchase of equity

Bitcoin Weekly Forecast: BTC consolidates after posting over 10% weekly surge
Bitcoin (BTC) price is consolidating around $94,000 at the time of writing on Friday, holding onto the recent 10% increase seen earlier this week.

The Best brokers to trade EUR/USD
SPONSORED Discover the top brokers for trading EUR/USD in 2025. Our list features brokers with competitive spreads, fast execution, and powerful platforms. Whether you're a beginner or an expert, find the right partner to navigate the dynamic Forex market.