- Cardano price extends its rally on Monday after gaining more than 13% last week.
- On-chain metrics suggest a bullish picture as ADA’s long-to-short ratio reached its highest in over a month.
- The technical outlook and funding rates data suggest a rally continuation, targeting 20% additional gains.
Cardano (ADA) price extends its rally on Monday after gaining more than 13% last week. On-chain metrics suggest a bullish picture as ADA’s long-to-short ratio reached the highest level in over a month. The technical outlook and funding rates data suggest a rally continuation, targeting 20% additional gains.
Cardano bulls aim for 20% gains
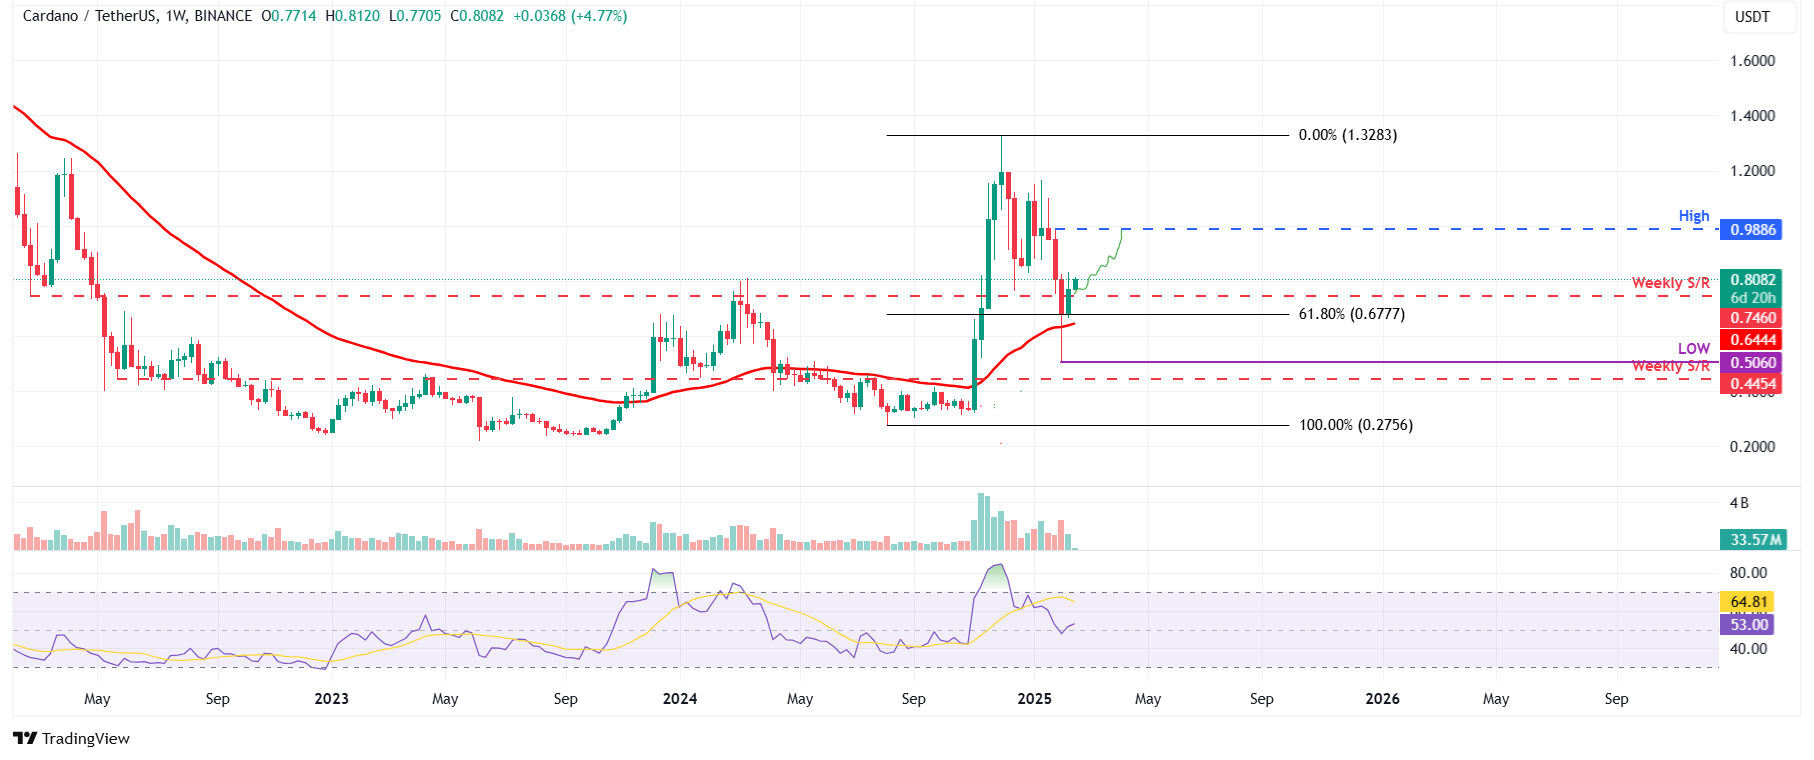
Cardano price found support around its 61.8% Fibonacci retracement level (drawn from the August 5 low of $0.27 to the December 3 high of $1.32) at $0.67 last week. It rose 13.21%, closing above the weekly resistance level of $0.74. At the start of this week on Monday, it continued to rally by 4.7%, trading at around $0.80.
If the weekly level at $0.74 holds as support, it could extend the rally by 22% from its current levels to retest its January 30 high of $0.98.
The Relative Strength Index (RSI) on the weekly chart reads 53, bouncing off from its neutral level of 50 last week and indicating a maintenance of bullish momentum.
ADA/USDT weekly chart
Another bullish sign is Coinglass’ ADA long-to-short ratio, which reads 1.09, the highest level in over a month. This ratio above one reflects bullish sentiment in the markets as more traders are betting for the asset price to rise.
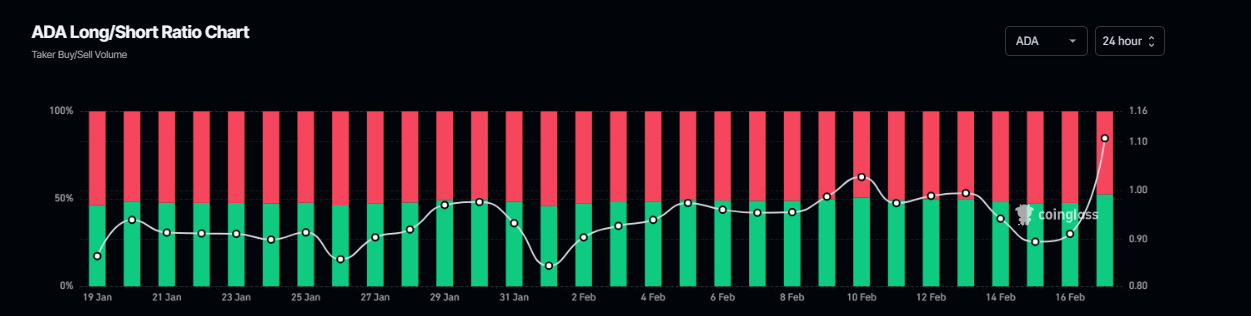
ADA long-to-short ratio chart. Source: Coinglass
According to Coinglass’s OI-Weighted Funding Rate data, the number of traders betting that the price of ADA will slide further is fewer than that anticipating a price increase.
This index is based on the yields of futures contracts, which are weighted by their open interest rates. Generally, a positive rate (longs pay shorts) indicates bullish sentiment, while negative numbers (shorts pay longs) indicate bearishness.
In the case of ADA, the metric increased from -0.0007% on Sunday to 0.0016% on Monday, reflecting a positive rate and indicating that longs are paying shorts. This scenario often signifies bullish sentiment in the market, suggesting potential upward pressure on Cardano’s price.
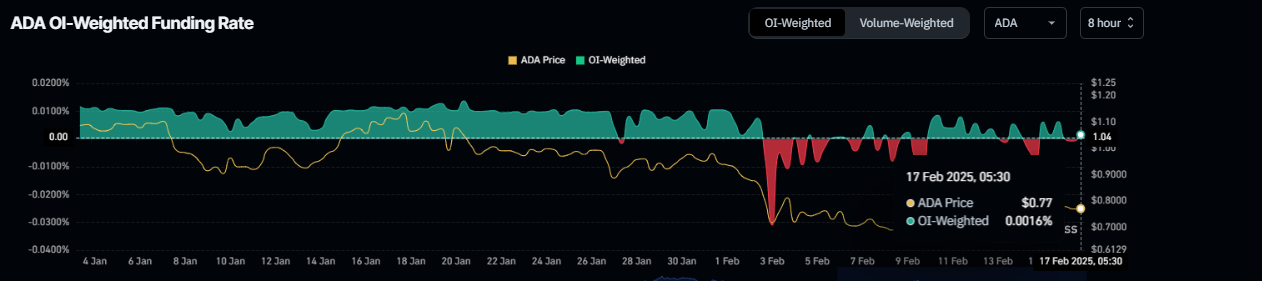
ADA OI-Weighted Funding Rata chart. Source: Coinglass
Information on these pages contains forward-looking statements that involve risks and uncertainties. Markets and instruments profiled on this page are for informational purposes only and should not in any way come across as a recommendation to buy or sell in these assets. You should do your own thorough research before making any investment decisions. FXStreet does not in any way guarantee that this information is free from mistakes, errors, or material misstatements. It also does not guarantee that this information is of a timely nature. Investing in Open Markets involves a great deal of risk, including the loss of all or a portion of your investment, as well as emotional distress. All risks, losses and costs associated with investing, including total loss of principal, are your responsibility. The views and opinions expressed in this article are those of the authors and do not necessarily reflect the official policy or position of FXStreet nor its advertisers. The author will not be held responsible for information that is found at the end of links posted on this page.
If not otherwise explicitly mentioned in the body of the article, at the time of writing, the author has no position in any stock mentioned in this article and no business relationship with any company mentioned. The author has not received compensation for writing this article, other than from FXStreet.
FXStreet and the author do not provide personalized recommendations. The author makes no representations as to the accuracy, completeness, or suitability of this information. FXStreet and the author will not be liable for any errors, omissions or any losses, injuries or damages arising from this information and its display or use. Errors and omissions excepted.
The author and FXStreet are not registered investment advisors and nothing in this article is intended to be investment advice.
Recommended Content
Editors’ Picks

Top 3 Price Prediction Bitcoin, Ethereum, Ripple: BTC, ETH, and XRP decline as President Trump’s team considers “broader and higher tariffs”
Bitcoin continues its decline, trading below $82,000 on Monday after falling 4.29% the previous week. Ethereum and Ripple followed BTC’s footsteps and declined by 9.88% and 12.40%, respectively.

XRP Price Forecast: Weak demand and rising supply could trigger a downtrend
Ripple's XRP is down 7% on Friday following bearish pressure from macroeconomic factors, including United States (US) President Donald Trump's tariff threats and rising US inflation.

Crypto Today: XRP, SOL and ETH prices tumble as South Carolina moves to buy up to 1 million BTC
Bitcoin price tumbled below the $85,000 support on Friday, plunging as low as $84,200 at press time. The losses sparked over $449 million in liquidations across the crypto derivatives markets.

Hackers accelerate ETH decline following $27 million dump, bearish macroeconomic factors
Ethereum (ETH) declined below $2,000 on Friday following a series of hacks traced to accounts of crypto exchange Coinbase users, which caused a loss of $36 million.

Bitcoin: BTC remains calm before a storm
Bitcoin's price has been consolidating between $85,000 and $88,000 this week. A K33 report explains how the markets are relatively calm and shaping up for volatility as traders absorb the tariff announcements. PlanB’s S2F model shows that Bitcoin looks extremely undervalued compared to Gold and the housing market.

The Best brokers to trade EUR/USD
SPONSORED Discover the top brokers for trading EUR/USD in 2025. Our list features brokers with competitive spreads, fast execution, and powerful platforms. Whether you're a beginner or an expert, find the right partner to navigate the dynamic Forex market.