Cardano Price Forecast: ADA battles this crucial barrier for the ultimate liftoff to $0.4
- Cardano’s recovery from support at $0.23 stalls under $0.32; bulls battle for a breakout at the ascending parallel channel.
- The IOMAP reveals ADA/USD is seating on an area with immense support from $0.29 to $0.3.

Cardano is among the altcoins that have recorded double-digit gains over the last 24 hours. The price action must have followed Bitcoin’s surge above $37,000. ADA is trading at $0.31 after accruing over 10% in gains. The main aim is to bring down the resistance at $0.32 while focusing on the rest of the journey to $0.4.
Cardano bulls flexing muscles for gains eyeing $0.4
The aspiring Ethereum competitor for smart contract execution is trading closer to an ascending parallel channel’s upper boundary. Following the breakdown to $0.23 earlier in the week, buyers rejoined the market mid-week, pulling the price above $0.3.
Meanwhile, the immediate upside is limited by the upper boundary, while the 50 Simple Moving Average protects Cardano’s downside. Both of these levels remain critical to the anticipated run-up to $0.4.
A break above the ascending channel would clear the path to the north. On the other hand, holding above the 50 SMA will allow buyers to embrace stability as they focus on higher price levels.
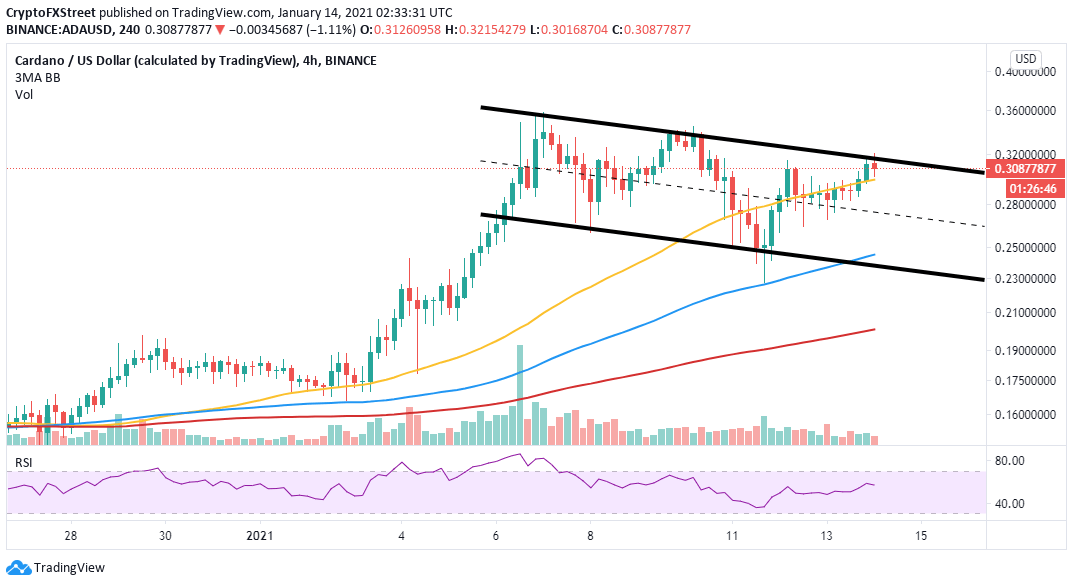
ADA/USD 4-hour chart
The IOMAP model by IntoTheBlock emphasizes the delay being encountered in the region between $0.32 and $0.33. Here, roughly 23,200 addresses had previously bought approximately 1.6 billion ADA. Trading above this area would boost Cardano toward $0.4.
On the downside, the IOMAP reveals immense support between $0.29 and $0.3. Here, nearly 23,400 addresses had previously purchased roughly 2.9 billion ADA. It is unlikely that the bears will easily slice through this buyer congestion zone to push for a return to $0.23.
-637461905112709396.png)
Cardano IOMAP chart
On the other hand, it is vital to note that despite the support accorded to Cardano, the token is not out of the wounds until it starts to trade above the ascending channel and the on-chain resistance between $0.32 and $0.33.
Notably, trading under the 50 SMA on the 4-hour chart may see sell orders surge. The increase in overhead pressure could well force ADA through the IOMAP support ($0.29 to $0.30). A bearish leg may also retest the middle boundary of the channel as well as the recent support at $0.23.
Author

John Isige
FXStreet
John Isige is a seasoned cryptocurrency journalist and markets analyst committed to delivering high-quality, actionable insights tailored to traders, investors, and crypto enthusiasts. He enjoys deep dives into emerging Web3 tren


