Cardano Price Forecast: ADA achieves a breakthrough, here’s where it could go next
- Cardano price ended last week up 8.50% and recorded the third consecutive positive week.
- ADA broke out from a symmetrical triangle pattern and registered a daily and weekly close above the strategic 2018 high of $1.40.
- The 50-day simple moving average (SMA) has turned higher, introducing new, credible support for the current rally.

Cardano price printed a daily close above the 2018 high on August 6, marking the first time since July 7 and establishing a basis to extend the rally beyond the July 4 high of $1.50 based on the measured move of the symmetrical triangle. Moving forward, ADA needs to confirm the rise above $1.40 with a daily close above $1.50 before investors can confidently adopt a bullish narrative for the cryptocurrency.
Cardano price close, but still far from shining again
Cardano price has climbed 40% since July 21, based on the price at writing. It is a strong return, but compared to other altcoins, it is subpar, with Ethereum, for example, climbing over 70%. However, the resulting resolution of the symmetrical triangle has motivated ADA to close above the 2018 high of $1.40 on a daily and weekly basis, generating a minor breakthrough for the digital token.
The measured move of the symmetrical triangle is almost 22%, proposing an ADA price target of $1.74 from the breakout above the triangle’s upper trend line on August 5 and the potential for Cardano price to rally an additional 18% before tagging the target.
A boost to the ADA outlook for better outcomes is activating the bullish Golden Cross pattern on the six-hour chart, increasing the momentum quotient for Cardano price. The previous Golden Cross on the six-hour chart was noted in November 2020, before the 80% jump in the month.
If Cardano price does gain additional upside momentum from the Golden Cross, ADA has the potential to test the June 3 high of $1.89, representing a gain of over 28% from the current price.
A daily close below the 2018 high introduces a challenge for the developing bullish narrative. Thus it is essential that Cardano price sticks above $1.40 or risk defining the top of another failed ADA rally above the critical level, as was the case in early July.
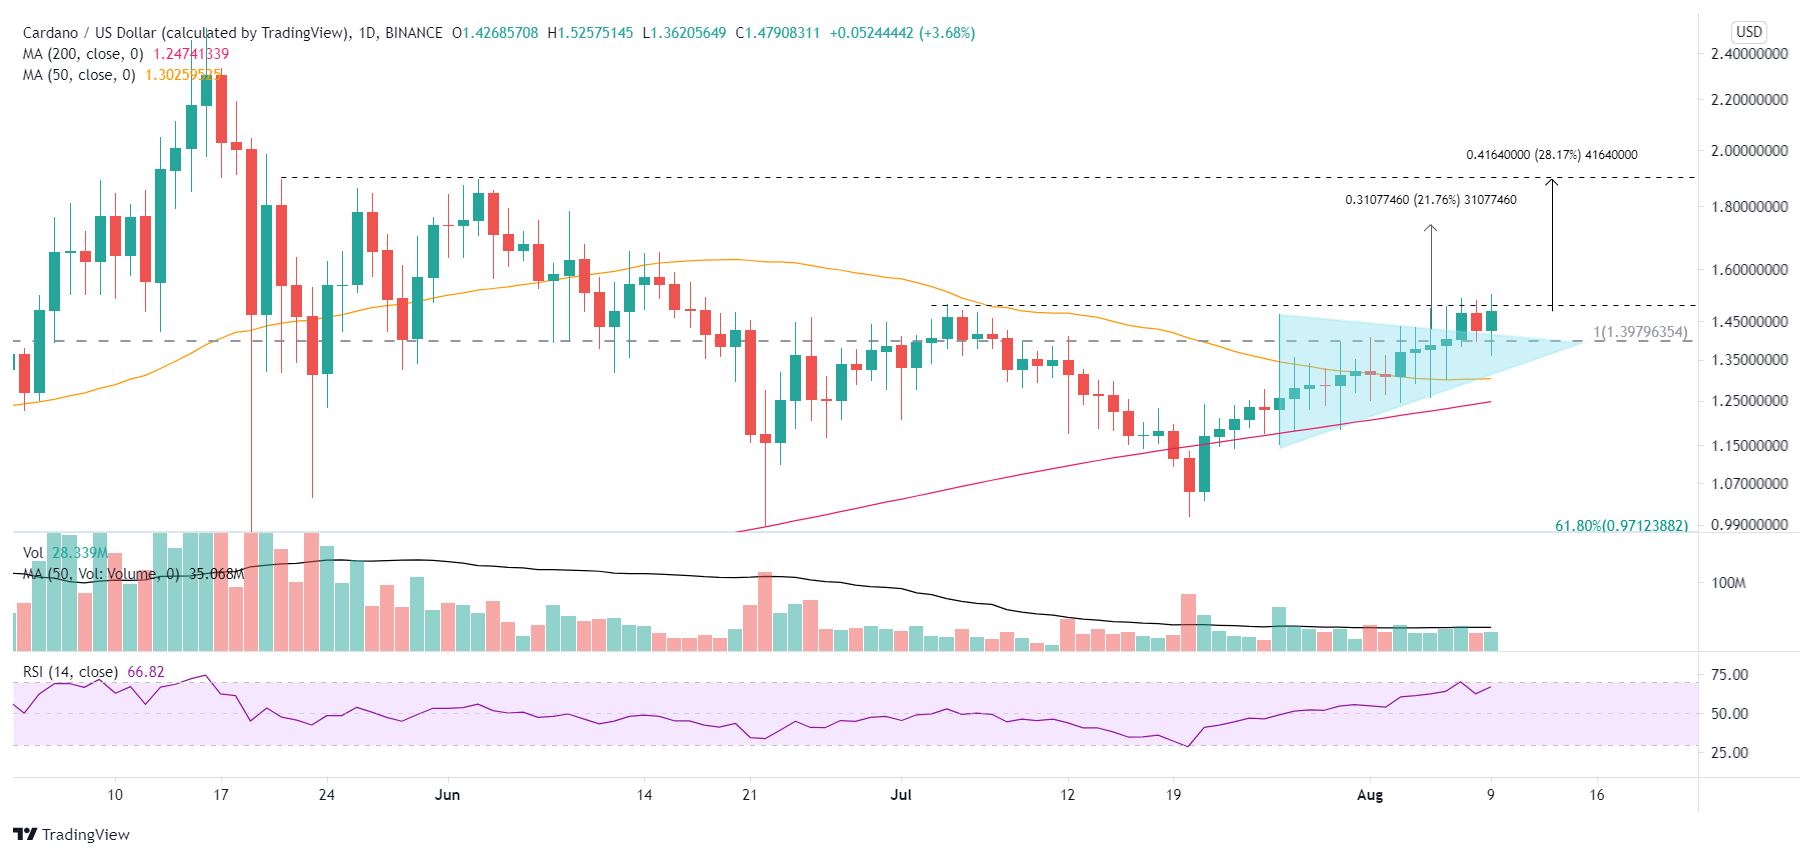
ADA/USD daily chart
Of course, Cardano price could struggle and lose the 2018 high. The downside levels of importance include the bottoming 50-day SMA at $1.30 and the 200-day SMA at $1.24.
ADA is on the cusp of shining again, but it will require a daily close above the July 4 high of $1.50 to be confirmed. Nevertheless, the pieces are coming together, such as the successful breakout from a symmetrical triangle continuation pattern, the weekly close above $1.40 and the Golden Cross on the six-hour chart.
Here, FXStreet's analysts evaluate where ADA could be heading next.
Author

Sheldon McIntyre, CMT
Independent Analyst
Sheldon has 24 years of investment experience holding various positions in companies based in the United States and Chile. His core competencies include BRIC and G-10 equity markets, swing and position trading and technical analysis.


