- Cardano price is traversing a symmetrical triangle pattern, suggesting that a 16% explosive move is likely.
- A decisive close above the setup’s lower trend line will knock ADA down to the $1.99 to $2.10 demand zone.
- Transactional data shows that the resistance barriers are hogging the bulls’ path.
Cardano price has been on a tight consolidative move for more than a month. However, this coiling up is a precursor to an explosive move. While on-chain metrics are all hinting at a bearish outlook, technicals suggest that there is hope.
Cardano price shows lack of buyer interest
Cardano price has set up three distinctive lower highs and five higher lows since September 21. Connecting these trend lines shows that the price action is squeezed and reveals the formation of a symmetrical triangle.
Since this pattern has no directional bias, it could break out either way. The target for this technical formation is obtained by adding the distance between the first swing high and swing low to the breakout point.
While the situation might seem black and white, it is not. Investors can expect Cardano price to breach the lower trend line first and enter the demand zone ranging from $1.99 to $2.10.
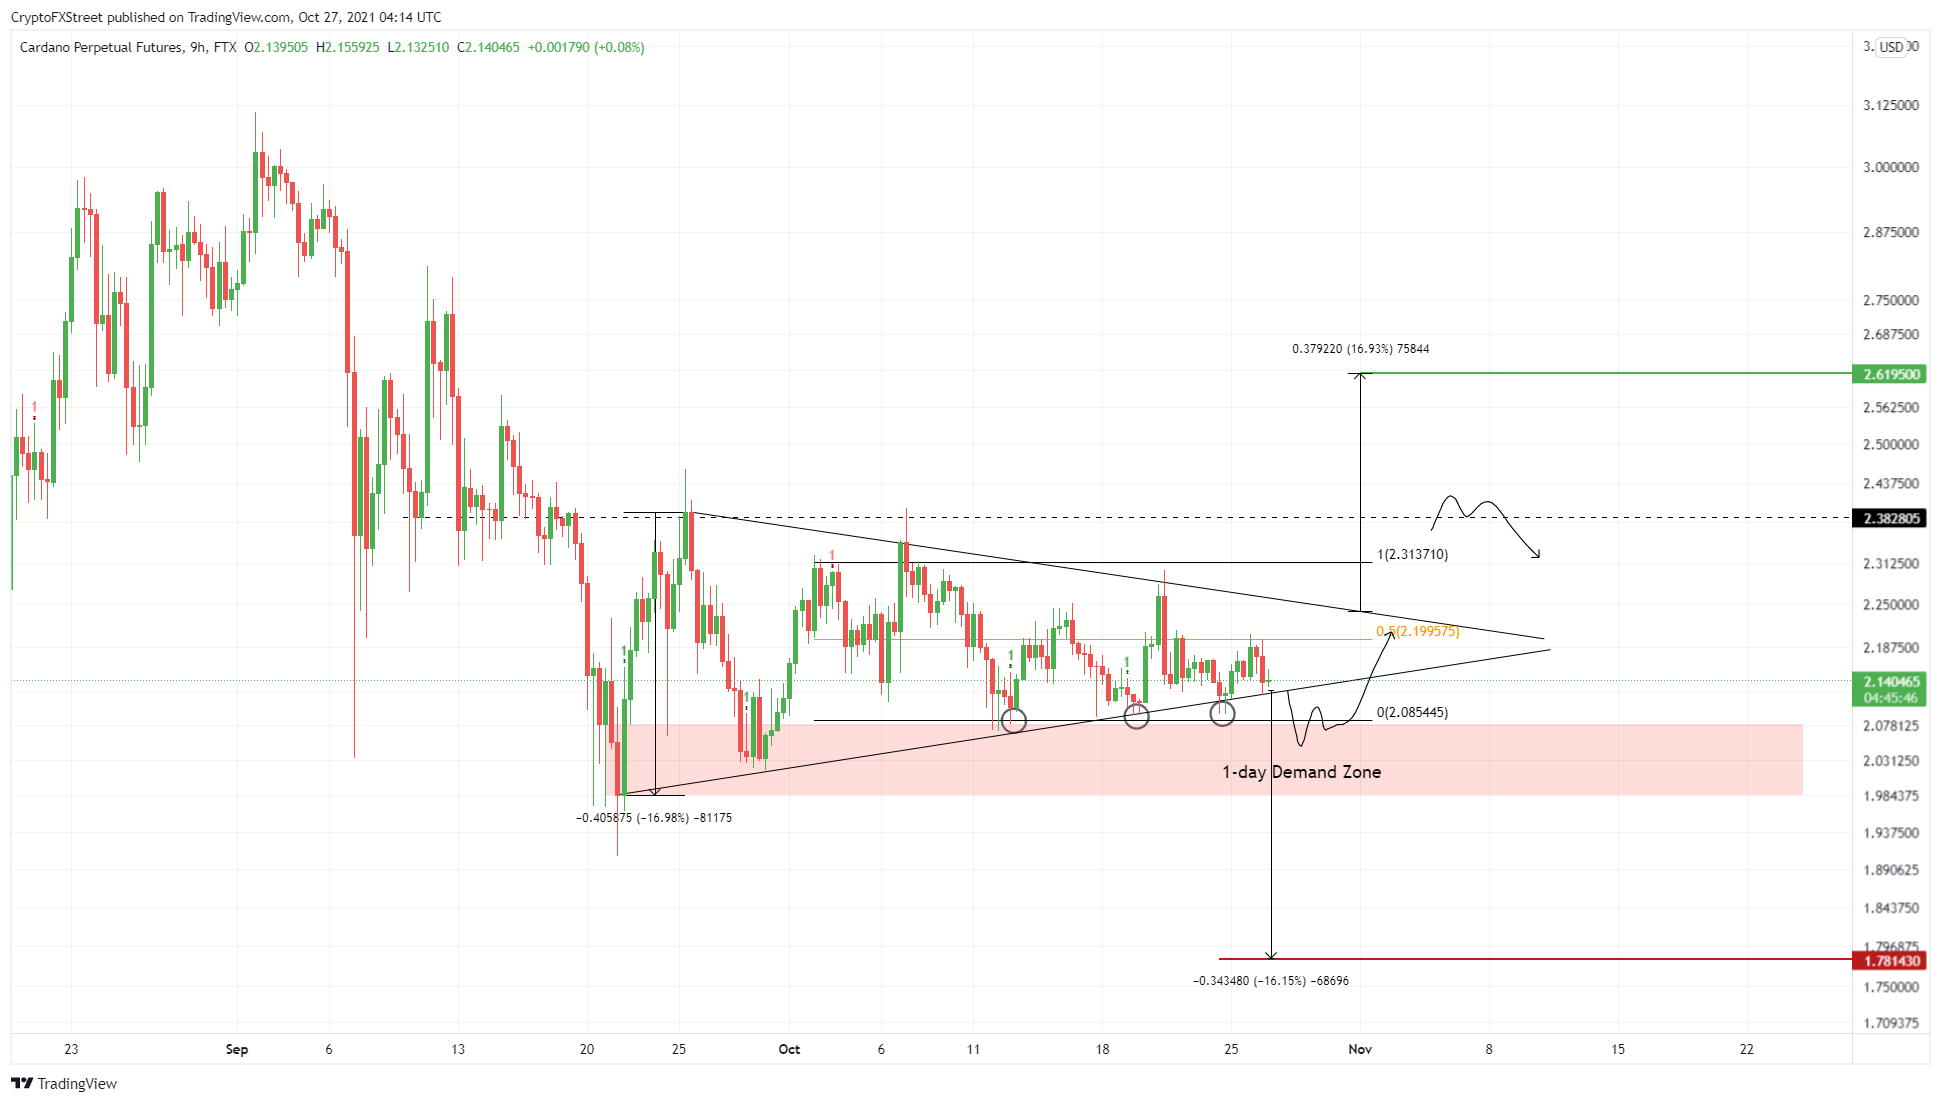
ADA/USDT 9-hour chart
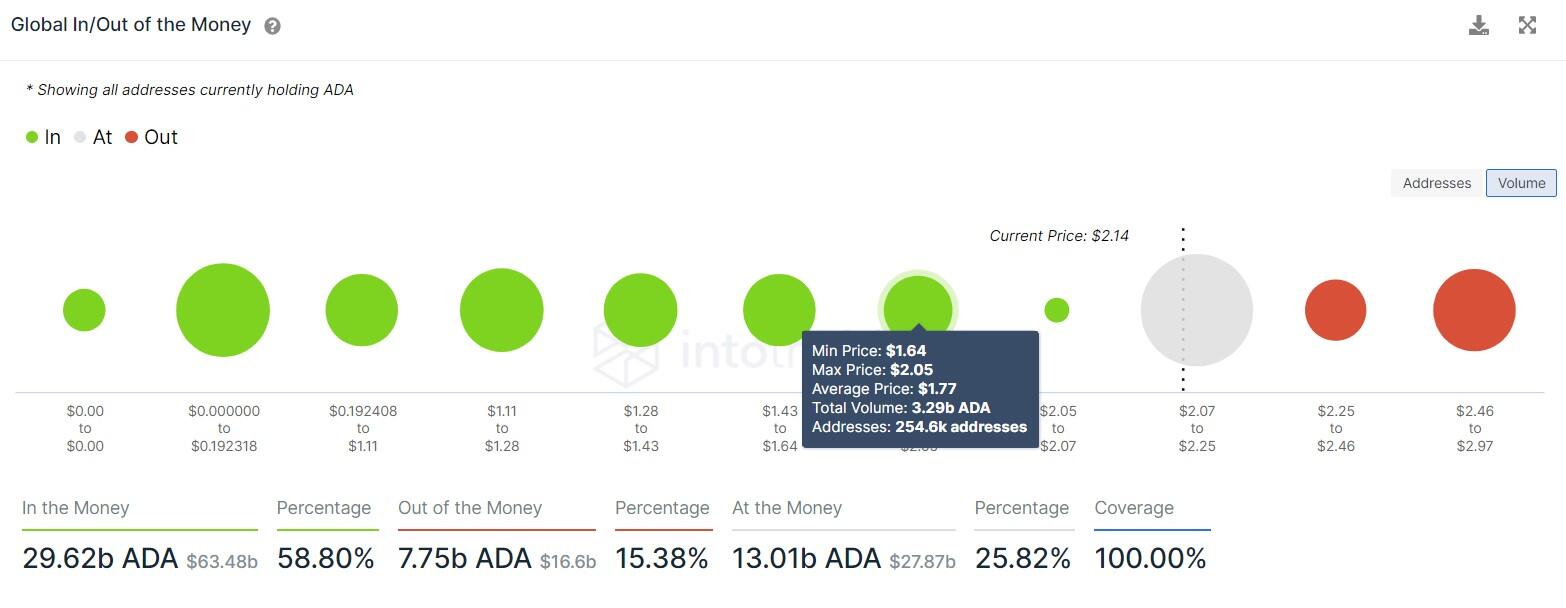
IntoTheBlock’s Global In/Out of the Money (GIOM) model shows that the immediate yet stable support level is $2.11, where roughly 147,87 addresses purchased a whopping 2.85 billion ADA.
Although the bullish move assumes that ADA bounces off the $1.99 to $2.10 demand zone, a decisive close below this area will put these investors “Out of the Money,” further increasing the selling pressure and invalidating the bullish thesis.
In this case, ADA might continue its descent and head toward its intended target at $1.78.

ADA GIOM chart
Further adding credence to the bearish outlook is the 60.7% decline in the number of large transactions worth $100,000 or more.
This on-chain metric serves as a proxy of high-net-worth individuals and can often help spot bullish trends. However, over the past six months, the number of such transactions has dropped from $3,500 to $1,370, indicating a reduction in institutional money flows.
ADA large transaction chart
While things are looking gloomy for the Ethereum killer, the demand zone ranging from $1.99 to $2.10 could be the salvation for bulls.
If the buying pressure increases, pushing ADA to re-enter the symmetrical triangle, there is still a chance that Cardano price will make a run at the upper trend line. A decisive close above $2.24 will put an end to the bearish thesis and indicate a bullish breakout from the symmetrical triangle, propelling ADA by 16% to $2.62.
Information on these pages contains forward-looking statements that involve risks and uncertainties. Markets and instruments profiled on this page are for informational purposes only and should not in any way come across as a recommendation to buy or sell in these assets. You should do your own thorough research before making any investment decisions. FXStreet does not in any way guarantee that this information is free from mistakes, errors, or material misstatements. It also does not guarantee that this information is of a timely nature. Investing in Open Markets involves a great deal of risk, including the loss of all or a portion of your investment, as well as emotional distress. All risks, losses and costs associated with investing, including total loss of principal, are your responsibility. The views and opinions expressed in this article are those of the authors and do not necessarily reflect the official policy or position of FXStreet nor its advertisers. The author will not be held responsible for information that is found at the end of links posted on this page.
If not otherwise explicitly mentioned in the body of the article, at the time of writing, the author has no position in any stock mentioned in this article and no business relationship with any company mentioned. The author has not received compensation for writing this article, other than from FXStreet.
FXStreet and the author do not provide personalized recommendations. The author makes no representations as to the accuracy, completeness, or suitability of this information. FXStreet and the author will not be liable for any errors, omissions or any losses, injuries or damages arising from this information and its display or use. Errors and omissions excepted.
The author and FXStreet are not registered investment advisors and nothing in this article is intended to be investment advice.
Recommended Content
Editors’ Picks

Crypto Today: Traders discuss Solana futures and Ethereum Hoodi update as Bitcoin price stalls at $83,000
Amid a 2% decrease in market capitalization, crypto trading volume surges 42% to $87.2 billion in the last 24 hours, signalling active capital rotation. Bitcoin price stagnates below $85,000 as Gold enters a record rally to $3,000 ahead of the US Fed rate decision.

Top 3 Price Prediction Bitcoin, Ethereum, Ripple: BTC, ETH, XRP gain as MicroStrategy buys $10.7 million BTC
Bitcoin (BTC) daily price chart shows signs of recovery in the largest cryptocurrency. Strategy, one of the largest corporate holders of Bitcoin, acquired another 130 BTC last week, according to an announcement on Monday.

Top Formula 1 crypto sponsors rally, racing fans gain from Binance Coin, OKB, ApeCoin and Crypto.com
The 2025 Formula 1 season kicked off in Australia last week with a lineup of crypto sponsors for half of the teams. Racing giants are powered by sponsors like crypto exchanges Binance, OKX, ApeCoin, and Crypto.com, among other NFT and trading platforms.

SEC pumps brakes on altcoin ETFs, institutional interest remains
The US SEC postponed its decisions on several spot altcoin ETF applications this week, including those for Litecoin, XRP and Solana. A K33 Research report shows there is consensus but the agency is waiting the confirmation of Trump’s nominee for SEC Chair.

Bitcoin: BTC at risk of $75,000 reversal as Trump’s trade war overshadows US easing inflation
Bitcoin price remained constrained within a tight 8% channel between $76,000 and $84,472 this week. With conflicting market catalysts preventing prolonged directional swings, here are key factors that moved BTC prices this week, as well as key indicators to watch in the weeks ahead.

The Best brokers to trade EUR/USD
SPONSORED Discover the top brokers for trading EUR/USD in 2025. Our list features brokers with competitive spreads, fast execution, and powerful platforms. Whether you're a beginner or an expert, find the right partner to navigate the dynamic Forex market.