Cardano Price Analysis: ADA eyes potential upswing to $1.4 all-time high
- Cardano's uptrend is still intact and could breakout to a $1.4 all-time high.
- The IOMAP shows that little resistance stands in the way of ADA's potential rally.
- A correction will take place if Cardano fails to overcome the ascending channel middle boundary resistance.
Cardano has not relented on the ongoing uptrend since December. The aim has been to hit the all-time high at $1.4. Meanwhile, ADA is trading at $0.68 after a rejection from the recent high close to $0.8.
Cardano bulls challenge crucial resistance
The aspiring smart contract token has been trading within the confines of an ascending parallel channel. For now, ADA's immediate upside has been capped under the middle boundary. Overcoming the resistance at this level is key to encouraging buyers to join the market to anticipate a spike to levels above $0.8.
The Relative Strength Index (RSI) on the 4-hour chart has held above 70 following a retreat from the overbought region. Re-entering this region will stir the market, triggering buy orders as the price rises to new highs.
Similarly, the 50 Simple Moving Average expands the gap above the 100 SMA and the 200 SMA. This confirms that the trend has a bullish impulse and could favor a spike above $0.8 resistance. Note that Cardano trading above this critical hurdle should attract more investors to support the rally to $1.4.
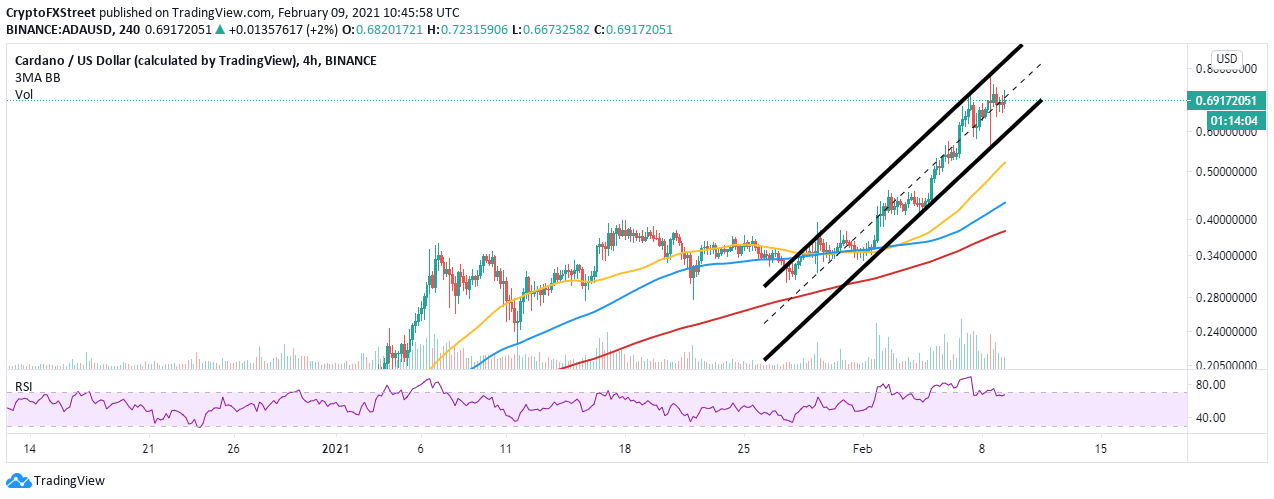
ADA/USD 4-hour chart
IntoTheBlock's IOMAP model reveals little resistance ahead of Cardano. Hence, the least resistance path is upwards. However, the seller congestion between $0.688 and $0.69 will have to be dispersed to complete the leg toward $0.4.
On the other hand, immense support has been accorded to Cardano, as shown by the model. The most robust buyer concentration area runs from $0.66 to $0.688. Here, roughly 28,000 ADA had previously bought 2.8 billion ADA. It is doubtful that losses can slice through this zone in the near term, which adds credence to the uptrend.
-637484657130068239.png)
Looking at the other side of the fence
It is worth keeping in mind that that failure to gain ground above the ascending channel middle boundary would heighten the overhead pressure on Cardano. A correction will seek refuge at the lower edge of the channel, but if push comes to shove, declines may extend to the 50 SMA, currently at $0.5. Other vital levels to keep in mind include the 100 SMA, holding at $0.43, and the 2000 SMA holding at $0.38.
Author

John Isige
FXStreet
John Isige is a seasoned cryptocurrency journalist and markets analyst committed to delivering high-quality, actionable insights tailored to traders, investors, and crypto enthusiasts. He enjoys deep dives into emerging Web3 tren