Cardano Price Analysis: ADA bulls shudder as critical bearish pattern threatens freefall to $0.8
- A double-top pattern on the 4-hour chart spells doom for Cardano.
- The IOMAP model reveals intense resistance ahead of Cardano, validating the bearish narrative.
- If support at the 50 SMA holds, ADA may avoid the losses targeting $0.8.

Cardano is trading marginally above $1 after recovering from the rabbit hole around $0.8. The uptrend has hit a snag slightly under $1.2 following the formation of a technical pattern. Declines are likely to continue if Cardano fails to secure higher support, preferably above $1.
Cardano risks breakdown under $1
The 4-hour chart shows the formation of a double-top pattern. This is a bearish technical pattern indicating the beginning of a trend reversal. The pattern forms after an asset increases in price but hits a barrier, leading to a correction (the trough). Consequently, bulls regain control, pulling the price upward but lose steam at the previous barrier.
Immense selling pressure is expected at this level and often results in a massive breakdown. If the retracement is left unchecked, Cardano may fall toward the recent support at $0.8. Traders must wait for the confirmation of the pattern to avoid false breakdowns. In this case, trading under the 50 SMA may trigger massive seller orders, adding to the overhead pressure.
Similarly, the Moving Average Convergence Divergence (MACD) could flip bearish in the short-term. This indicator can identify positions to buy the bottom or sell the top. If the MACD line (blue) crosses below the signal line, Cardano may drop significantly.
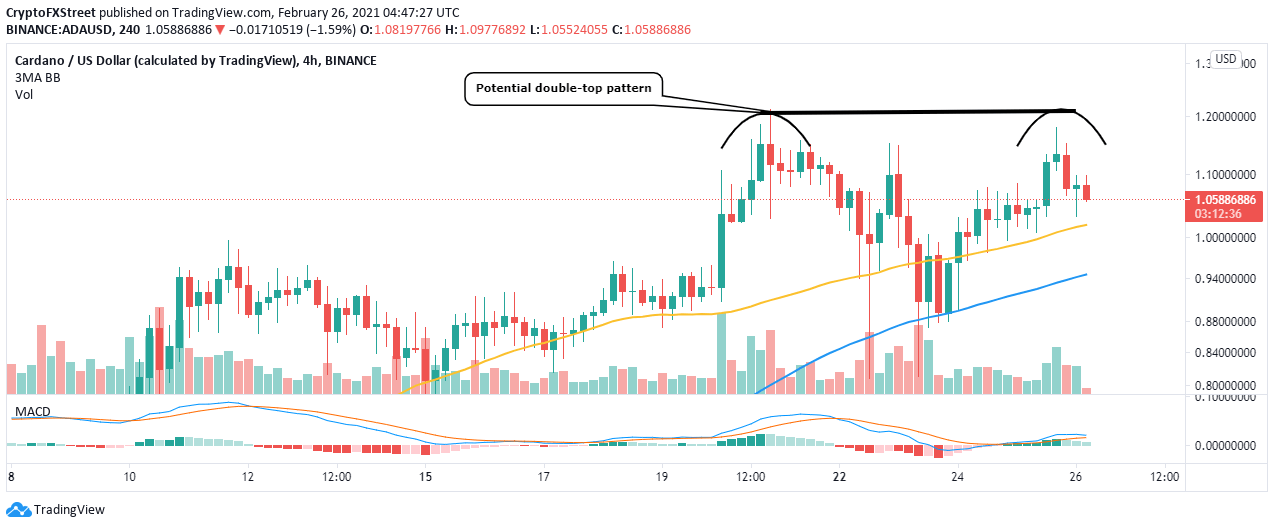
ADA/USD 4-hour chart
According to the IOMAP model by IntoTheBlock, one of the leading on-chain analytics platforms, Cardano’s upside is heavily barricaded. A robust seller concentration zone runs from $1.07 to $1.1, whereby nearly 45,000 addresses had previously purchased around $2.6 billion ADA. Trading above this area will be an uphill battle, especially with the worsening technical picture.
On the downside, relatively strong support has been established between $0.97 and $1. Here, roughly 61,000 addresses had previously bought approximately 1.6 billion ADA. Note that Cardano could slice through this zone if selling orders are triggered at the 50 SMA on the 4-hour chart, paving the way for declines toward $0.8.
-637499128359384589.png)
Cardano IOMAP chart
Looking at the other side of the fence
The ongoing downtrend may be cut short as long as bulls firmly hold onto the support at 50 SMA. Moreover, the bearish narrative may be ignored if the MACD line sustains the position above the midline on the 4-hour chart. Holding above $1 will allow buyers an opportunity to focus on higher levels at $1.2 and the all-time high at $1.4.
Author

John Isige
FXStreet
John Isige is a seasoned cryptocurrency journalist and markets analyst committed to delivering high-quality, actionable insights tailored to traders, investors, and crypto enthusiasts. He enjoys deep dives into emerging Web3 tren


