Cardano Elliott Wave technical analysis [Video]
![Cardano Elliott Wave technical analysis [Video]](https://editorial.fxstreet.com/images/Markets/Currencies/Cryptocurrencies/Coins/Cardano/cardano_XtraLarge.jpg)
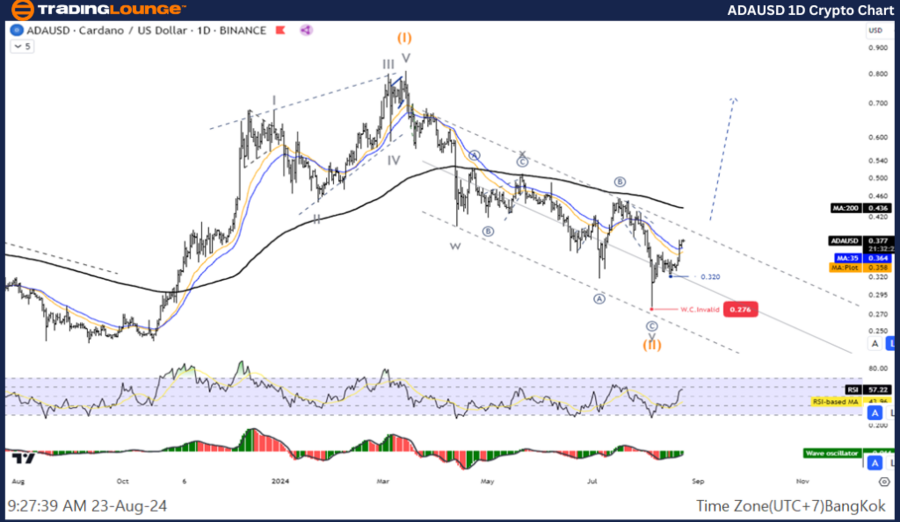
ADA/USD Elliott Wave technical analysis
Function: Counter Trend
Mode: Corrective
Structure: Double Corrective
Position: Wave Y
Direction next higher degrees: Wave (II)
Details: The decline of wave Y is likely to end and the price is re-entering the uptrend.
Cardano/ U.S. dollar (ADAUSD) Trading Strategy: Overall the correction in wave (II) position is likely to end and price is now rising again in wave (III). Look for an opportunity to join the uptrend from a short-term pullback.
Cardano/ U.S. dollar (ADAUSD)Technical Indicators: The price is above the MA200 indicating an Uptrend, The Wave Oscillator is a Bullish Momentum.
ADA/USD one-day chart
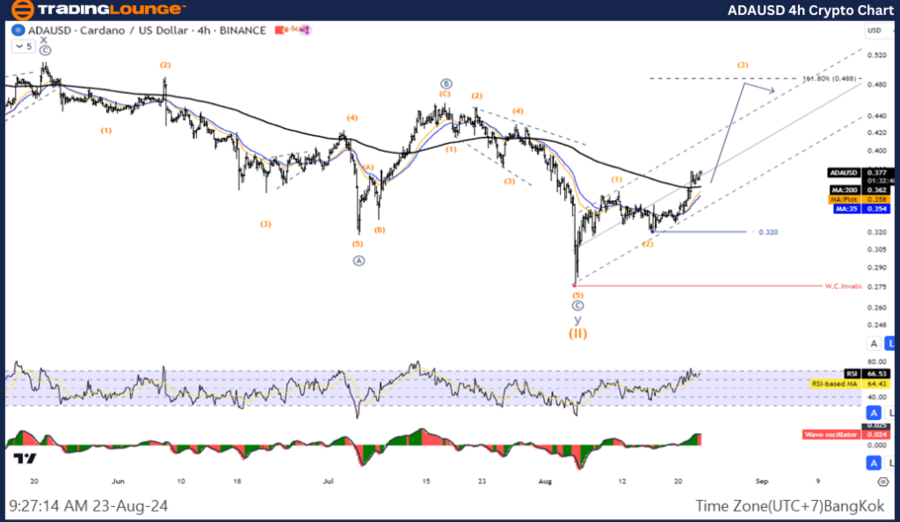
ADA/USD Elliott Wave technical analysis
Function: Counter Trend
Mode: Corrective
Structure: Double Corrective
Position: Wave Y
Direction next higher degrees: Wave (II)
Details: The decline of wave Y is likely to end and the price is re-entering the uptrend.
Cardano/ U.S. dollar (ADAUSD) Trading Strategy: Overall the correction in wave (II) position is likely to end and price is now rising again in wave (III). Look for an opportunity to join the uptrend from a short-term pullback.
Cardano/ U.S. dollar (ADAUSD)Technical Indicators: The price is above the MA200 indicating an Uptrend, The Wave Oscillator is a Bullish Momentum.
ADA/USD four-hour chart
Cardano Elliott Wave technical analysis [Video]
Author

Peter Mathers
TradingLounge
Peter Mathers started actively trading in 1982. He began his career at Hoei and Shoin, a Japanese futures trading company.


