Can Zilliqa price recover above this key level and prevent a 45% nosedive?
- Zilliqa price has been caught in a profit-taking move since its all-time high at $0.230 on April 1.
- Recently, ZIL slipped below the $0.097 to $0.121 demand zone, flipping it into a bearish breaker and hinting at a massive crash.
- A daily candlestick close above $0.121 will invalidate the bearish thesis.

Zilliqa price dropped below a significant level, indicating that the buyers have lost the race. This development is key as it forecasts a massive crash for ZIL and its holders.
Zilliqa price to explode to the downside
Zilliqa price rallied roughly 400% as it exploded from $0.046 to $0.230. Interestingly, this exponential move was completed in a week, causing ZIL to set an all-time high at $0.230. While impressive, this move caused a lot of the investors to book profits, resulting in a trend reversal.
As of writing, Zilliqa price has crashed roughly 60% to $0.093 to where it currently trades. More importantly, ZIL has sliced through the $0.097 to $0.0121 demand zone that was formed on March 28.
As ZIL dropped 10% on April 26, the said demand zone was undone, flipping it into a bearish breaker. This technical formation forecasts a rejection on the retest of the breaker. Therefore, as Zilliqa price tries to head higher, a move inside the breaker will lead to a correction that has the chance to fill the fair value gap, ranging from $0.097 to $0.050.
In summary, Zilliqa price could crash roughly 45% on the retest of the breaker’s lower limit at $0.097.
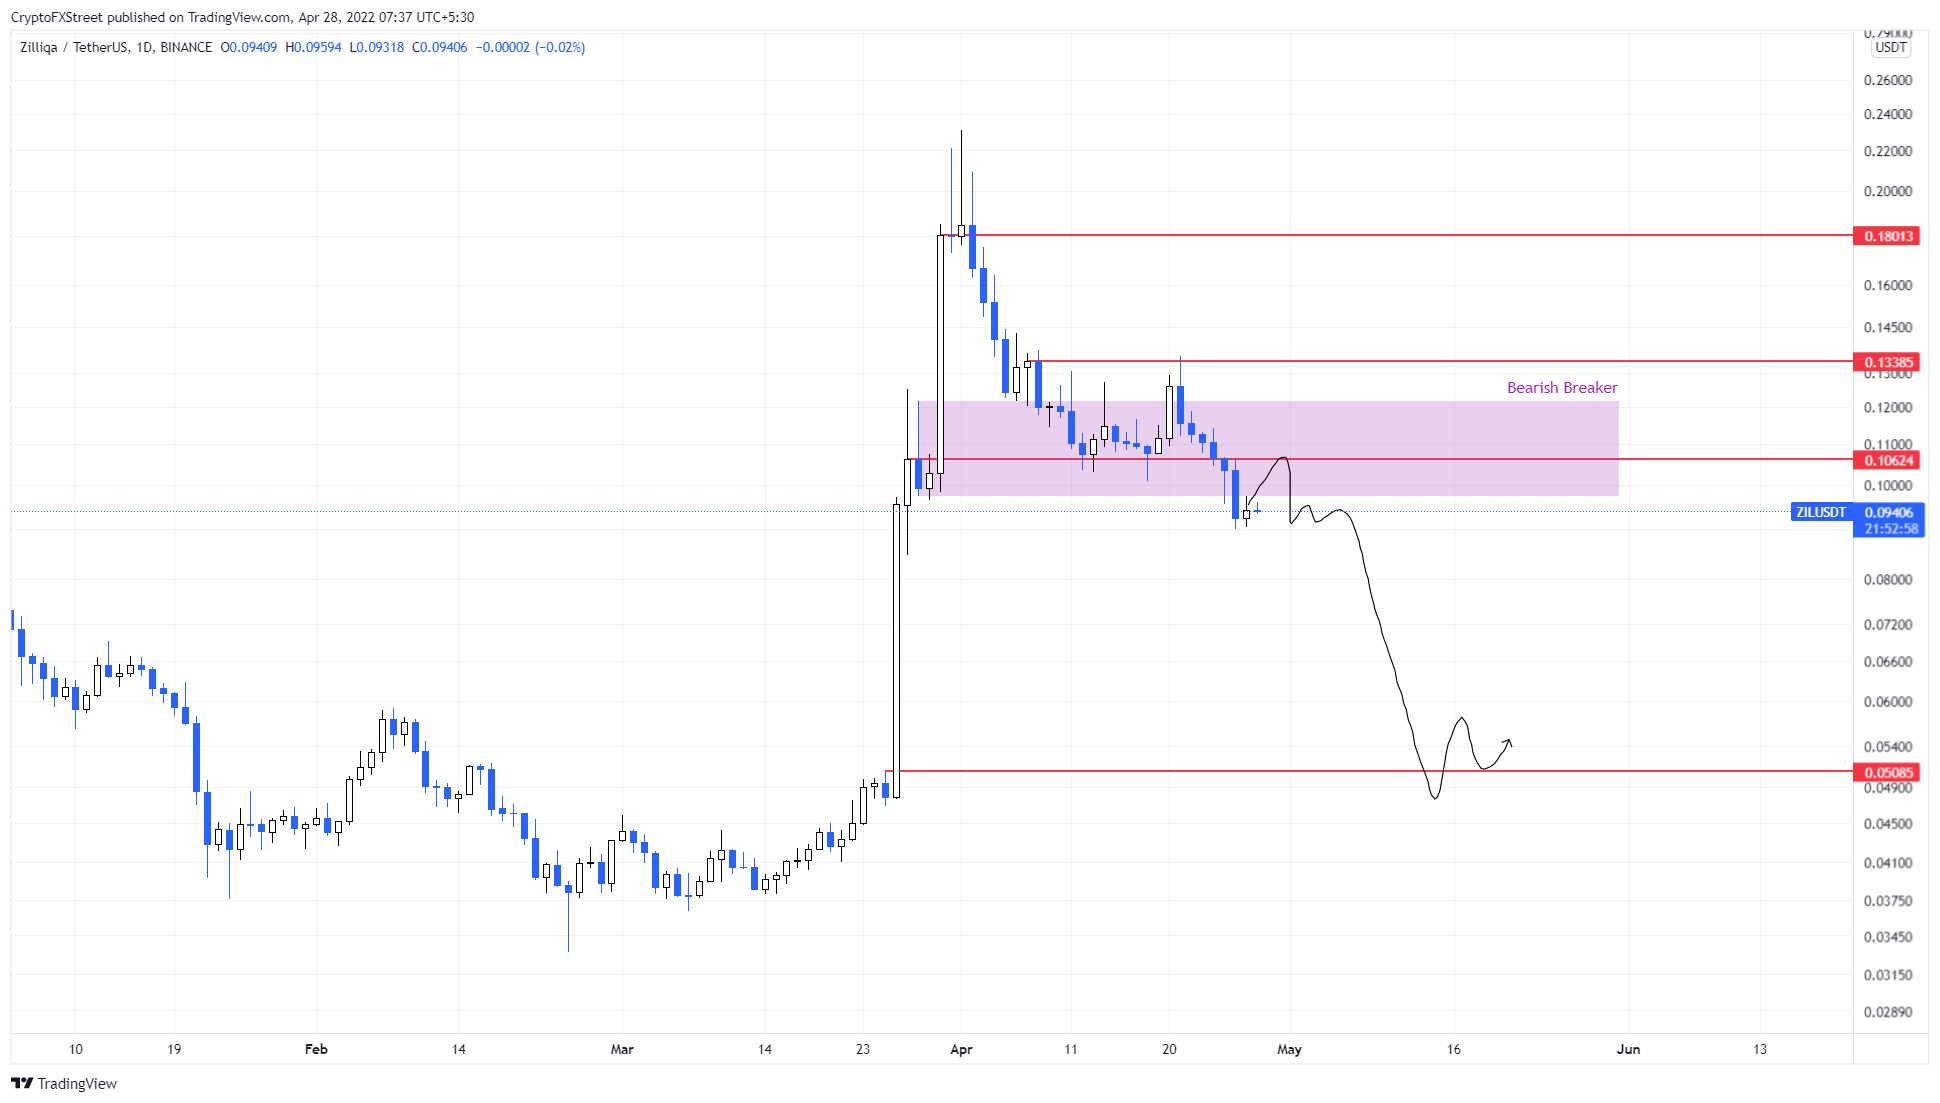
ZIL/USDT 1-day chart
On the other hand, a daily candlestick close above $0.121 will invalidate the bearish thesis for Zilliqa price. This move indicates that the buyers are back in control and in such a case, ZIL could kick-start a 12% upswing to $0.133.
Author

Akash Girimath
FXStreet
Akash Girimath is a Mechanical Engineer interested in the chaos of the financial markets. Trying to make sense of this convoluted yet fascinating space, he switched his engineering job to become a crypto reporter and analyst.


