• Shiba Inu price has set up a technical setup known as exaggerated divergence, hinting at an uptrend.
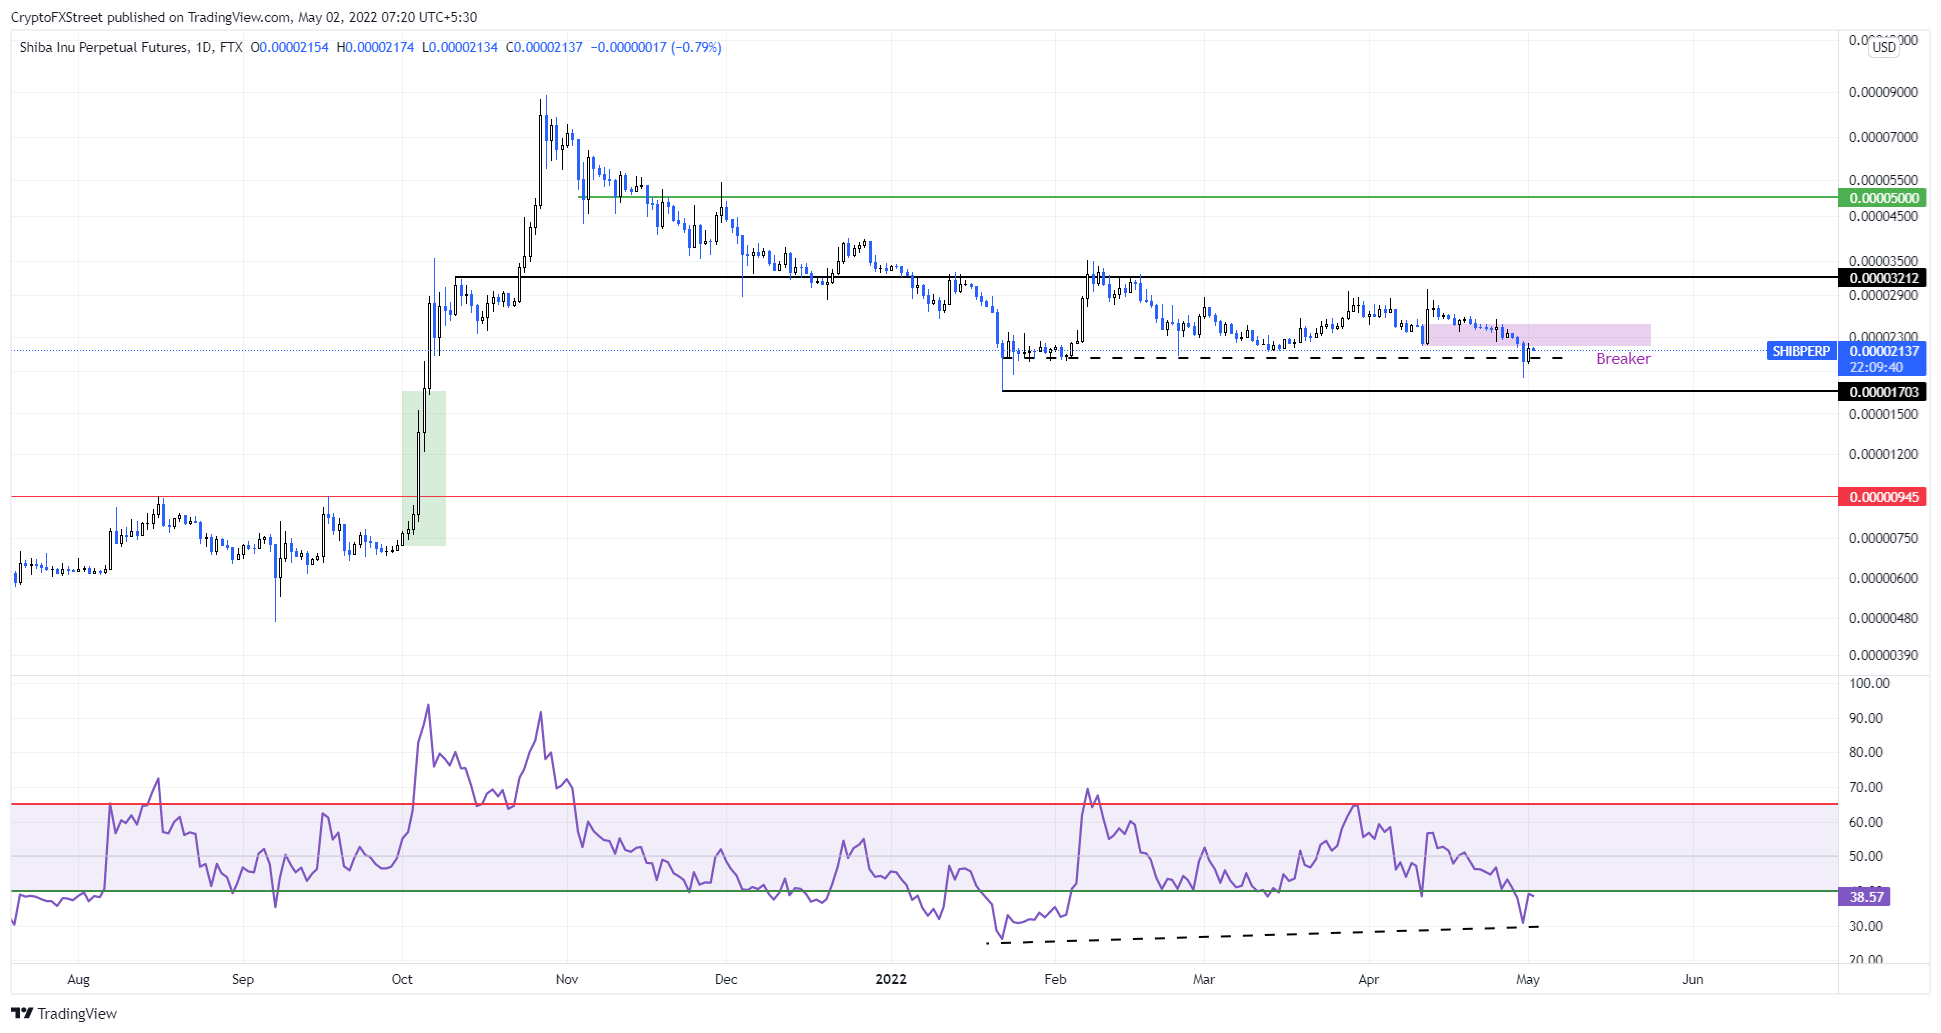
  • Investors need to wait until SHIB breaks through the $0.0000218 to $0.0000246 breaker to reach $0.0000321.
  • A daily candlestick close below $0.0000170 will invalidate the bullish thesis.

Shiba Inu price shows potential for an uptrend as it forms a specific bullish pattern on the daily time frame. This formation could trigger a move for SHIB to retest a significant level after a decent uptrend.

Shiba Inu price readies its propulsion system

Shiba Inu price produced somewhat of an equal low around the $0.0000203 level, making it into a makeshift support level for the time being. This development occurred after SHIB crashed 10% on April 30 to breach the $0.0000218 to $0.0000246 demand zone.

This downswing flipped the said demand zone into a breaker that will prevent any further ascent. Therefore, any uptick in buying pressure needs to overcome the trapped investors’ sell pressure to see a move higher.

One of the proponents of an upswing is the Relative Strength Index (RSI), which is currently dipping into the oversold territory of around 30. Often, reversals occur when the asset is extremely oversold. 

To add credence, the RSI is producing a higher high, indicating that the momentum is increasing and the Shiba Inu price has produced equal lows around $0.0000203. This technical formation is known as the exaggerated bullish divergence setup.

This setup forecasts and foreshadows an upswing. Therefore, a daily candlestick close above the breaker’s upper limit at $0.0000246 will indicate the resurgence of buyers. In such a case, SHIB will trigger a run to $0.0000321, constituting a 50% ascent from the current position at $0.0000213.

SHIB/USDT 4-hour chart

SHIB/USDT 4-hour chart

Regardless of the bullishness of the setup, Shiba Inu price needs to stay neutral, which will happen if it does not produce a lower low. However, a daily candlestick close below $0.0000170 will create a lower low and invalidate the bullish thesis for Shiba Inu price. 

In such a case, SHIB could trigger a swift crash to $0.0000094 due to the fair value gap that extends from $0.0000170 to $0.000071.


Information on these pages contains forward-looking statements that involve risks and uncertainties. Markets and instruments profiled on this page are for informational purposes only and should not in any way come across as a recommendation to buy or sell in these assets. You should do your own thorough research before making any investment decisions. FXStreet does not in any way guarantee that this information is free from mistakes, errors, or material misstatements. It also does not guarantee that this information is of a timely nature. Investing in Open Markets involves a great deal of risk, including the loss of all or a portion of your investment, as well as emotional distress. All risks, losses and costs associated with investing, including total loss of principal, are your responsibility. The views and opinions expressed in this article are those of the authors and do not necessarily reflect the official policy or position of FXStreet nor its advertisers. The author will not be held responsible for information that is found at the end of links posted on this page.

If not otherwise explicitly mentioned in the body of the article, at the time of writing, the author has no position in any stock mentioned in this article and no business relationship with any company mentioned. The author has not received compensation for writing this article, other than from FXStreet.

FXStreet and the author do not provide personalized recommendations. The author makes no representations as to the accuracy, completeness, or suitability of this information. FXStreet and the author will not be liable for any errors, omissions or any losses, injuries or damages arising from this information and its display or use. Errors and omissions excepted.

The author and FXStreet are not registered investment advisors and nothing in this article is intended to be investment advice.

Recommended content


Recommended Content

Editors’ Picks

Crypto market wipes out $1 billion in liquidation as Asian markets bleed red 

Crypto market wipes out $1 billion in liquidation as Asian markets bleed red 

The crypto markets continue to decline on Monday, with Bitcoin (BTC) falling below $78,000. The Asian markets also traded in the red, with Japan’s stock market extending losses to 8.5%, its lowest level since October 2023.

More Cryptocurrencies News
XRP Price Prediction: XRP hangs on a loose thread, deeper correction below $2 impending?

XRP Price Prediction: XRP hangs on a loose thread, deeper correction below $2 impending?

Ripple (XRP) is extending losses below the previous week’s critical level at $2.00, as United States (US) President Donald Trump doubled down on tariffs, stressing that America must solve the trade deficit before making a deal.

More Ripple News
Top 3 Price Prediction Bitcoin, Ethereum, Ripple: BTC and XRP head to yearly lows while ETH hits two-year bottom

Top 3 Price Prediction Bitcoin, Ethereum, Ripple: BTC and XRP head to yearly lows while ETH hits two-year bottom

Bitcoin (BTC) price hovers around $78,600 on Monday after falling nearly 5% the previous week. Ethereum (ETH) and Ripple (XRP) also followed in BTC’s footsteps and declined 13% and 10%, respectively, in the previous week.

More Cryptocurrencies News
Bitcoin could be the winner in the ongoing trade war after showing signs of decoupling from stocks

Bitcoin could be the winner in the ongoing trade war after showing signs of decoupling from stocks

Bitcoin (BTC) traded above $84,000 on Friday, showing strength despite the stock market experiencing significant declines. The market reaction stems from United States (US) President Donald Trump's clash with the Federal Reserve Chairman Jerome Powell over interest rate decisions.

More Bitcoin News
Bitcoin Weekly Forecast: Tariff ‘Liberation Day’ sparks liquidation in crypto market

Bitcoin Weekly Forecast: Tariff ‘Liberation Day’ sparks liquidation in crypto market

Bitcoin (BTC) price remains under selling pressure and trades near $84,000 when writing on Friday after a rejection from a key resistance level earlier this week.

Read full analysis
The Best brokers to trade EUR/USD

The Best brokers to trade EUR/USD

SPONSORED Discover the top brokers for trading EUR/USD in 2025. Our list features brokers with competitive spreads, fast execution, and powerful platforms. Whether you're a beginner or an expert, find the right partner to navigate the dynamic Forex market.

Read More

BTC

ETH

XRP