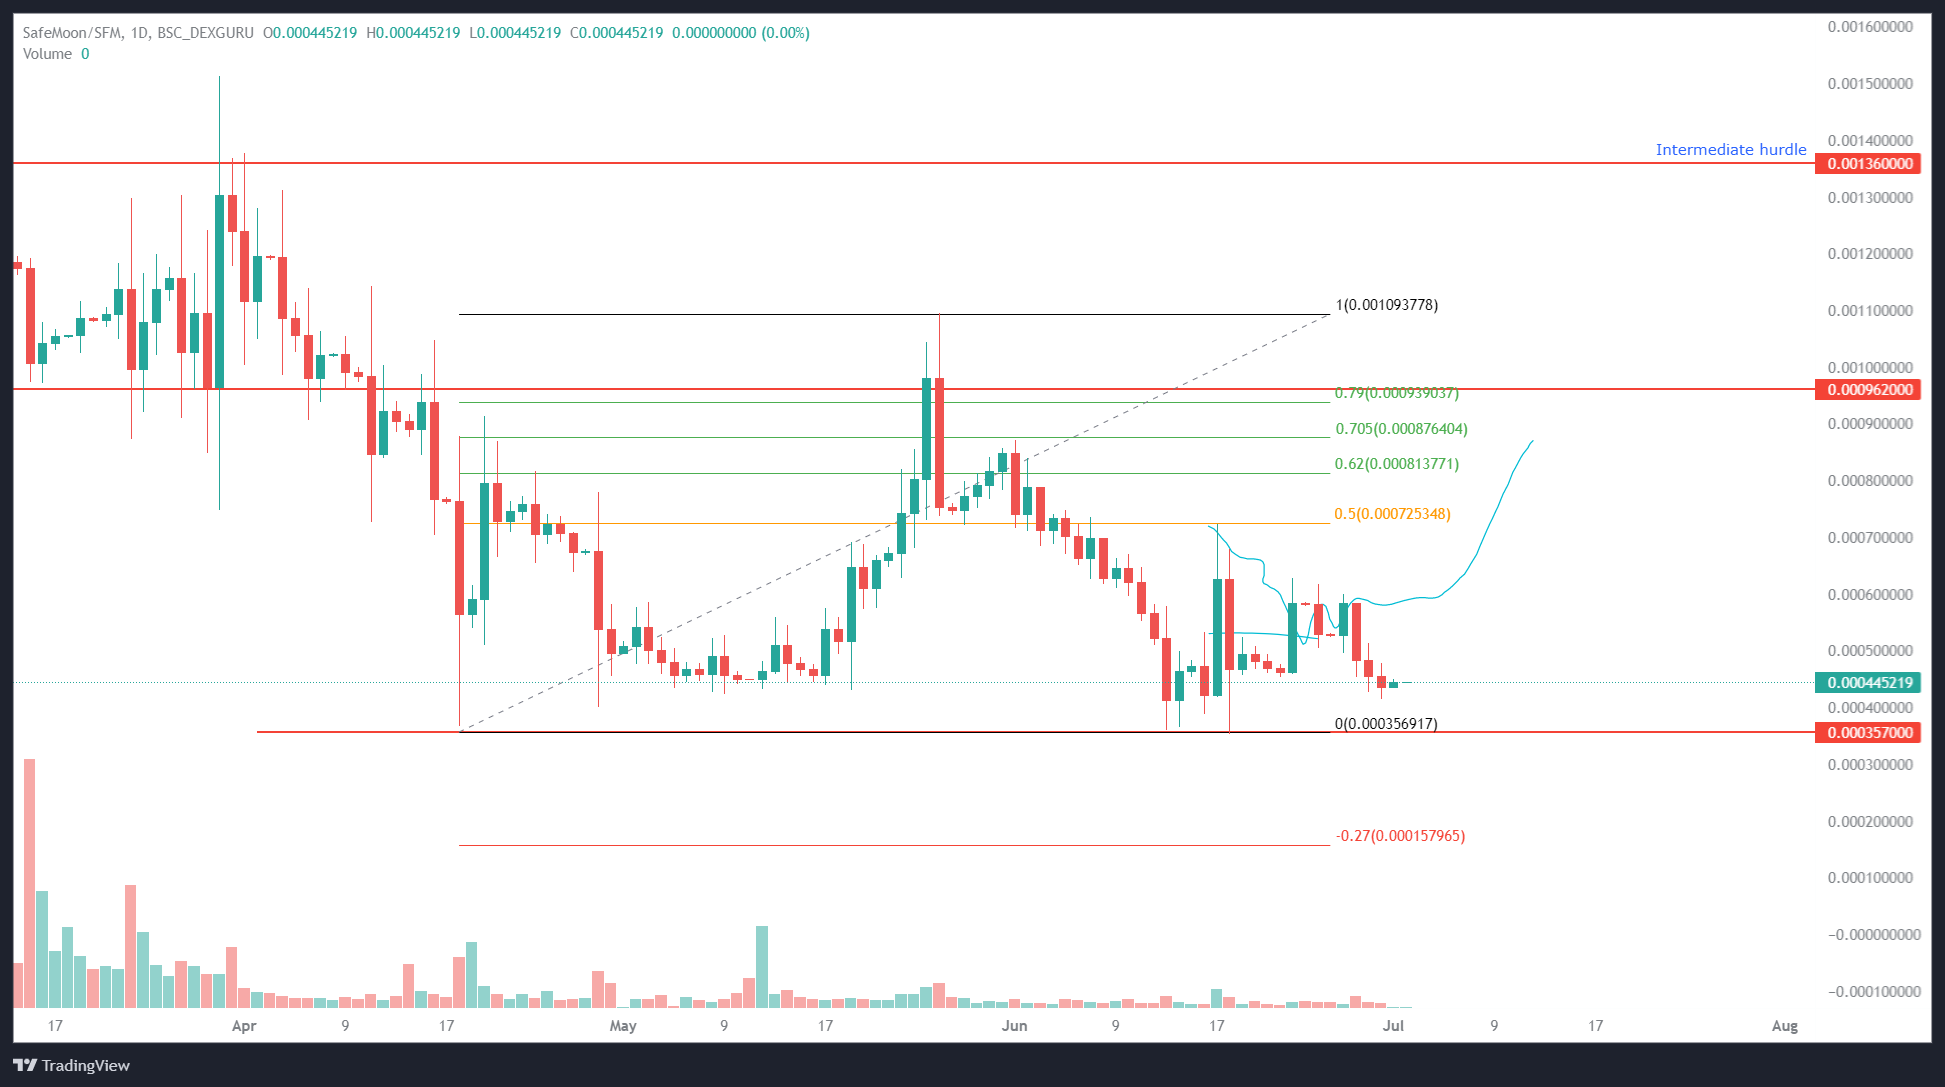
- SafeMoon price shows signs of recovery after consolidating for days between $0.000584 and$0.000414.
- Investors can expect a bounce to result in roughly a 100% upswing to $0.000876.
- A daily candlestick close below the range low at $0.000356 will invalidate the bullish thesis for SAFEMOON.
SafeMoon price shows a bullish outlook that seems too good to be true. Investors that do not practice proper risk management could get caught off guard.
SafeMoon price prepares for a run-up
SafeMoon price consolidated between the $0.000584 and $0.000414 levels since June 19. This coiling up capped the altcoin’s volatility. However, the recent bounce off the lower limit suggests that SAFEMOON is ready for a quick move higher.
Factoring in the state of Bitcoin, which is looking bullish and ready for a bounce, investors need to prepare for a similar outlook for SafeMoon price. The most probable level that the altcoin can retest is the 50% retracement level at $0.000725.
If bullish momentum overcomes this hurdle, market participants can expect SafeMoon price to make a run for the 70.5% retracement level at $0.000876. This run-up would constitute a 100% upswing for SAFEMOON and is likely where the upside is capped.
SAFEMOON/USDT 1-day chart
While things are looking bullish for SafeMoon price after the recent consolidation, investors need to note that the altcoin tagged the range low at $0.000356 multiple times. This development leaves a lot of liquidity below it, making it malleable for market-maker manipulation.
If a sweep of the said level materializes, SafeMoon price could produce a daily candlestick close below the range low to invalidate the bullish thesis.
In such a case, SAFEMOON could crash 56% to the next support level at $0.000157.
Information on these pages contains forward-looking statements that involve risks and uncertainties. Markets and instruments profiled on this page are for informational purposes only and should not in any way come across as a recommendation to buy or sell in these assets. You should do your own thorough research before making any investment decisions. FXStreet does not in any way guarantee that this information is free from mistakes, errors, or material misstatements. It also does not guarantee that this information is of a timely nature. Investing in Open Markets involves a great deal of risk, including the loss of all or a portion of your investment, as well as emotional distress. All risks, losses and costs associated with investing, including total loss of principal, are your responsibility. The views and opinions expressed in this article are those of the authors and do not necessarily reflect the official policy or position of FXStreet nor its advertisers. The author will not be held responsible for information that is found at the end of links posted on this page.
If not otherwise explicitly mentioned in the body of the article, at the time of writing, the author has no position in any stock mentioned in this article and no business relationship with any company mentioned. The author has not received compensation for writing this article, other than from FXStreet.
FXStreet and the author do not provide personalized recommendations. The author makes no representations as to the accuracy, completeness, or suitability of this information. FXStreet and the author will not be liable for any errors, omissions or any losses, injuries or damages arising from this information and its display or use. Errors and omissions excepted.
The author and FXStreet are not registered investment advisors and nothing in this article is intended to be investment advice.
Recommended Content
Editors’ Picks

Top 3 gainers Supra, Cosmos Hub, EOS: Supra leads recovery after Trump’s tariffs announcement
Supra’s 25% surge on Friday calls attention to lesser-known cryptocurrencies as Bitcoin, Ethereum and XRP struggle. Cosmos Hub remains range-bound while bulls focus on a potential inverse head-and-shoulders pattern breakout.

Bitcoin Weekly Forecast: Tariff ‘Liberation Day’ sparks liquidation in crypto market
Bitcoin price remains under selling pressure around $82,000 on Friday after failing to close above key resistance earlier this week. Donald Trump’s tariff announcement on Wednesday swept $200 billion from total crypto market capitalization and triggered a wave of liquidations.

Can Maker break $1,450 hurdle as whales launch buying spree?
Maker is back above $1,300 on Friday after extending its lower leg to $1,231 the previous day. MKR’s rebound has erased the drawdown that followed United States President Donald Trump’s ‘Liberaton Day’ tariffs on Wednesday, which targeted 100 countries.

Gold shines in Q1 while Bitcoin stumbles
Gold gains nearly 20%, reaching a peak of $3,167, while Bitcoin nosedives nearly 12%, reaching a low of $76,606, in Q1 2025. In Q1, the World Gold ETF's net inflows totalled 155 tonnes, while the Bitcoin spot ETF showed a net inflow of near $1 billion.

Bitcoin: BTC remains calm before a storm
Bitcoin's price has been consolidating between $85,000 and $88,000 this week. A K33 report explains how the markets are relatively calm and shaping up for volatility as traders absorb the tariff announcements. PlanB’s S2F model shows that Bitcoin looks extremely undervalued compared to Gold and the housing market.

The Best brokers to trade EUR/USD
SPONSORED Discover the top brokers for trading EUR/USD in 2025. Our list features brokers with competitive spreads, fast execution, and powerful platforms. Whether you're a beginner or an expert, find the right partner to navigate the dynamic Forex market.
