Can MATIC price pull itself from the dumpster and rally 30%
- MATIC price shows promise of a 30% upswing as it produces a bottoming pattern.
- Investors can expect MATIC to tag the $1.63 level and fill the price inefficiency created on April 7.
- A daily candlestick close below $1.15 will invalidate the bullish thesis for Polygon.

MATIC price is in a spot where an upswing possibility makes sense from a technical standpoint. The on-chain metrics also point out that a short-term uptrend seems likely in the coming days for Polygon.
MATIC price needs to pick a side
MATIC price climbed 39% between January 24 and 26 and set a range, extending from $1.31 to $1.82. Since its formation, Polygon has remained obedient to it with a few deviations.
The rangebound movements are simple to trade and spot. Usually, the asset first sweeps a limit, which is a signal that it will move to the other side, and vice versa. If the momentum is right after deviation, there is a high chance the asset continues to head in that direction.
However, as of this writing, the altcoin has swept below the range low at $1.31. A quick recovery of MATIC price above $1.31 support will signal a bullish sign and trigger a move to the immediate hurdle at $1.56 or the range’s midpoint.
In some cases, MATIC price might extend higher to fill the fair value gap aka the price inefficiency by tagging $1.63 resistance. This run-up from the current position at $1.26 will constitute a 30% gain and is likely where the upside is capped.
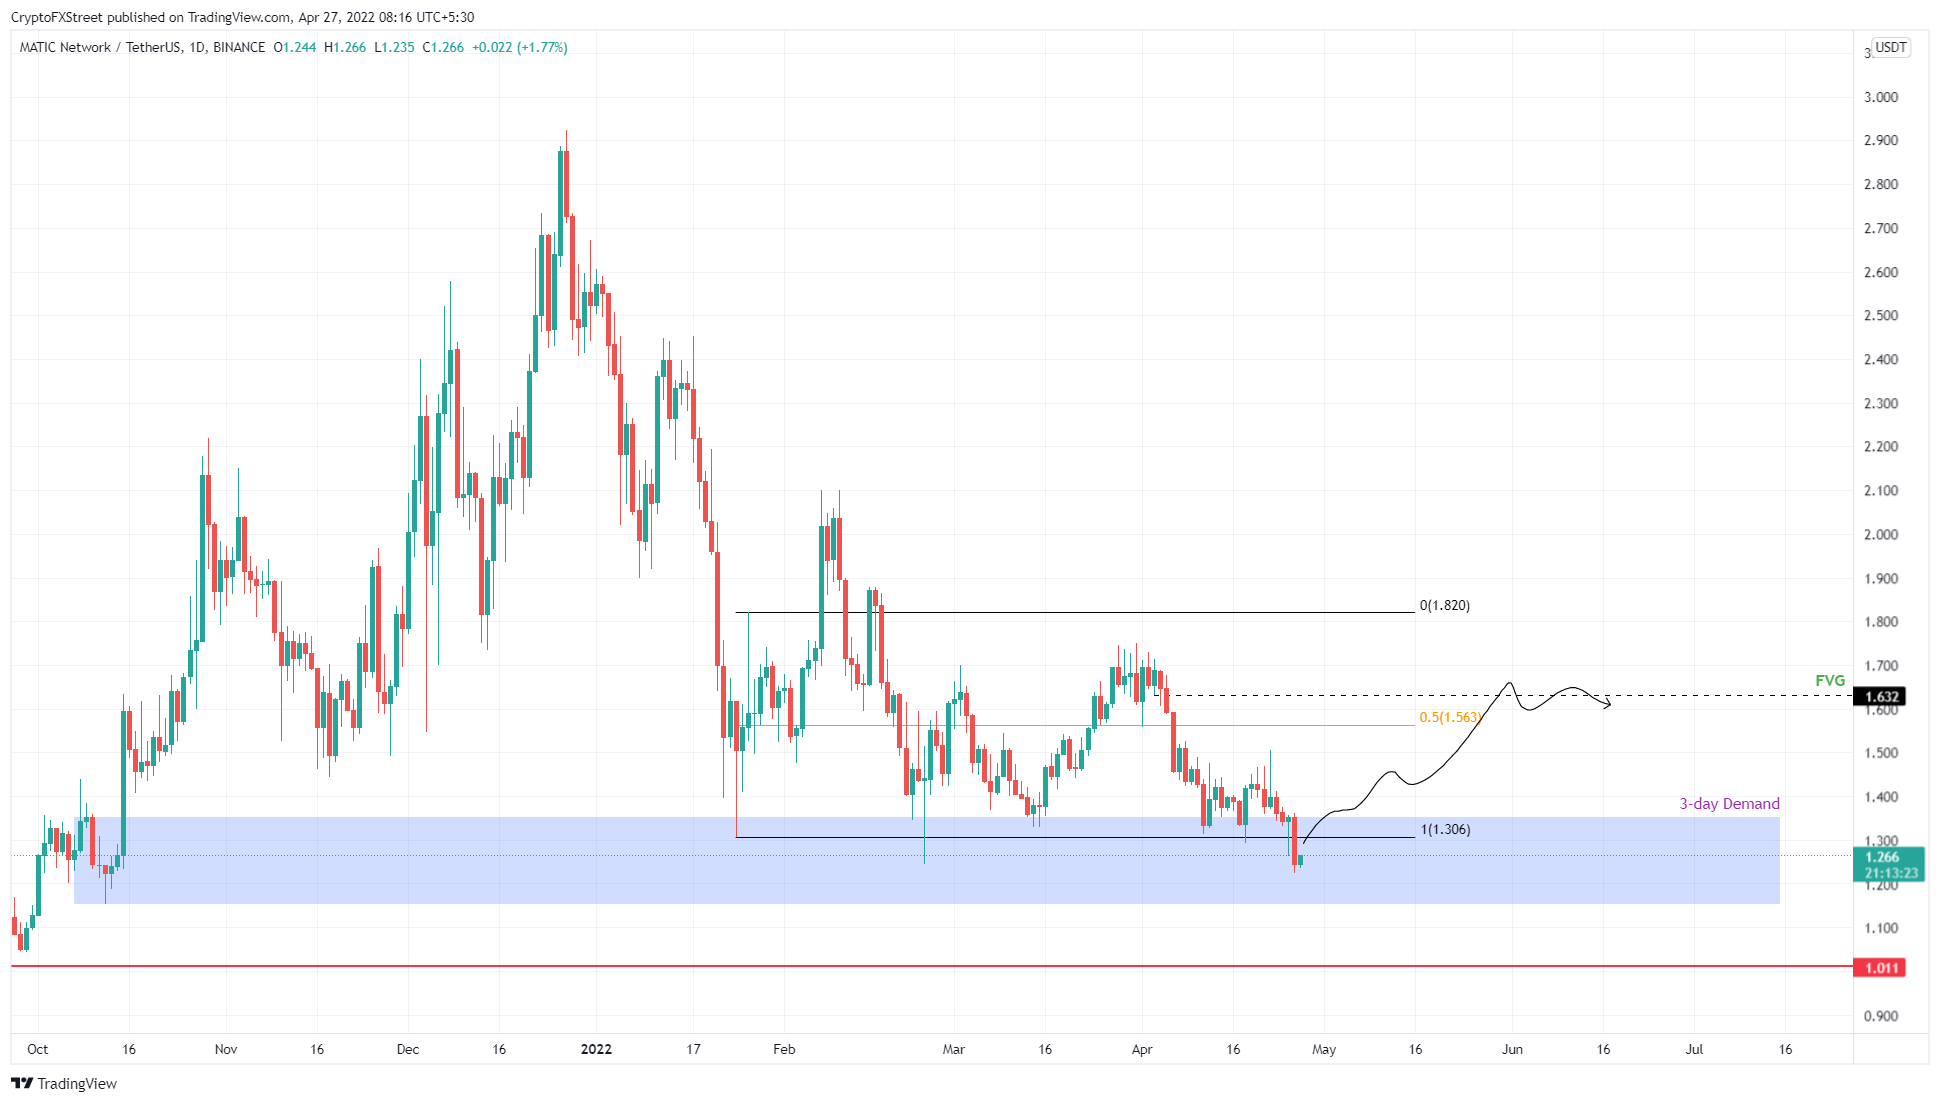
MATIC/USDT 1-day chart
Adding credence to this optimistic outlook for MATIC price is the 30-day Market Value to Realized Value (MVRV) This on-chain metric is used to determine the average profit/loss of investors that purchased MATIC over the past month.
Over the last seven months or so, the local bottoms for Polygon are formed when the 30-day MVRV has hit -15%. The recent downswing has pushed this indicator to the exact value, indicating that the chance of a bottom formation at the current level is high.
Since this level also coincides with the range low at $1.31, the reversal thesis is reaffirmed. .
 [09.09.55, 27 Apr, 2022]-637866307161068592.png)
MATIC 30-day MVRV
Regardless of the bullishness surrounding MATIC price, a rejection at a range low of $1.31 and a daily candlestick close below the three-day demand zone, extending from $1.15 to $1.35 will invalidate the bullish thesis by producing a lower low.
In such a case, Polygon could retrace to the $1.01 support level, where sidelined buyers can accumulate.
Author

Akash Girimath
FXStreet
Akash Girimath is a Mechanical Engineer interested in the chaos of the financial markets. Trying to make sense of this convoluted yet fascinating space, he switched his engineering job to become a crypto reporter and analyst.


