Can institutional inflows postpone Solana price from crashing by 21%?
- Solana noted over $3 million worth of inflows per CoinShare’s weekly flows data, which stands just behind Ethereum.
- Solana price has been stuck in consolidation between $25.6 and $22.9 for nearly three weeks now.
- SOL is still vulnerable to corrections, and a dip below $19 would invalidate the bullish thesis of recovery to $30.

Solana price has stuck to sideways momentum over the last few days as the broader crypto market noted mixed sentiments. However, movement is expected out of the altcoin now that interest from big wallet holders in the asset has risen.
According to CoinShare’s weekly net flows data Solana managed to attract $0.5 million worth of inflows for the week ending February 3. The inflows were the second highest, led by Ethereum, which brought in $0.7 million.
This performance has been consistent since the beginning of the year as the year-to-date inflows for Ethereum clocked in at $10 million, followed by Solana with $3 million worth of inflows. This institutional interest is expected to keep Solana price away from the bears' control.
Solana price is struggling to remain afloat
Solana price has been consolidated between $25.6 and $22.9 for almost three weeks as the altcoin failed to maintain the early January bullishness. Trading at $23.22, the altcoin is treading right at the immediate support level of $22.77.
If the institutions' interest rejuvenates the bulls and Solana price pulls through, a recovery toward $25.65 can be expected. The level coincides with the 50% Fibonacci retracement from $37.25 to $14.05. Reclaiming it would enable SOL to rise and tag the critical resistance at $28.29, and flipping it into a support floor would also provide the altcoin with the support of the 61.8 Fib level.
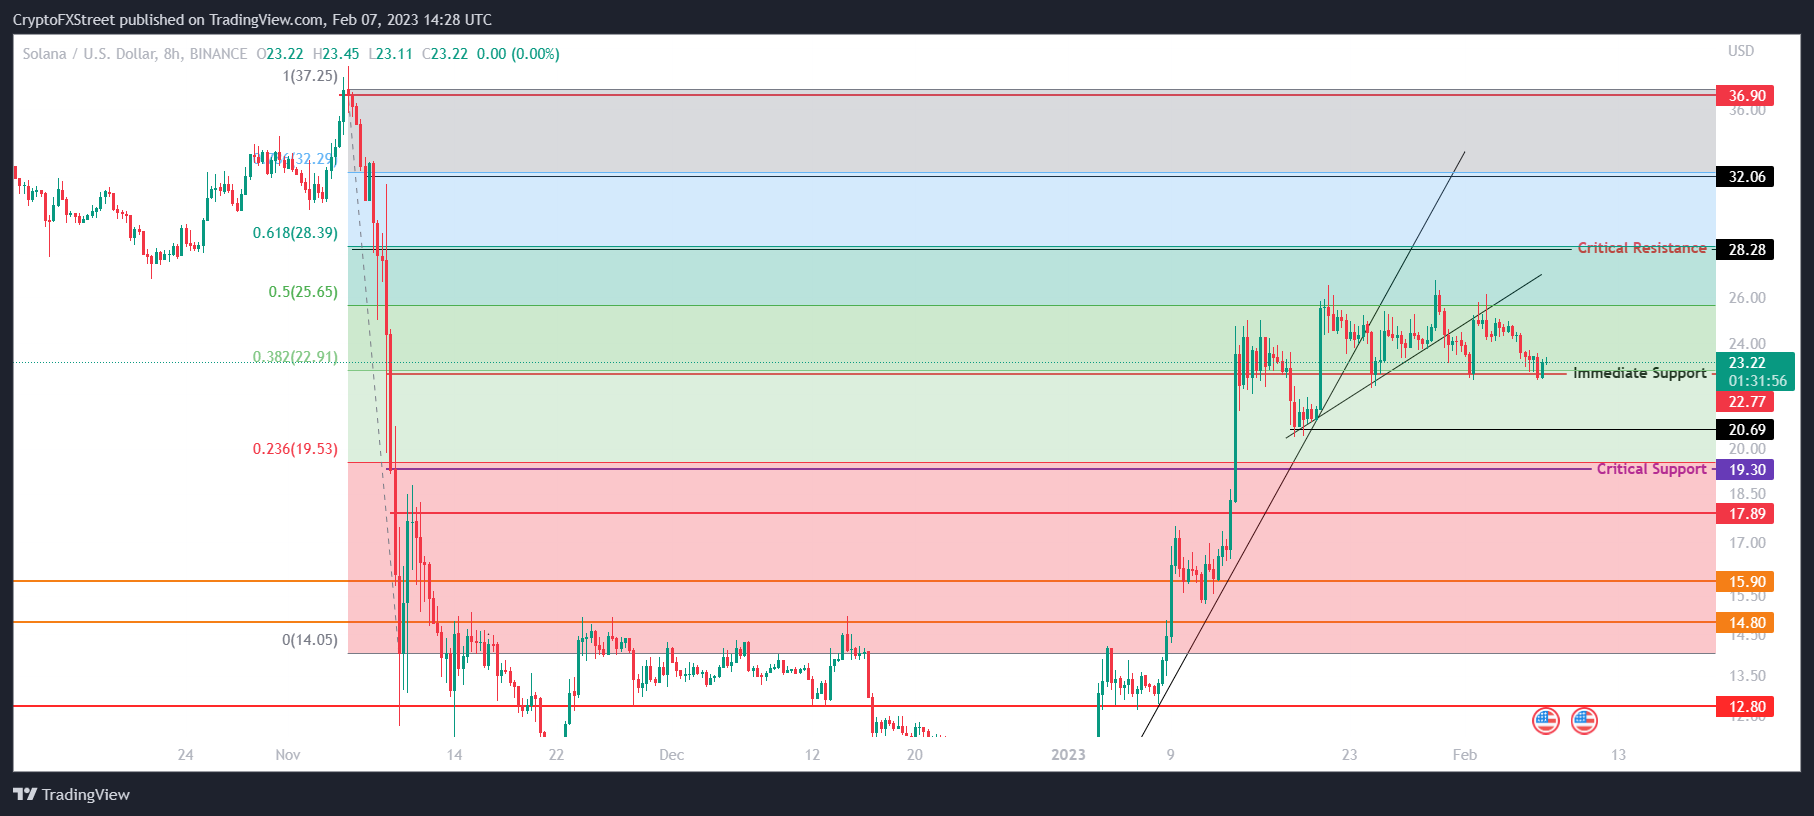
SOL/USD 8-hour chart
Nevertheless, the bears also seem to be reigning in the price movement, and if the immediate support level is lost, Solana price will slip to $20.69. Losing this would push the cryptocurrency to tag the critical support level at $19.3, which coincides with the 23.6% Fibonacci line. A daily candlestick close below this level would invalidate the bullish thesis, bringing SOL to $17.89, marking a 21% dip.
Author

Aaryamann Shrivastava
FXStreet
Aaryamann Shrivastava is a Cryptocurrency journalist and market analyst with over 1,000 articles under his name. Graduated with an Honours in Journalism, he has been part of the crypto industry for more than a year now.


