- Crypto.com price bounced off the triple bottom pattern on February 24 and attempted to retest $0.51.
- After a failed attempt and retracement to $0.437, CRO is giving this rally another go.
- A daily candlestick close below $0.437 will invalidate the bullish thesis.
Crypto.com price is at an interesting point after the recent drawdown. Interested investors can view the pullback as an opportunity to accumulate CRO at a discount. A bounce off the immediate support level is likely to trigger another run-up that would attempt to retest failed resistance barrier.
Crypto.com price to pull a reversal
Crypto.com price set up a triple bottom by bouncing off the $0.355 support level thrice. The last tag of this barrier was followed by a 45% upswing to $0.502. However, the uptrend plateaued around $0.484, leading to a steep correction that was due to the recent flash crash in Bitcoin price.
After dropping nearly 10%, Crypto.com price is retesting the $0.437 support level. A consolidation or a quick bounce could trigger an upswing for CRO. This emerging rally is likely to make a run for the $0.512 resistance barrier after failing to do so on the first try.
Hence, investors can expect a quick 16% ascent in the coming days for Crypto.com price.
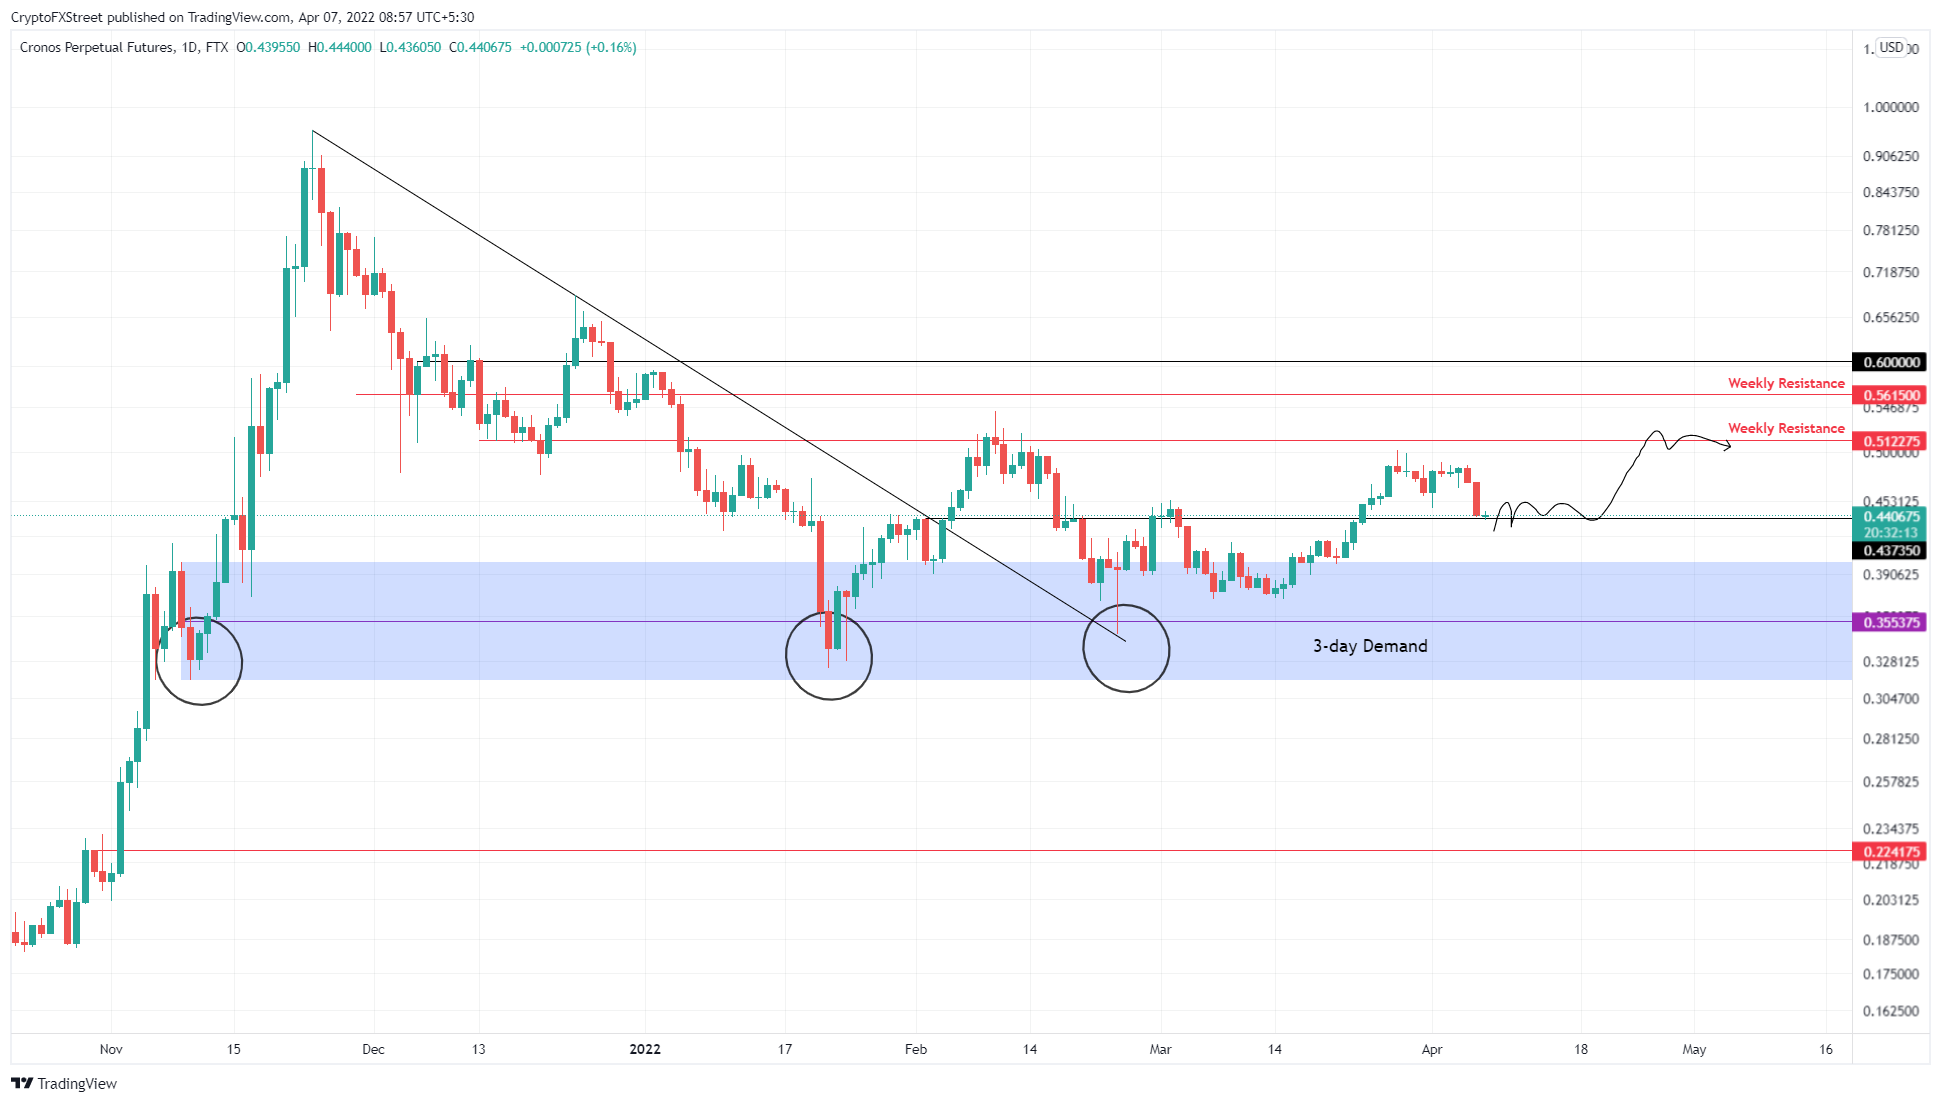
CRO/USDT 1-day chart
Supporting this move higher for Crypto.com price is IntoTheBlock’s Global In/Out of the Money (GIOM) model. This index shows a massive cluster of investors ranging from $0.40 to $0.20 serving as a support floor.
These 29,000 holders purchased roughly 80 billion CRO tokens at an average price of $0.315 and are likely to accumulate more if the price dips into their area. Hence, an uptrend seems likely. Further adding credence to an upswing is the lack of resistance barriers for CRO.
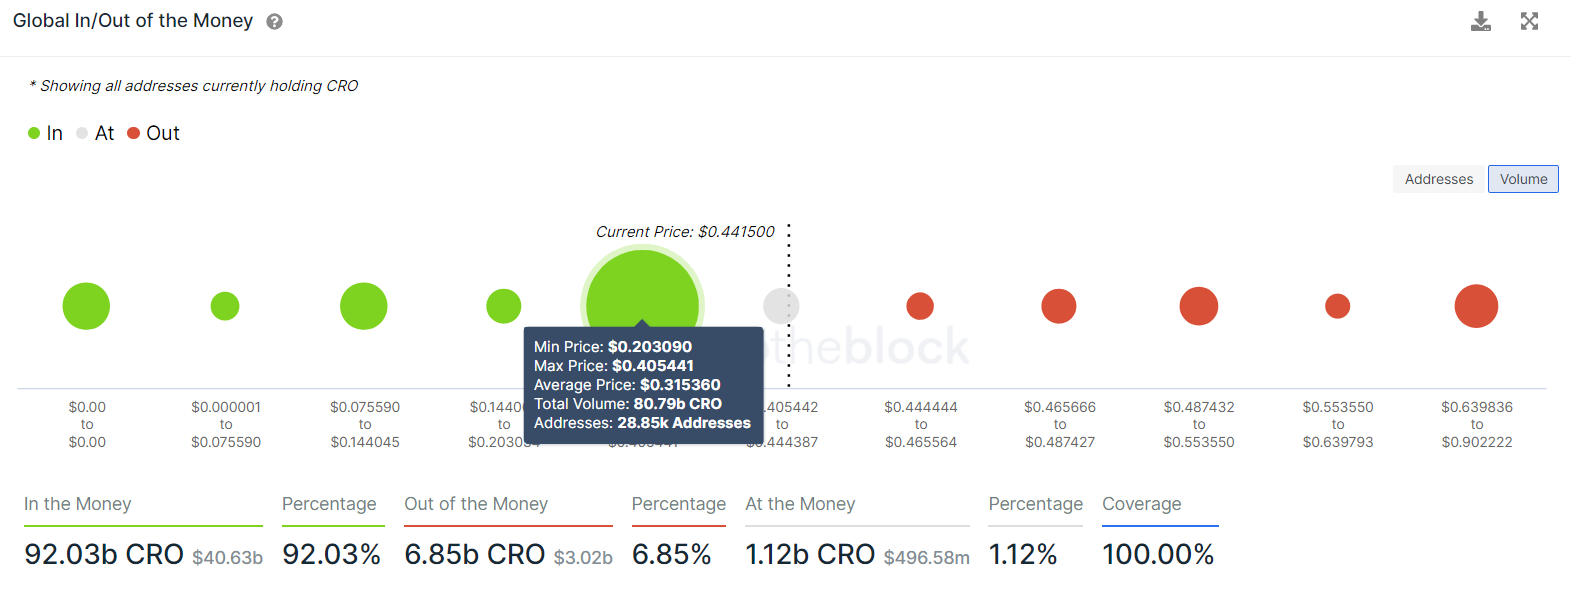
CRO GIOM
A daily candlestick close below $0.437 will flip the support into a resistance barrier, invalidating the bullish thesis for Crypto.com price. Such a development will open the path for CRO to crash by 8% and retest the three-day demand zone, extending from $0.316 to $0.399.
Information on these pages contains forward-looking statements that involve risks and uncertainties. Markets and instruments profiled on this page are for informational purposes only and should not in any way come across as a recommendation to buy or sell in these assets. You should do your own thorough research before making any investment decisions. FXStreet does not in any way guarantee that this information is free from mistakes, errors, or material misstatements. It also does not guarantee that this information is of a timely nature. Investing in Open Markets involves a great deal of risk, including the loss of all or a portion of your investment, as well as emotional distress. All risks, losses and costs associated with investing, including total loss of principal, are your responsibility. The views and opinions expressed in this article are those of the authors and do not necessarily reflect the official policy or position of FXStreet nor its advertisers. The author will not be held responsible for information that is found at the end of links posted on this page.
If not otherwise explicitly mentioned in the body of the article, at the time of writing, the author has no position in any stock mentioned in this article and no business relationship with any company mentioned. The author has not received compensation for writing this article, other than from FXStreet.
FXStreet and the author do not provide personalized recommendations. The author makes no representations as to the accuracy, completeness, or suitability of this information. FXStreet and the author will not be liable for any errors, omissions or any losses, injuries or damages arising from this information and its display or use. Errors and omissions excepted.
The author and FXStreet are not registered investment advisors and nothing in this article is intended to be investment advice.
Recommended Content
Editors’ Picks
Ripple update: XRP shows resilience in recent crypto market sell-off
Ripple's XRP is up 6% on Tuesday following a series of on-chain metrics, which reveals investors in the remittance-based token held onto their assets despite the wider crypto market sell-off last week.
Floki DAO floats liquidity provisioning for a Floki ETP in Europe
Floki DAO — the organization that manages the memecoin Floki — has proposed allocating a portion of its treasury to an asset manager in a bid to launch an exchange-traded product (ETP) in Europe, allowing institutional investors to gain exposure to the memecoin.

Six Bitcoin mutual funds to debut in Israel next week: Report
Six mutual funds tracking the price of bitcoin (BTC) will debut in Israel next week after the Israel Securities Authority (ISA) granted permission for the products, Calcalist reported on Wednesday.

Crypto Today: BTC hits new Trump-era low as Chainlink, HBAR and AAVE lead market recovery
The global cryptocurrency market cap shrank by $500 billion after the Federal Reserve's hawkish statements on December 17. Amid the market crash, Bitcoin price declined 7.2% last week, recording its first weekly timeframe loss since Donald Trump’s re-election.

Bitcoin: 2025 outlook brightens on expectations of US pro-crypto policy
Bitcoin price has surged more than 140% in 2024, reaching the $100K milestone in early December. The rally was driven by the launch of Bitcoin Spot ETFs in January and the reduced supply following the fourth halving event in April.

Best Forex Brokers with Low Spreads
VERIFIED Low spreads are crucial for reducing trading costs. Explore top Forex brokers offering competitive spreads and high leverage. Compare options for EUR/USD, GBP/USD, USD/JPY, and Gold.