- MATIC price has rallied 10% to start the month of October.
- The Relative Strength Index shows an influx of momentum, supporting an uptrend bias.
- Invalidation of the bullish thesis is a breach at $0.75.
MATIC price sports a strong countertrend rally. Higher targets can certainly be tagged if market conditions persist.
MATIC price rallies higher
Polygon's MATIC price is up 10% on the month as the bulls have stepped into the market with applaudable vigor. Since choppy congestion and suppression of key moving averages near the $0.75 barrier, the Polygon Network token put a decisive end to the madness propelling through multiple barriers. As the price ascends, bulls in the market will be forced to decide if and when an appropriate time will be to book profits.
MATIC price currently auctions at $0.83. During the initial pump, the bulls breached through the 8-day exponential (EMA) and 21-day simple moving averages (SMA). A Fibonacci retracement tool surrounding previous swing-high and swing-low points in the summer shows the bulls are just above the $23.6% retracement level. This is not a strong level for sidelined bears to flex their guns.
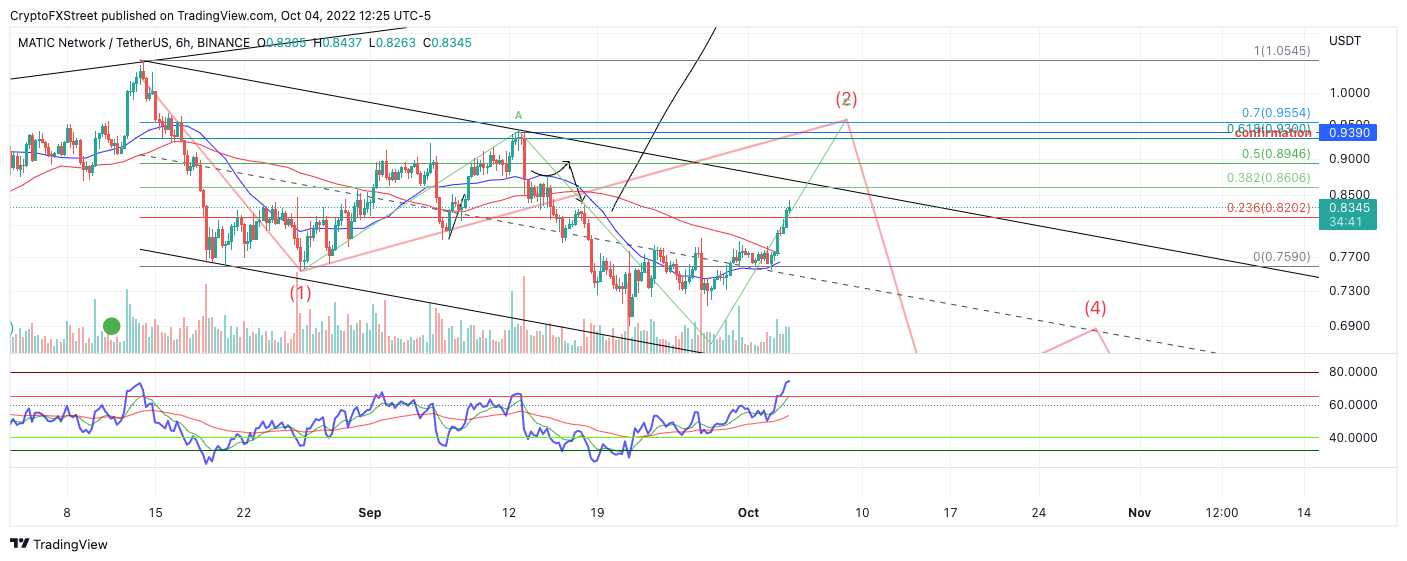
MATIC USDT 6-Hour Chart
Based on the newfound surge, more uptrend should be expected for the self-proclaimed Ethereum Killer token. Traders looking to enter the market should aim for the September high at $0.95. Invalidation of the bullish countertrend play is a breach below the 8-day EMA at $0.75. The uptrend move is likely a suckers' rally if this level is broken. The bears could then flex short, targeting the $0.60 liquidity zone. Such a move would result in a 25% decrease from the current MATIC price.
In the following video, FXStreet analysts deep dive into the technicals and fundamentals of MATIC, analyzing key levels in the market
Information on these pages contains forward-looking statements that involve risks and uncertainties. Markets and instruments profiled on this page are for informational purposes only and should not in any way come across as a recommendation to buy or sell in these assets. You should do your own thorough research before making any investment decisions. FXStreet does not in any way guarantee that this information is free from mistakes, errors, or material misstatements. It also does not guarantee that this information is of a timely nature. Investing in Open Markets involves a great deal of risk, including the loss of all or a portion of your investment, as well as emotional distress. All risks, losses and costs associated with investing, including total loss of principal, are your responsibility. The views and opinions expressed in this article are those of the authors and do not necessarily reflect the official policy or position of FXStreet nor its advertisers. The author will not be held responsible for information that is found at the end of links posted on this page.
If not otherwise explicitly mentioned in the body of the article, at the time of writing, the author has no position in any stock mentioned in this article and no business relationship with any company mentioned. The author has not received compensation for writing this article, other than from FXStreet.
FXStreet and the author do not provide personalized recommendations. The author makes no representations as to the accuracy, completeness, or suitability of this information. FXStreet and the author will not be liable for any errors, omissions or any losses, injuries or damages arising from this information and its display or use. Errors and omissions excepted.
The author and FXStreet are not registered investment advisors and nothing in this article is intended to be investment advice.
Recommended Content
Editors’ Picks

Litecoin Price Prediction: LTC tries to retake $100 resistance as miners halt sell-off
Litecoin price grazed 105 mark on Monday, rebounding 22% from the one-month low of $87 recorded during last week’s market crash. On-chain data shows sell pressure among LTC miners has subsided. Is the bottom in?

Bitcoin fails to recover as Metaplanet buys the dip
Bitcoin price struggles around $95,000 after erasing gains from Friday’s relief rally over the weekend. Bitcoin’s weekly price chart posts the first major decline since President-elect Donald Trump’s win in November.

SEC Commissioner Hester Pierce sheds light on Ethereum ETF staking under new administration
In a Friday interview with Coinage, SEC Commissioner Hester Peirce discussed her optimism about upcoming regulatory changes as the agency transitions to new leadership under President Trump’s pick for new Chair, Paul Atkins.

Bitcoin dives 3% from its recent all-time high, is this the cycle top?
Bitcoin investors panicked after the Fed's hawkish rate cut decision, hitting the market with high selling pressure. Bitcoin's four-year market cycle pattern indicates that the recent correction could be temporary.
Bitcoin: 2025 outlook brightens on expectations of US pro-crypto policy
Bitcoin price has surged more than 140% in 2024, reaching the $100K milestone in early December. The rally was driven by the launch of Bitcoin Spot ETFs in January and the reduced supply following the fourth halving event in April.

Best Forex Brokers with Low Spreads
VERIFIED Low spreads are crucial for reducing trading costs. Explore top Forex brokers offering competitive spreads and high leverage. Compare options for EUR/USD, GBP/USD, USD/JPY, and Gold.