BTC/USD Elliott Wave Technical Analysis

Summary: At this stage, Bitcoin may either bounce up to about 5,827 or move sideways. The bounce or consolidation may last about two to three months.
It would be safest to assume that the bear market will continue while Bitcoin remains below 7,234.83. The target is about 1,924, but it may be much lower than this; it is possible this bear market may see the end of Bitcoin.
MAIN ELLIOTT WAVE COUNT
MONTHLY
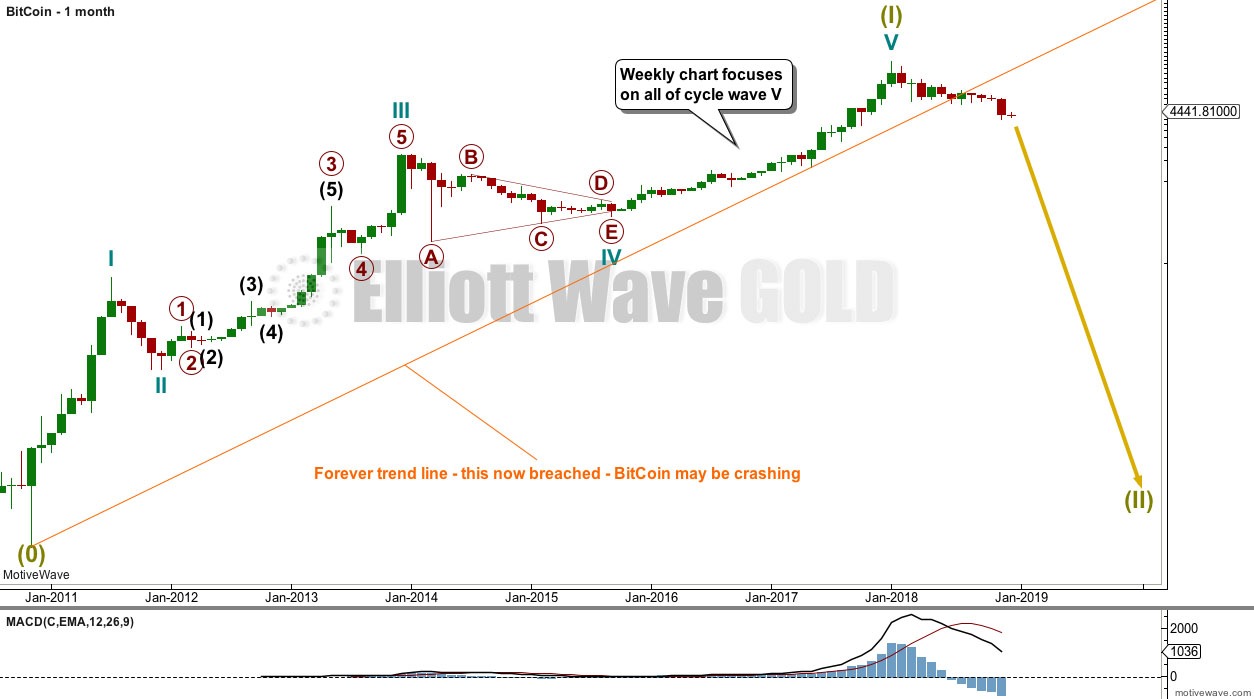
It is possible to see a completed five wave impulse upwards for Bitcoin.
I am unable to find reasonable Fibonacci ratios within this wave count. It appears that Bitcoin may not exhibit Fibonacci ratios very often between its waves, so this makes target calculation impossible. Classic technical analysis was used to identify a high in place on the 23rd of December, 2017.
What is very clear from this chart is that Bitcoin is a classic bubble. This looks like an even larger bubble than the Tulip Mania. The only thing about which I am certain is that this bubble will pop and Bitcoin will collapse.
Confidence that Bitcoin was most likely crashing started since the Forever trend line was breached in June.
WEEKLY
Bitcoin tends to behave like an extreme commodity: price moves upwards for about 2 – 4 weeks in a near vertical movement at the end of its rises. Following this vertical movement the resulting downwards movement is very deep (in percentage terms) and often very quick.
The next rise begins slowly with basing action over weeks or months, and then as the rise nears its end another vertical movement completes it. Also, there are volume spikes just before or at the end, which is another feature typical of commodity like behaviour.
This has happened now several times. The most notable instances are the rise up to the week ending 24th November, 2013, and the week ending 5th June, 2011. The following sharp drops were 94% and 93% respectively.
If this current drop continues like the last two examples, then a reasonable target may be about $1,390.94 or below.
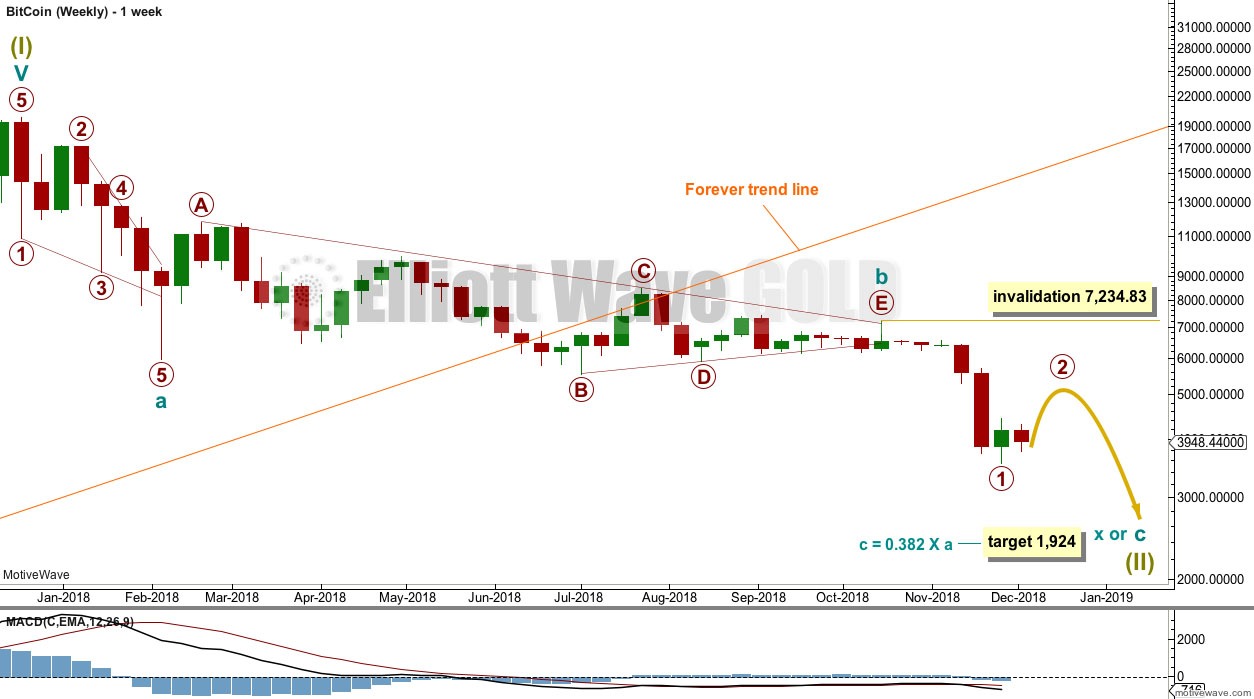
Super Cycle wave (II) would most likely be a zigzag, but it may also be a flat, combination or triangle; a zigzag would subdivide 5-3-5.
It is possible that cycle waves a and b may be complete within the expected zigzag of Super Cycle wave (II). Cycle wave a will fit as a leading contracting diagonal, and cycle wave b fits well as a running contracting triangle.
The target calculated expects cycle wave c to exhibit a Fibonacci ratio to cycle wave a. Bitcoin rarely exhibits Fibonacci ratios, so this target does not have a good probability. 2 of 5 7/12/18, 2:21 PM
DAILY
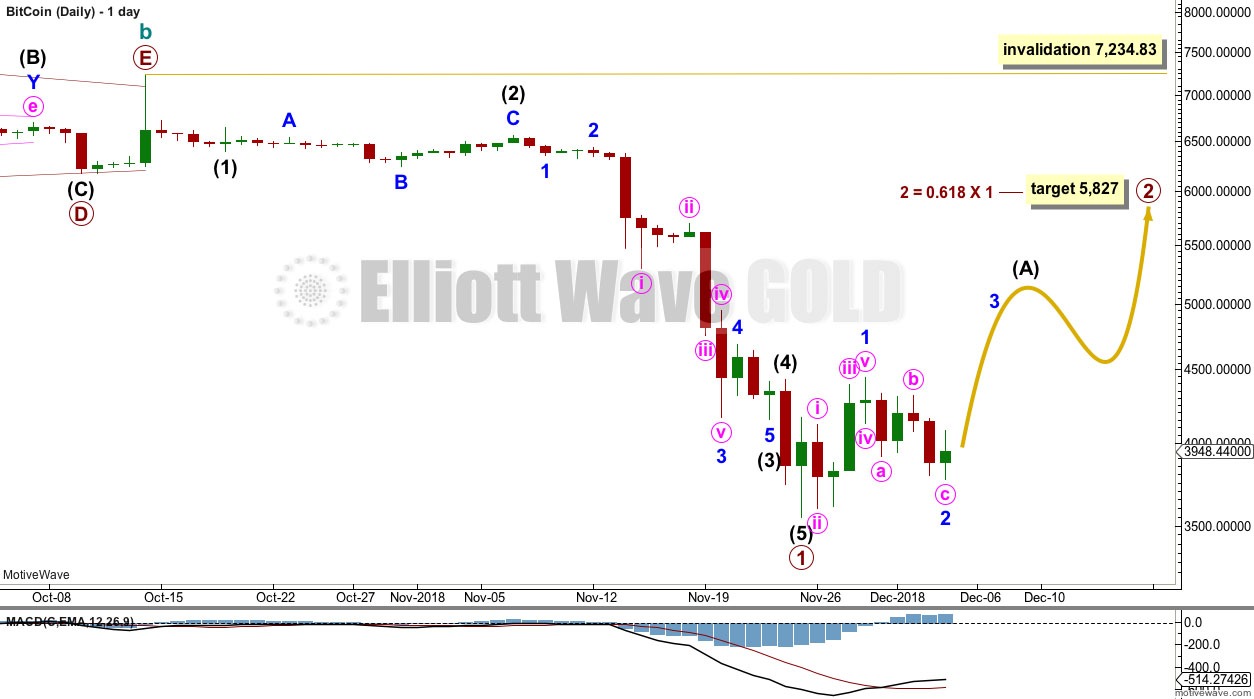
Within cycle wave c, primary wave 1 may be complete.
Primary wave 2 would most likely subdivide as a zigzag and may end about the 0.618 Fibonacci ratio of primary wave 1.
Primary wave 1 lasted 41 sessions. Primary wave 2 may last about two to three months to have reasonable proportion to primary wave 1.
Primary wave 2 may not move beyond the start of primary wave 1 above 7,234.83.
ALTERNATE ELLIOTT WAVE COUNT
DAILY
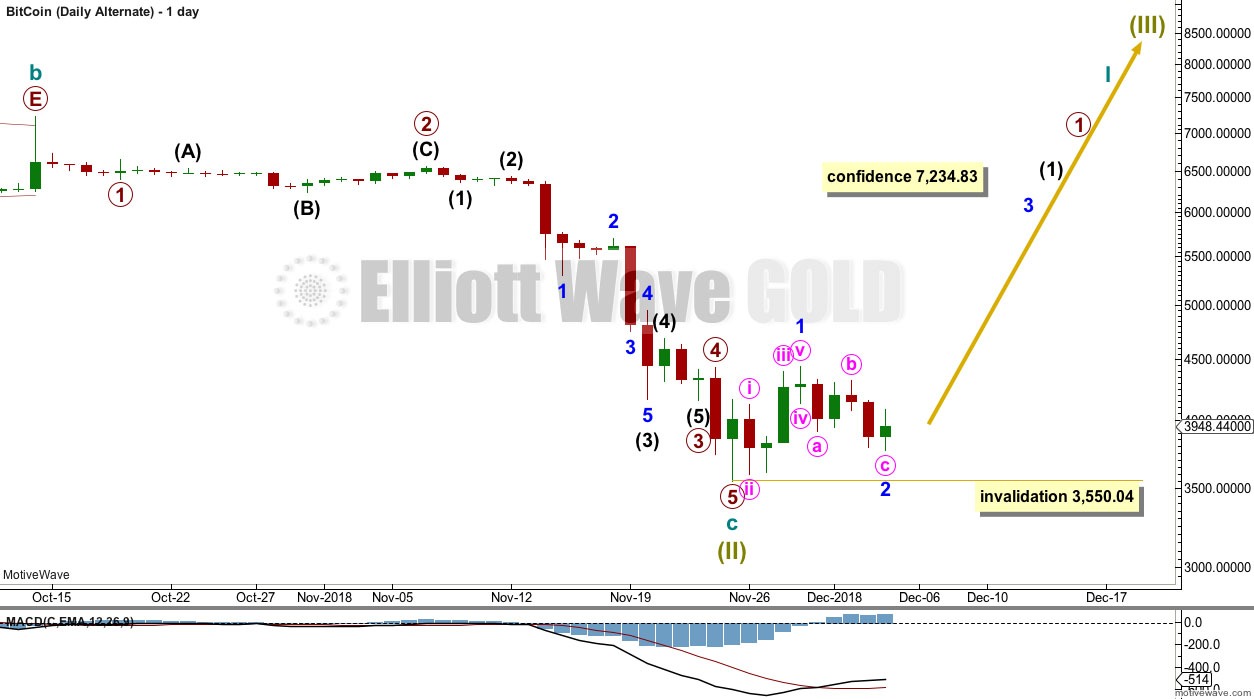
By moving the degree of labelling within cycle wave c up one degree, it is possible that the crash for Bitcoin could be over.
This wave count has a very low probability. It does not follow normal behaviour for Bitcoin.
Normal behaviour for an early second wave correction is for Bitcoin to retrace deeper than 90% of the first wave. This wave count expects that Super Cycle wave (II) was only 82%. While this is very deep, it is not as deep as is normal for Bitcoin.
A candlestick reversal pattern at the low of Super Cycle wave (II) would be fairly likely at the weekly chart level and not only the daily chart, which is not the case at this time.
TECHNICAL ANALYSIS
The following can be noted when looking back at Bitcoin's behaviour during its previous strong falls in price:
The 94% fall in price from June to November 2011 was characterised by:
– Three clearly separate instances of RSI reaching oversold on the daily chart, separated by bounces.
– ADX did not remain very extreme for very long at all on the daily chart.
– On Balance Volume exhibited weak single bullish divergence at the low.
The 93% fall in price from November 2013 to February 2014 was characterised by:
– RSI reached oversold and remained deeply oversold for three weeks; at the low there was only single weak bullish divergence with price.
– ADX remained very extreme for the last seven sessions to the low.
– At the low, On Balance Volume did not exhibit bullish divergence with price; it remained bearish and then exhibited further bearishness after the low as it continued to decline as price began to rise.
For the current fall in price, the current Elliott wave count expects the fall to be larger in terms of duration 4 of 5 7/12/18, 2:21 PM than the previous two noted here, and at least equivalent in terms of price movement in that a fall of over 90% is expected now.
So far at the lowest low from the all time high Bitcoin has only retraced 0.82. While this is deep, its corrections are usually deeper than this.
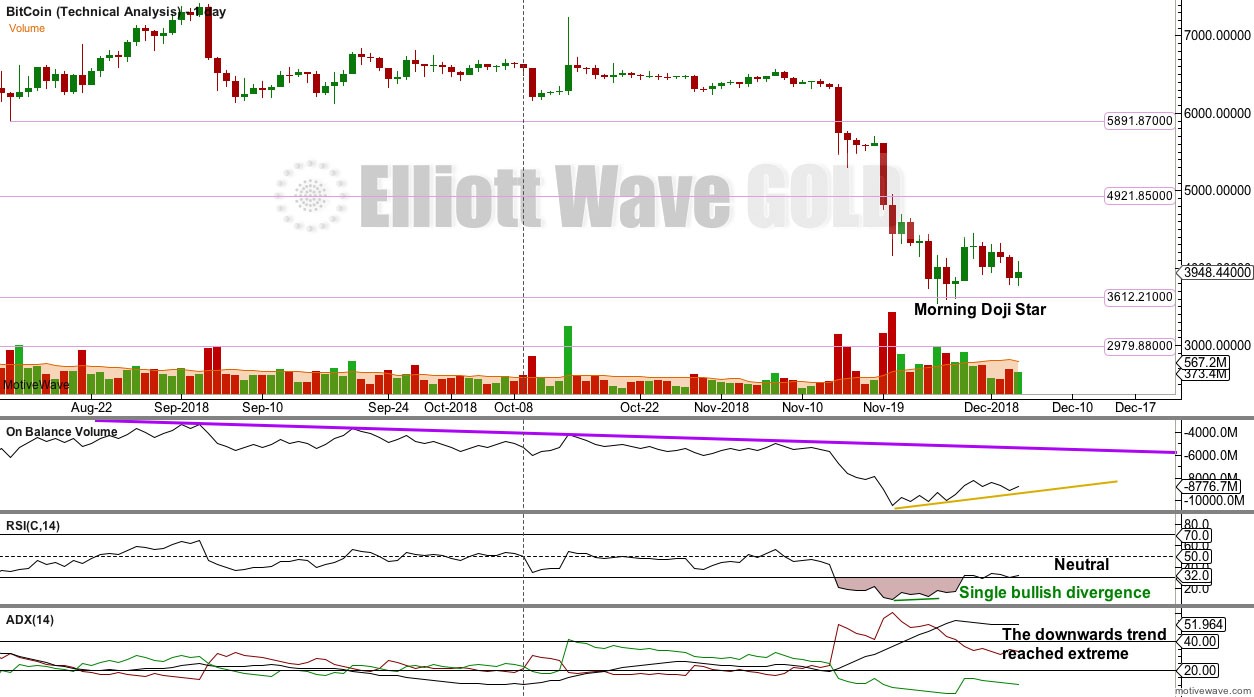
A bounce or consolidation may unfold for the short to mid term. This view is supported by:
1. On the 26th, 27th and 28th of November a Morning Doji Star unfolded.
2. RSI reached deeply oversold and there exhibited bullish divergence with price.
3. The short-term volume profile is bullish.
4. ADX reached very extreme and is now declining.
Support is identified on the chart.
Author

Lara Iriarte, CMT
Elliott Wave Gold
Lara Iriarte is a Chartered Market Technician and a Registered Financial Advisor in New Zealand.


