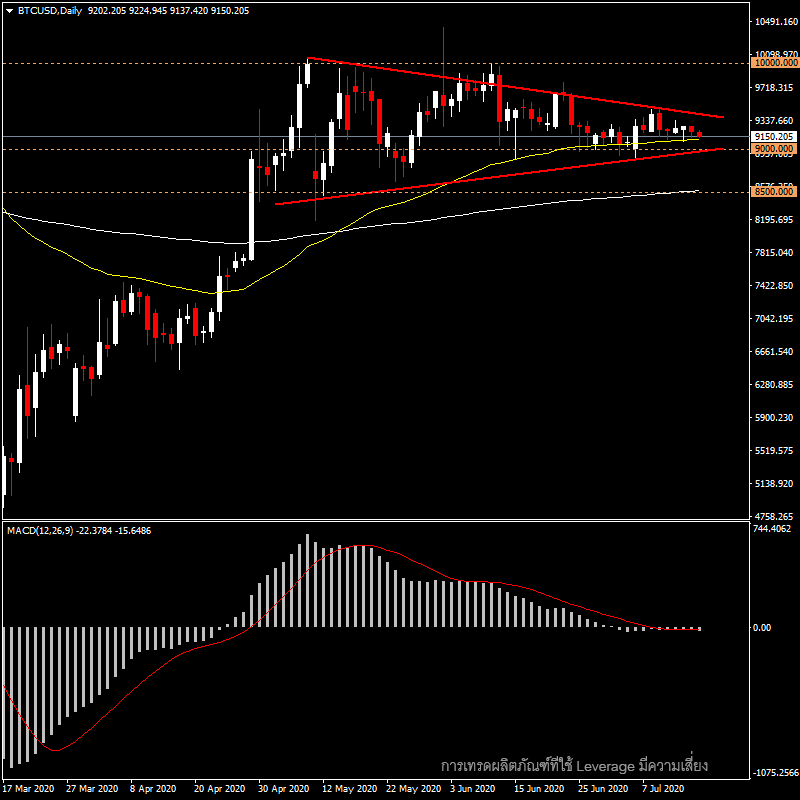
BTC/USD – Nearing a triangle pattern?

BTCUSD – After the easing of lockdown measures in May, Bitcoin prices continued to narrow in the 9,000 – 10,000 range. Since May though we have spotted a triangle formation that looks like a bullish pennant pattern that may see a bid if it confirms a break to the upside. The asset is supported by 50-day EMA and 200-day EMA 200. The asset has remained in a positive medium term outlook as it is sustaining the year’s highs. If the price breaks through the lower border first, however, it may retest the 8,500 level. Meanwhile, MACD indicator shows that momentum is currently declining in the negative territory.
As Bitcoin continues to circulate, the Chinese central bank’s Digital Yuan is about to launch a trial on the platform of China’s food delivery service provider Didi, backed by Tencent, which has more users. At the same time, the Japanese government is preparing to consider issuing a Central Bank Digital Currency (CBDC), which will be included in this year’s policy framework and may be done in cooperation with the United States and Europe.