BTC price hits ‘Uptober’ up 5% – Five things to know in Bitcoin this week

Bitcoin (BTC $28,341) starts a new week, a new month and a new quarter with a firm bullish move past $28,000.
The largest cryptocurrency greets “Uptober” in style with its best weekly close since mid-August — what lies in store next?
After mixed BTC price action in September, market participants were prepared for a potentially volatile monthly close, but in the end, this ended up in the bulls’ favor.
With October frequently the sight of tangible BTC price gains, excitement is brewing over what might happen in the coming weeks.
Macro triggers may not hold the answer immediately, as October begins with a quiet phase for United States macro data and the government averting a shutdown at the last minute.
Bitcoin fundamentals are not yet echoing the spike in spot price, with mining difficulty due to decrease at its next automated readjustment on Oct. 2.
Cointelegraph looks at these topics and more in the weekly digest of BTC price catalysts lying in wait.
Bitcoin bulls acknowledge BTC price reversal risk
In the run-up to the Oct. 1 weekly close, Bitcoin had already cleared the end of the September monthly candle with little overall volatility.
That all changed as the week ended, with a sudden growth spurt taking BTC price action to just shy of $28,000. In the hours that followed, new local highs of $28,451 appeared on Bitstamp.
Since the start of Oct. 1, the largest cryptocurrency is up over 5%, data from Cointelegraph Markets Pro and TradingView confirms.
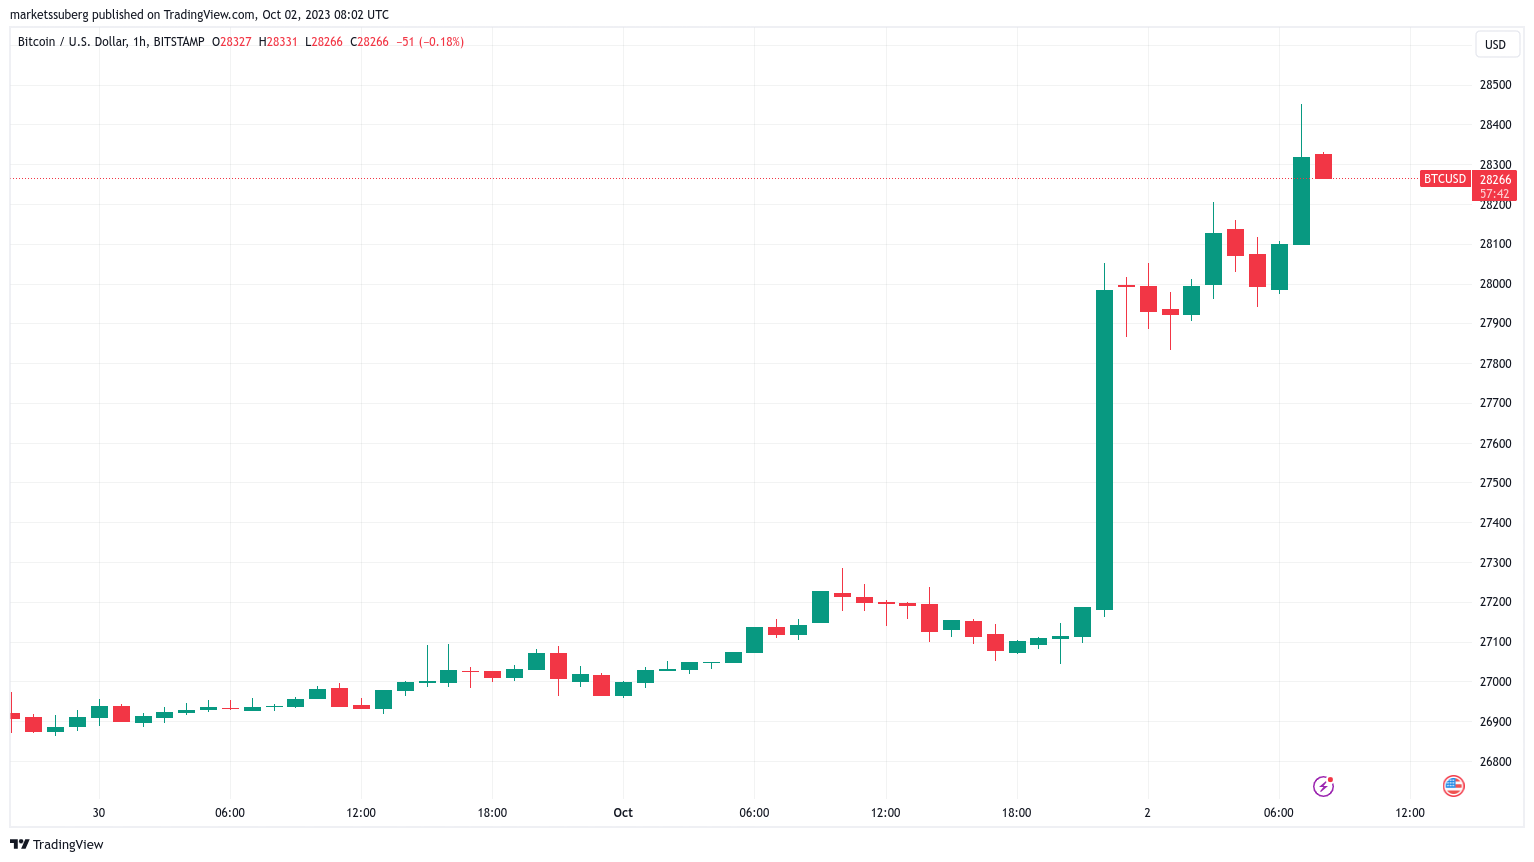
BTC/USD 1-hour chart. Source: TradingView
The move provided Bitcoin’s highest weekly close since mid-August, canceling out the weaker performance seen since.
“Bitcoin back up to $28,000,” Michaël van de Poppe, CEO and founder at MNTrading, told X (formerly Twitter) subscribers on the day.
Might fully retrace, but the trend is clearly upwards. Every consolidation of Bitcoin will be a period where altcoins are starting to follow the path of Bitcoin. This quarter will be fun!
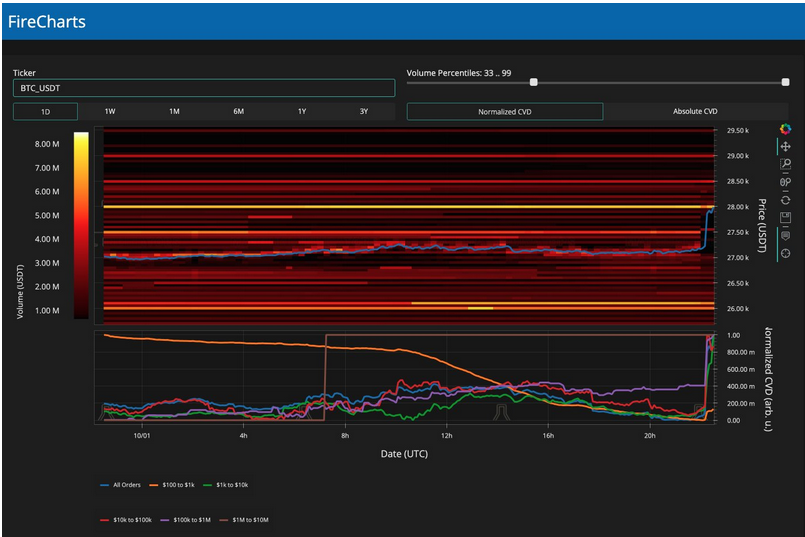
Popular trader Skew likewise flagged the potential for a comedown, using exchange order book trends as proof.
“Pretty wide orderbook here in terms of available / resting liquidity,” he explained on the day.
Bigger price reaction comes out of this imo Increasing ask liquidity on spot orderbooks; implies greater volume needed by spot takers to clear $28K - $29K (Market structure shift).
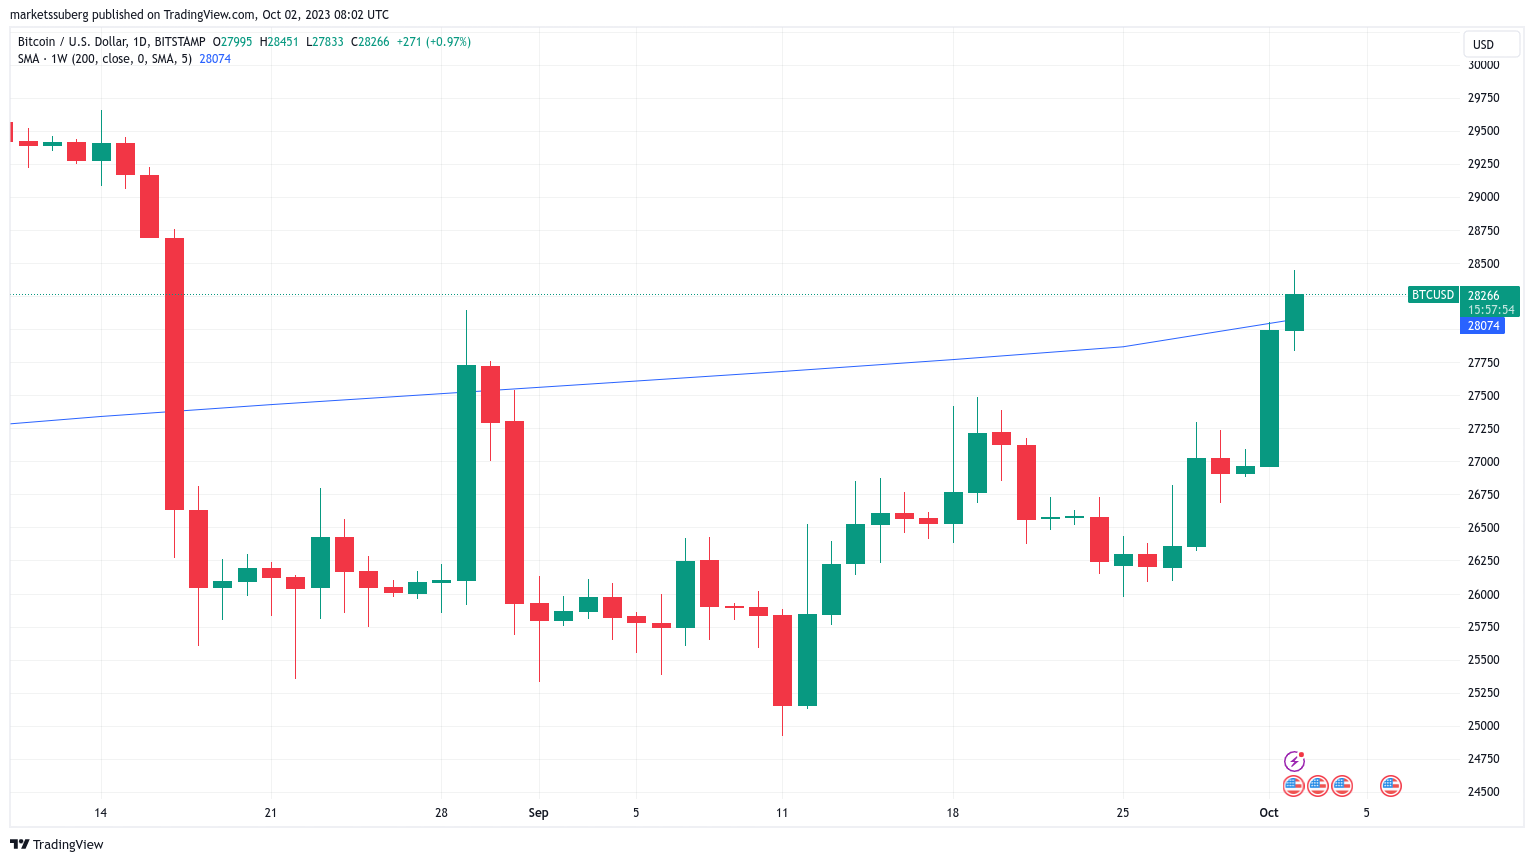
BTC/USD 1-day chart with 200-week simple moving average (SMA). Source: TradingView
He added that the impetus to decide where the market headed now lay with spot traders.
$BTC Binance Perp
— Skew Δ (@52kskew) October 2, 2023
Liquidity perspective
More liquidity being added towards the ask side of the book
Important if taker bid comes back later today (Perp Delta / CVD) pic.twitter.com/MhatEYC2HP
Keith Alan, co-founder of monitoring resource Material Indicators, posted a snapshot of the Binance order book, showing $28,000 as the main hurdle to overcome just after the move.
Bitcoin, he added, was now contending with resistance in the form of the 200-week moving average at $27,970.
“Expecting another run at resistance this month, but since I’m still in ‘Buy the Dip, Sell the Rip Mode’ I’m going to stick to those rules, take the quick money and look for the next setup,” part of accompanying commentary read.
Expecting volatility to continue over the next 24 hours.
BTC/USD order book data for Binance. Source: Keith Alan/X
A classic “Uptober?”
Bitcoin beginning October on a strong note puts it at odds with the scenes from last year.
As Cointelegraph reported, a 0.7% dip heralded the start of what is statistically the strongest month for BTC price gains.
A surprisingly sideways month followed, culminating in the FTX meltdown, which sent crypto markets tumbling to two-year lows later in Q4.
This year, so far, it feels different and more like the classic “Uptober” in years gone by. According to data from monitoring resource CoinGlass, BTC/USD has not finished October lower than it started since 2018.
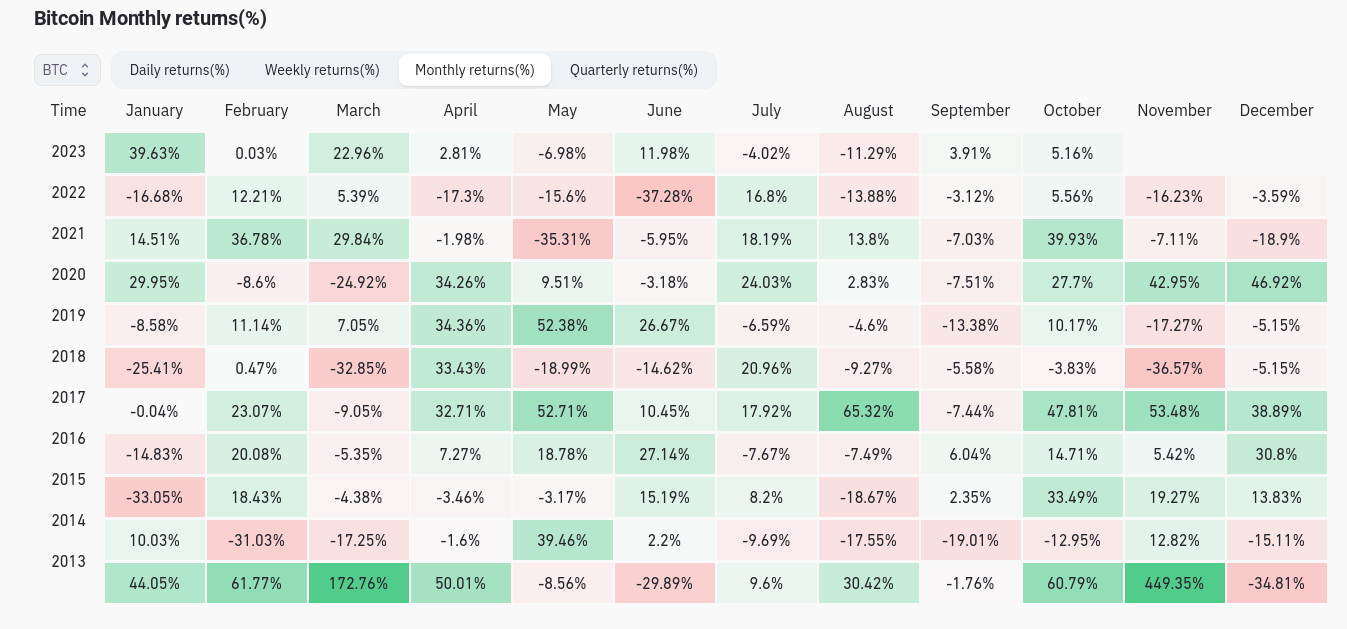
BTC/USD monthly returns (screenshot). Source: CoinGlass
Debating the topic, popular market commentators were happy to channel the spirit of 2021 — the year in which Q4 saw not a multiyear low but a new all-time high for Bitcoin.
Popular trader Jelle went further, suggesting that Bitcoin was in the midst of a more significant trend change.
“Bitcoin broke its mid-term downtrend, retested it, and is now starting the next leg higher,” he proclaimed alongside an explanatory chart.
Strong weekly close behind us, most charts look like we'll push even higher this week. Welcome to Uptober.
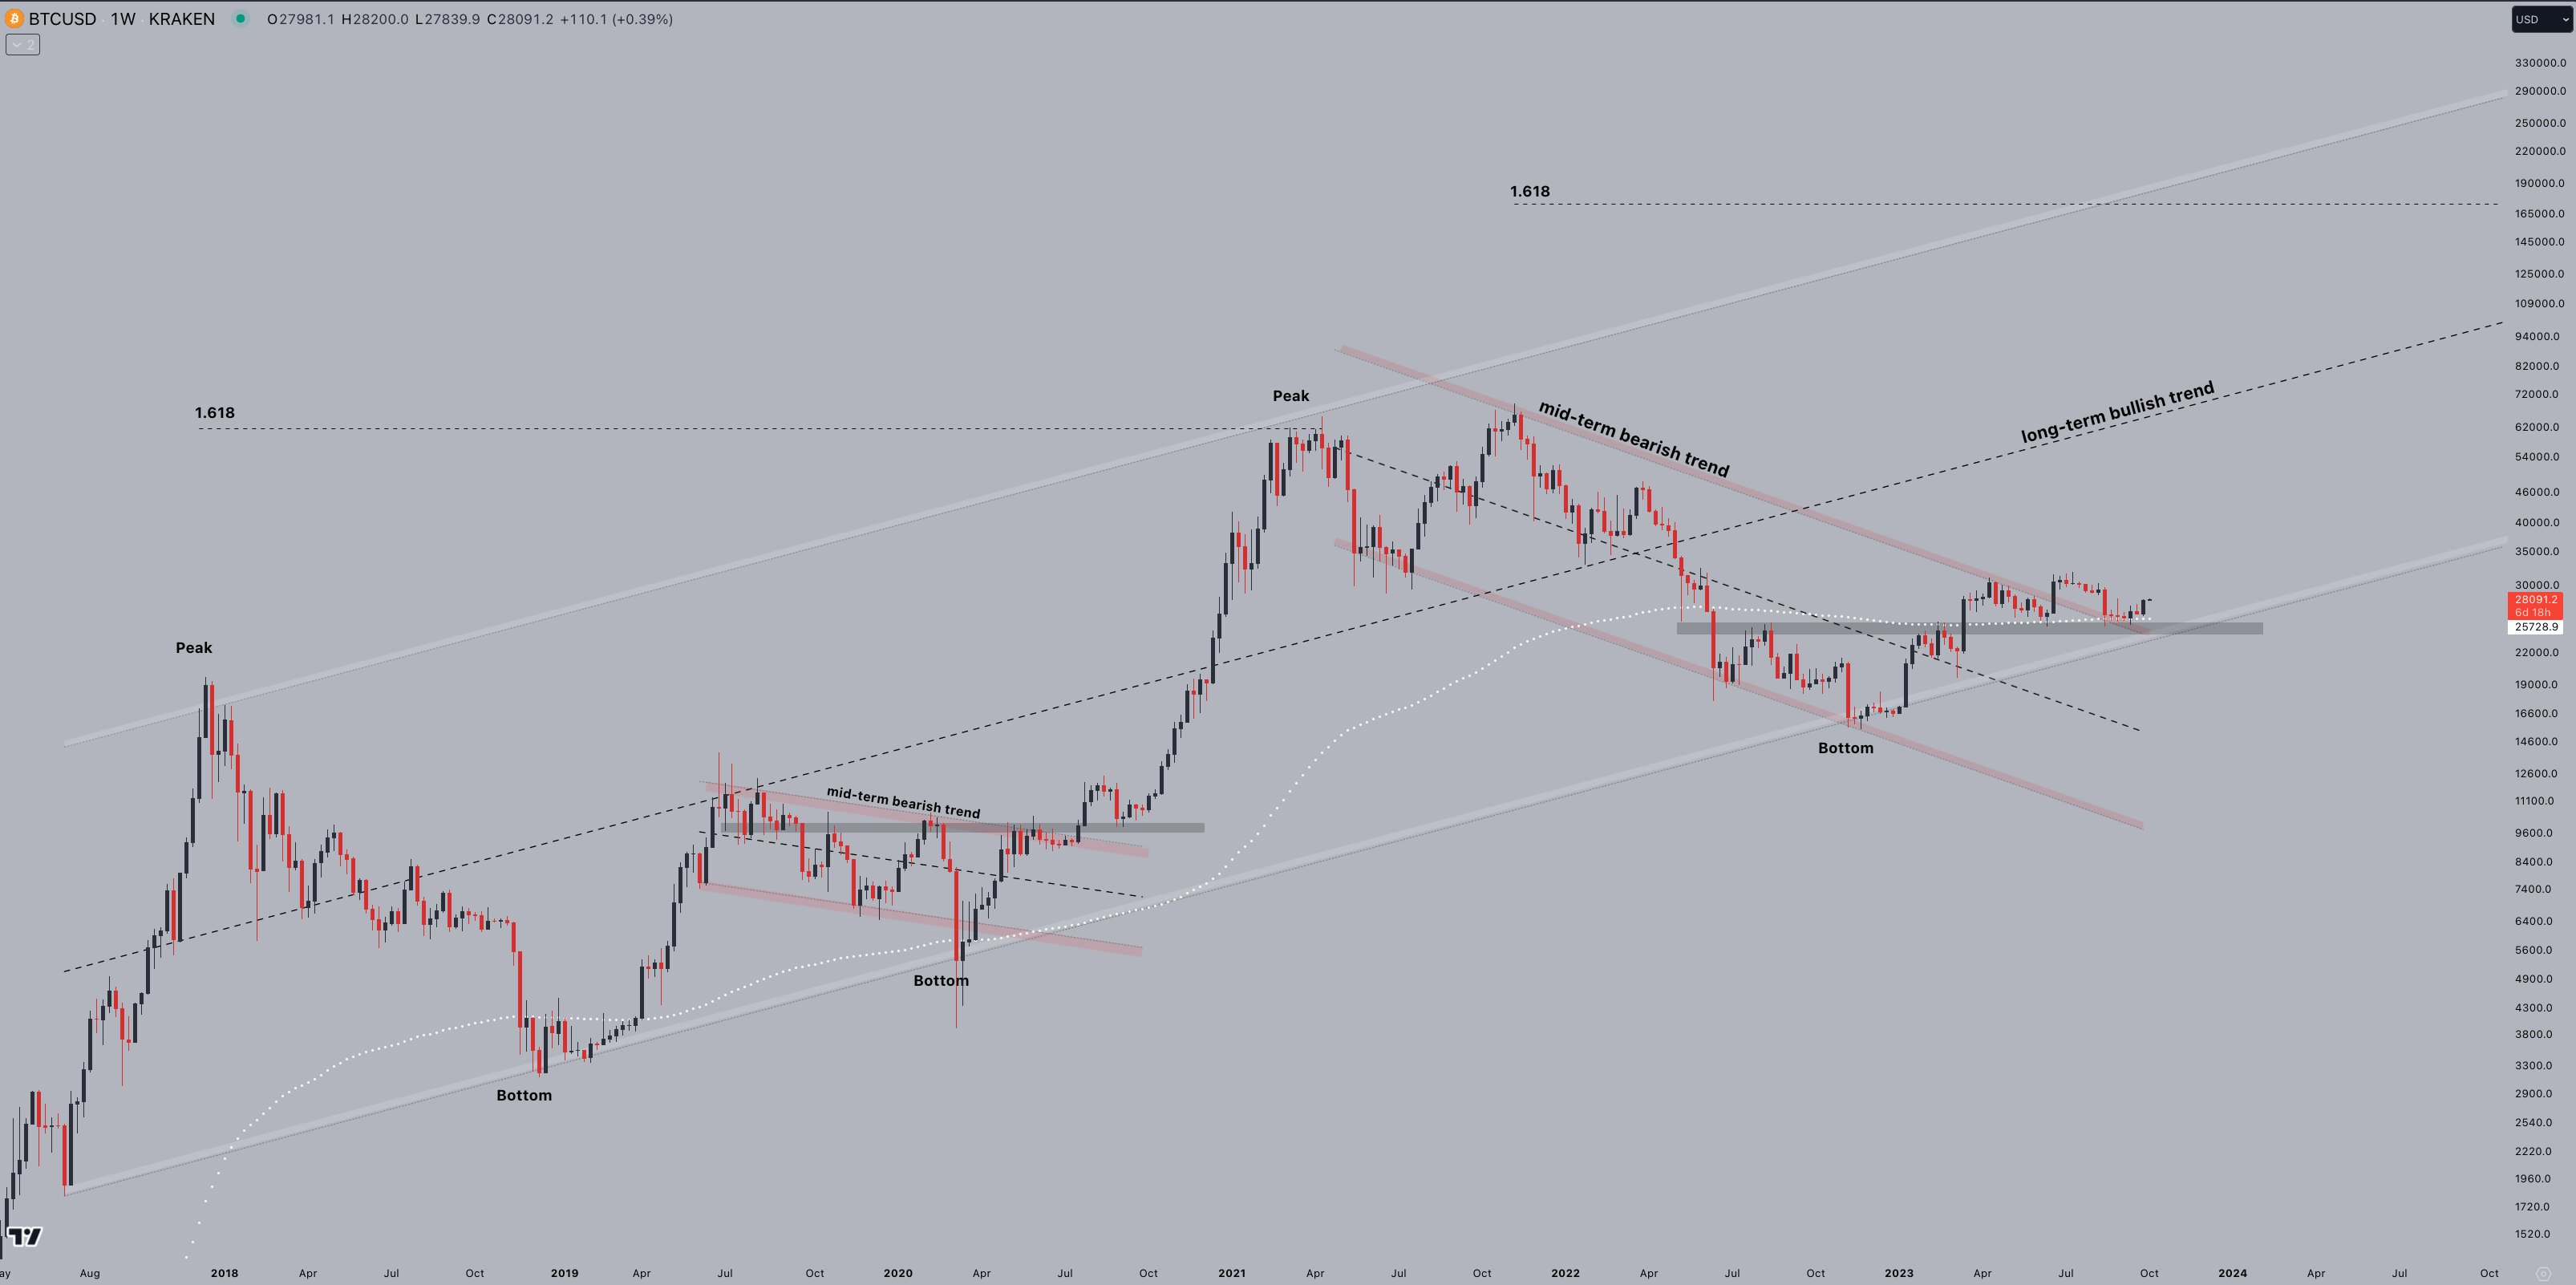
BTC/USD annotated chart. Source: Jelle/X
Previously, like Van de Poppe, Jelle had argued that this month could see BTC/USD head beyond $30,000 for the first time since June.
“8 out the previous 10 Octobers were positive for Bitcoin,” popular analytics account Stack Hodler wrote in part of his own analysis on Oct. 1, noting that on average, returns during that time had averaged 22%.
Difficulty due to come off record high
In a turnaround from what has become the norm in recent months, Bitcoin network fundamentals are not mimicking the bullish mood on spot markets.
The latest estimates from data resource BTC.com show that conversely, difficulty is due to drop by 0.7% at its next automated readjustment on Oct. 2.
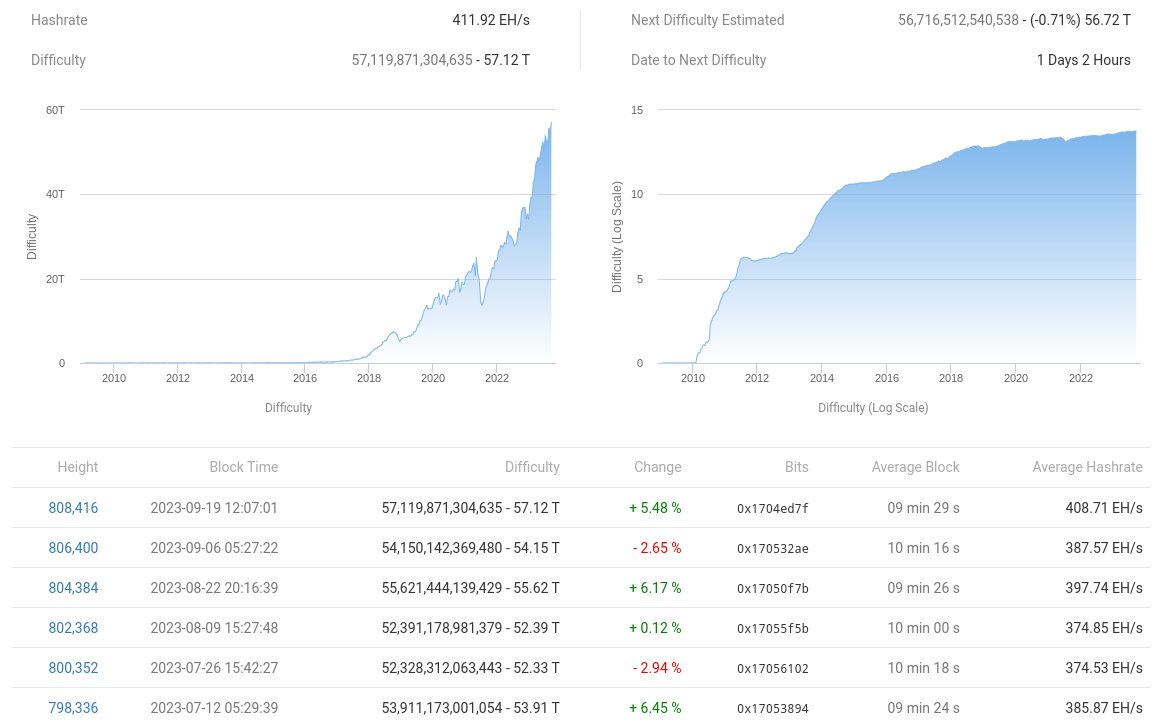
Bitcoin network fundamentals overview (screenshot). Source: BTC.com
Currently at all-time highs, difficulty last gained almost 6% at a time when BTC price performance was decidedly uncertain.
Miner competition remains fierce, as Cointelegraph reported in September, and spikes in hash rate underscore the ever-changing environment as miners make long-term commitments to the network in the name of profitability.
With hash rate — the estimated processing power deployed to the network — also higher than ever, the classic mantra “price follows hash rate” has returned to the fore.
Not everyone adheres to the saying, with some of Bitcoin’s most revered names arguing that the opposite is true: that hash rate follows price.
Among them is Jameson Lopp, co-founder and chief technology officer at Bitcoin storage firm Casa.
In a blog post released at the weekend, Lopp unveiled the results of his efforts to predict hash rate more accurately.
“By blending together many hashrate estimates and weighting them based upon recent estimates with a variety of trailing data time frames we were fairly easily able to improve upon the 1100 block estimate and decrease the average error rate by 13% and lower the standard deviation by 14%,” he summarized.
Depending on the resource used, hash rate values can differ considerably, with only the broad trend clearly visible to observers.
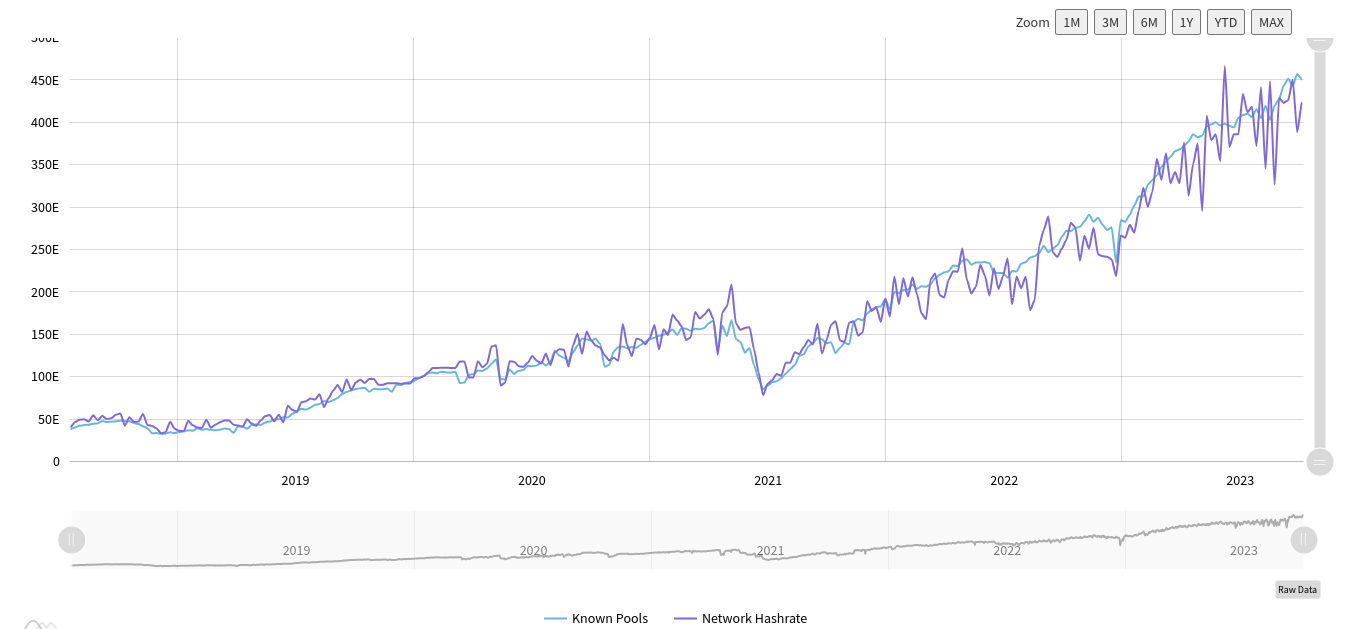
Bitcoin raw hash rate data (screenshot). Source: MiningPoolStats
Fed speakers headline macro diary
While Bitcoin gets excited into the first week of October, the same cannot be said for United States macro data, which is due a calmer start to the month.
The main would-be event of the week has arguably already occurred, as lawmakers averted a government shutdown at the last minute.
Ukraine aid formed the sticking point, with this being removed to strike a deal in Congress.
Turning to the month’s outlook, the financial commentary resource The Kobeissi Letter focused on forthcoming commentary from officials at the Federal Reserve.
Ahead of the next Federal Open Market Committee (FOMC) meeting to decide interest rate policy on Nov. 1, markets will continue to eye official language for clues.
“The next Fed meeting is in exactly one month. With 13 Fed speakers this week, we expect even more volatility,” Kobeissi summarized on X.
The latest data from CME Group’s FedWatch Tool shows mixed feelings over what the FOMC will decide. The market currently puts the odds of rates remaining at their present levels at 62%.
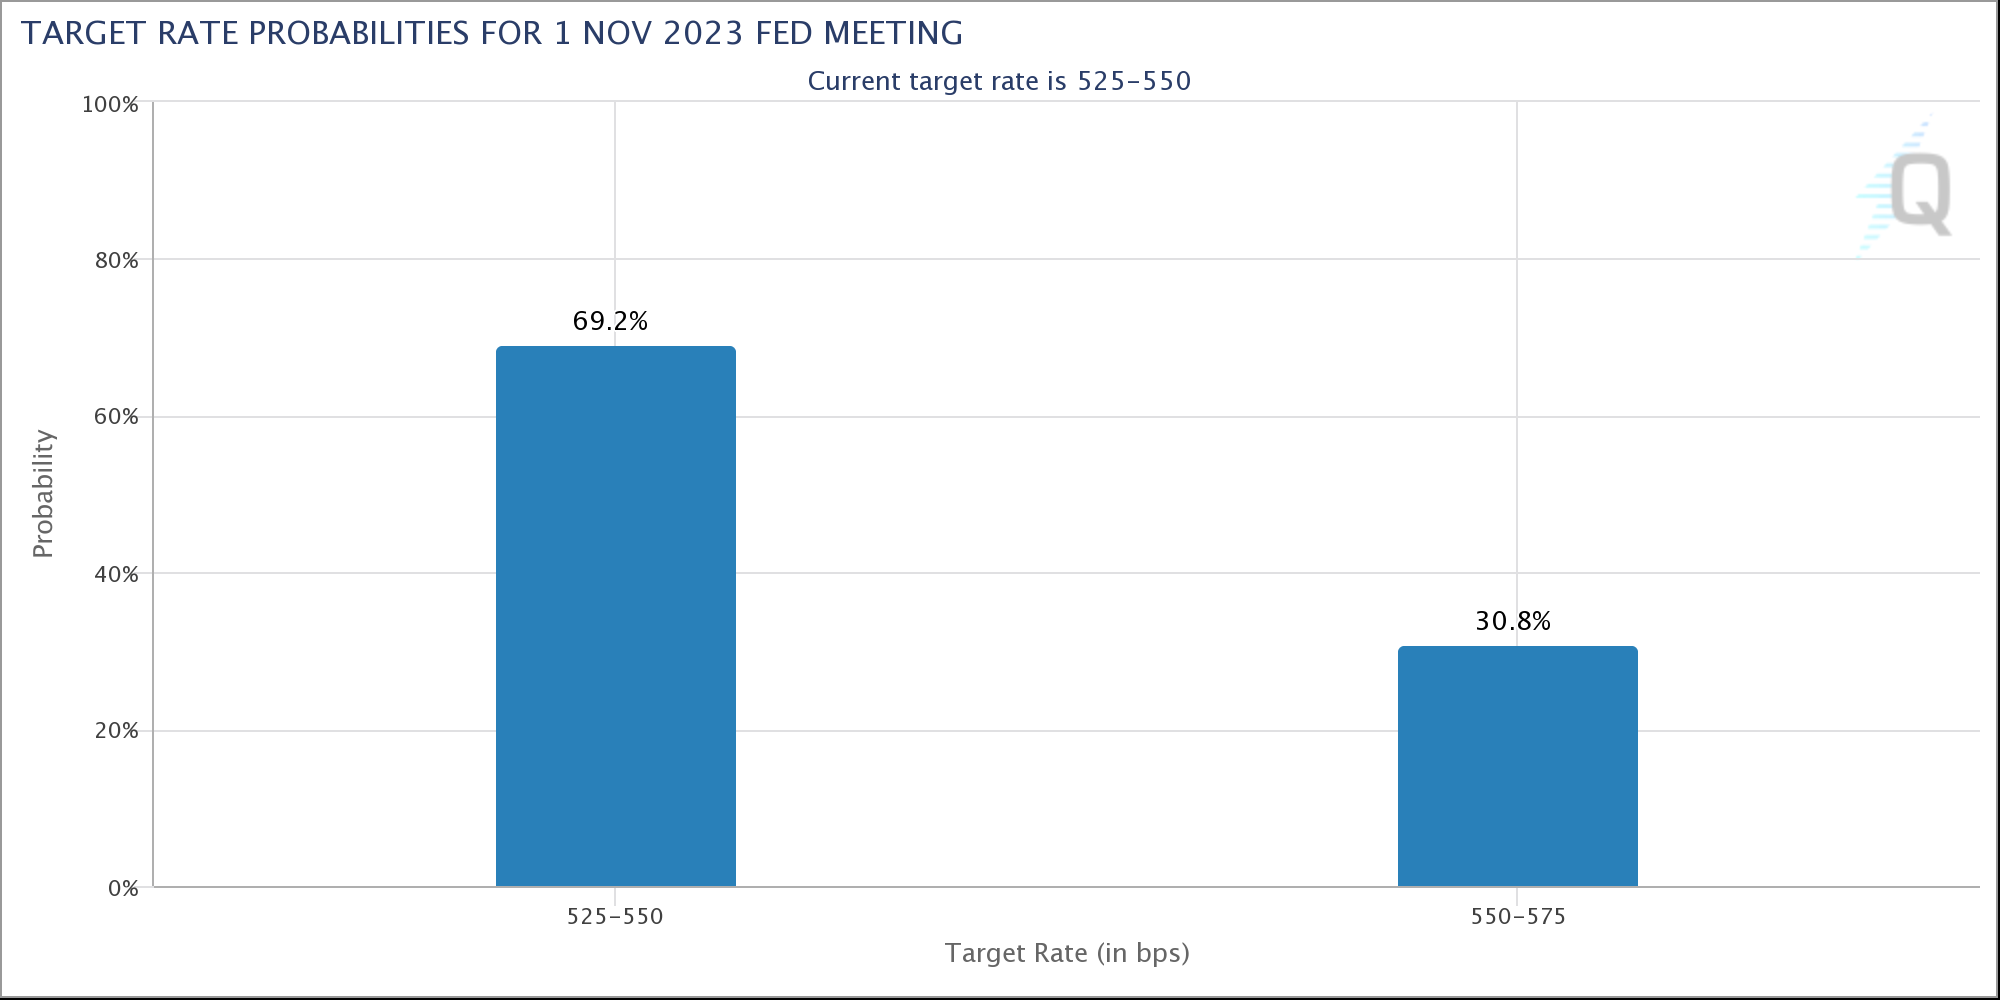
Fed target rate probabilities chart. Source: CME Group
Analysis turns positive on Dollar liquidity
Eyeing an associated macro phenomenon, meanwhile, financial commentator Tedtalksmacro pointed to U.S. liquidity trends and their impact on BTC price action going forward.
Related: Will Bitcoin ‘Uptober’ bring gains for MKR, AAVE, RUNE and INJ?
The relationship between global liquidity and risk asset performance is well documented — especially given the fluctuations occurring since the outbreak of the COVID-19 pandemic.
Late last week, Tedtalksmacro showed a divergence between net U.S. dollar liquidity and BTC/USD.
In the accompanying analysis, he argued that measuring delta over “outright liquidity” gave better insight. Regarding the outlook for Bitcoin, he was complimentary.
“Most importantly, the path of least resistance is now sideways / higher from here in the years to come... but substantial risk remains ( for at least a few quarters ), that you get chopped up before things rip quickly higher,” he wrote.
Measuring liquidity outright is not so useful for informing investment decisions and tends to lag, however, measuring the delta or change week-on-week, month-on-month is much more powerful.
— tedtalksmacro (@tedtalksmacro) September 29, 2023
As there is often a lead on the liquidity side, at least when comparing with BTC price… pic.twitter.com/1DvE7xInxC
Author

Cointelegraph Team
Cointelegraph
We are privileged enough to work with the best and brightest in Bitcoin.


