BTC miners 'finally capitulating' – Five things to know in Bitcoin this week

Bitcoin (BTC) starts a new week nearing key resistance as the shock of the latest United States inflation data passes — can the strength continue?
The July 17 weekly close may have been practically identical to the last, but BTC/USD is showing some much needed strength prior to the July 18 Wall Street open.
Last week was a testing time for crypto hodlers everywhere, with inflation dictating the mood across risk assets and the U.S. dollar capping the gloomy atmosphere. With those pressures now easing — at least temporarily — the mood has room to relax.
At the same time, on-chain data suggests that now is a make or break moment for Bitcoin miners, and capitulation across the market feels close.
As talk over where Bitcoin’s macro bottom could lie continues, Cointelegraph takes a look at several factors primed to shape BTC price performance in the coming days.
All eyes on weekly moving averages
Those watching the weekly chart on BTC will have a sense of deja vu this time around — BTC/USD finished July 17 under $100 away from where it was on July 10.
The latest weekly close is something of a disappointment in and of itself, with Bitcoin erasing gains at the last minute to print a “red” candle for the past seven days.
What happened next, on the other hand, had the opposite tone — a swift overnight march higher, the largest cryptocurrency adding $1,400 in under twelve hours.
It all leads up to a familiar challenge on intraday timeframes — BTC/USD is approaching both $22,000 and a key trendline at $22,600 in the form of the 200-week moving average (WMA).
Previously acting as support in bear markets, the 200 WMA has in fact flipped to resistance this time around, having been lost in mid-June and never reclaimed.
As such, analysts are eyeing that level as a key area of interest should bulls be able to sustain upside pressure.
For PlanB, creator of the Stock-to-Flow family of BTC price models, a factor beyond spot price is meanwhile reinforcing its importance. As in previous bear markets, the 200 WMA briefly went above Bitcoin’s realized price this year, providing a classic market reversal signal.
Realized price refers to the average price at which all the bitcoins in existence last moved.
“In the bear market of 2014/15 and 2018/19 (blue) realized price was above 200WMA and the bull market did not start until realized price and 200WMA touched,” PlanB told Twitter followers on July 17 alongside an accompanying chart.
Now realized price and 200WMA already touched at $22K. For the next bull market we need BTC above realized price and 200WMA.
As Cointelegraph reported, bulls seem to need to play a game of moving averages on longer timeframes, too. In addition to the 200 WMA, the 50-week and 100-week exponential moving averages (EMAs) also figure in forecasts.
The 50 EMA currently sits at $36,000 and the 100 EMA at just above $34,300, data from Cointelegraph Markets Pro and TradingView shows.
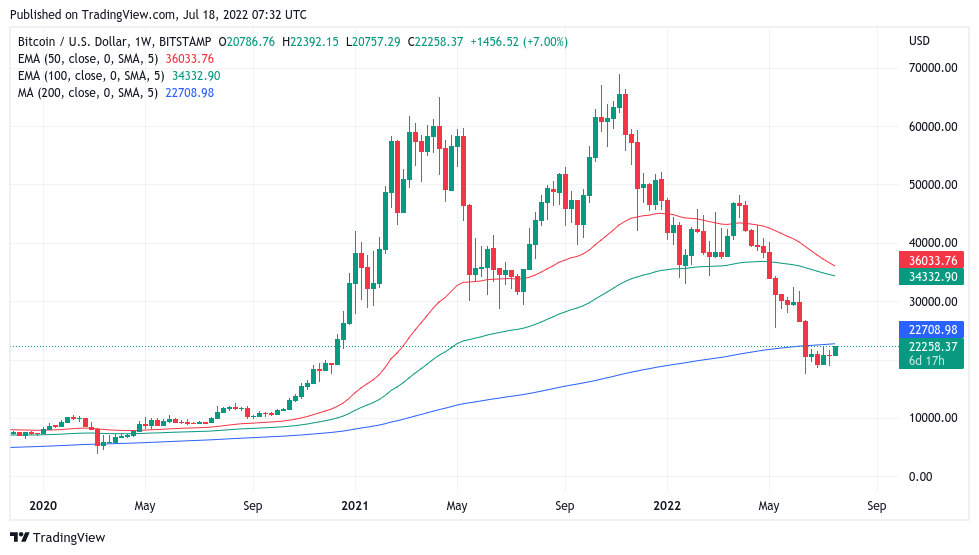
BTC/USD 1-week candle chart (Bitstamp) with 50, 100 EMA; 200 WMA. Source: TradingView
Ethereum nears $1,500 in potential trendsetter move
One catalyst that could take Bitcoin over its key resistance mark at $22,600 could come from an unlikely source — altcoins.
While normally moves on Bitcoin see other cryptocurrencies before copycat moves up or down, this week, some are waiting to see if BTC/USD will follow largest altcoin Ether (ETH) higher.
Amid news that its transition to Proof-of-Stake (PoS) mining could soon complete, Ethereum has outperformed in terms of price gains in recent days, and is up 25% over the past week alone.
At the time of writing, ETH/USD was about to challenge $1,500 for the first time since June 12.
“$eth reclaimed its 200 week moving average this week, btc will probably next week, the time to be bearish has defo to an end imo,” popular Twitter account Bluntz summarized on the day.
Fellow commentator Light likewise considered that Ethereum’s strength should keep upward pressure on Bitcoin, noting liquidations among those traders ignoring the ETH moves and continuing to be short BTC.
Cross-crypto short liquidations in the 24 hours into July 18 totaled around $132 million, data from on-chain monitoring resource Coinglass confirms.
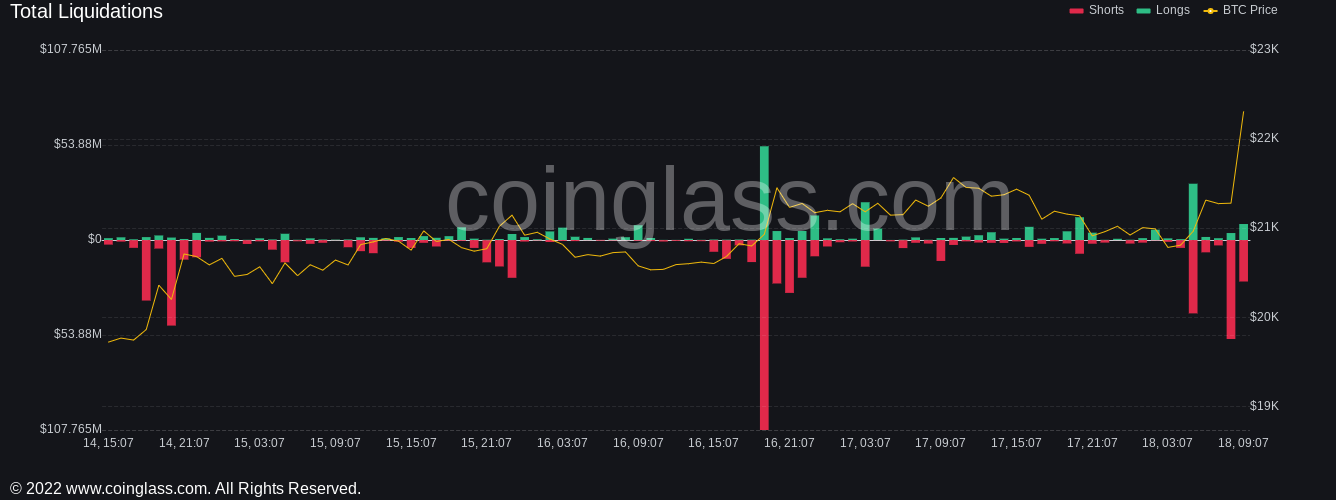
Crypto liquidations chart. Source: Coinglass
Going forward, however, not everyone is convinced that Ethereum will be able to break its overall downtrend, with the implications obvious for other tokens as a result.
Cointelegraph contributor Michaël van de Poppe argued that the pull of the weekend CME futures gap on Bitcoin could provide a downside force to puncture the optimism.
CME futures finished their previous trading day, July 15, at around $21,200.
“With the potential of a CME gap beneath us (and Bitcoin swimming around the previous CME gap), I won't be surprised with a fake-out move and retest lower for $ETH,” he wrote in an update.
Looking to get into longs around the $1,250-1,280 region.
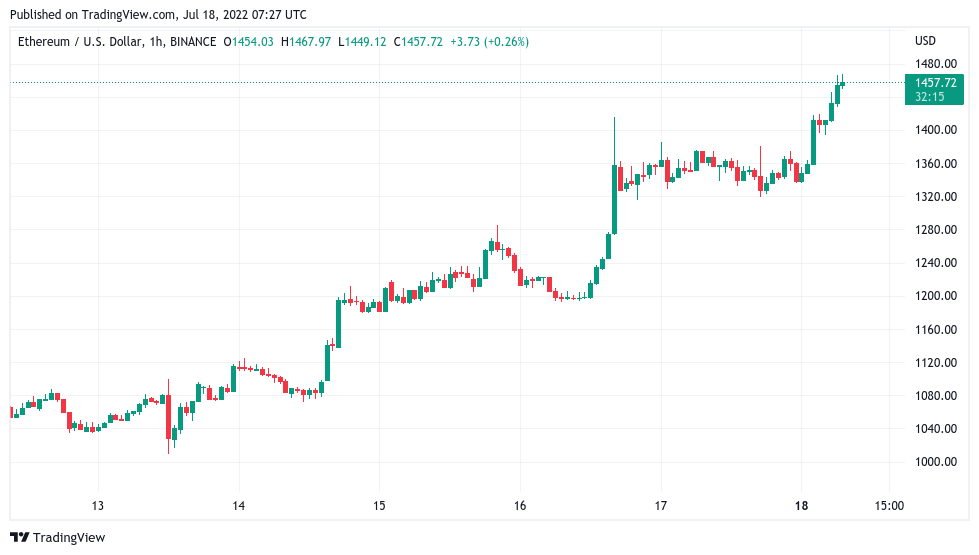
ETH/USD 1-hour candle chart (Binance). Source: TradingView
Dollar strength finally flips in Bitcoin's favor
On the topic of macro movements, the landscape looks overall less frenetic than that which greeted crypto investors last week.
Inflation data has come and gone, and the debate over whether inflation has or has not peaked in the U.S. thus cools until the next Consumer Price Index (CPI) print in August.
The Federal Reserve will decide on how to tackle inflation as regards key interest rate hikes later this month, the Federal Open Markets Committee (FOMC) nonetheless set to meet only on July 26.
Any macro cues when it comes to BTC price action will thus be coming from other areas, with geopolitical triggers high on the list of potential factors.
Asian markets were stronger as the week began thanks to a modest recovery in Chinese tech stocks previously hammered by Coronavirus nerves.
At the same time, the U.S. dollar, the star of recent weeks as equities worldwide felt pressure, began to consolidate its gains.
The U.S. dollar index (DXY), strength in which has long been inversely correlated with cryptoasset performance, headed south under 108 on the day, having reached fresh two-decade highs the previous week.
“Finally seeing a drop on the daily,” Twitter analyst IncomeSharks commented, highlighting the potential for DXY to test a trendline from May.
Even a drop to this trend line would be big for Stocks and Crypto. Would line up perfectly with a bullish week before the FED meeting.
Fellow account Rickus also felt that Bitcoin would not “break down again” despite a pullback still being possible — thanks to the DXY comedown and a stronger finish for the S&P 500.
“Should give room this week for equities & crypto to bounce until it find near support,” 0xWyckoff, creator of crypto trading resource Rekt Academy, added in part of a thread about the DXY.
In a separate observation meanwhile, Dan Tapiero, managing partner and CEO at 10T Holdings, noted that a macro USD high versus the Chinese yuan should mark a turnaround point for BTC.
“Last 3 major BTC highs in 2014, 2018, 2021 roughly coincided with highs in Chinese RMB/lows in USD,” he noted in part of a tweet on July 18.
Suggests that Dollar peak soon would be supportive of BTC low.
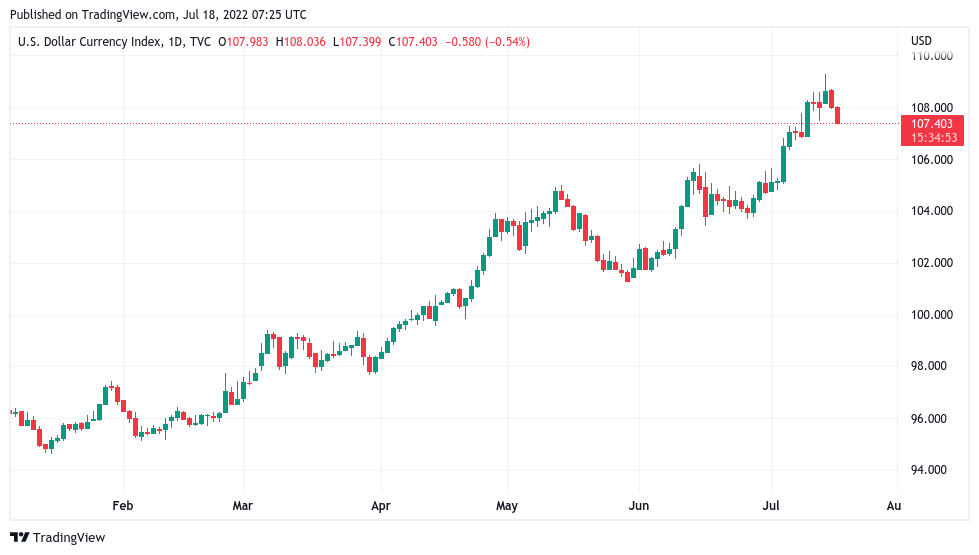
U.S. dollar index (DXY) 1-day candle chart. Source: TradingView
Miners dump 14,000 BTC in days
With so much hope that a trend turnaround could be on the cards, on-chain data showing Bitcoin miners selling inventory looks all the more bleak.
According to data from on-chain analytics platform CryptoQuant, beginning July 14, miners removed a significant chunk of BTC from their reserves.
The effect was that miner reserves fell to their lowest levels since July 2021, a point which also marked a BTC price low.
Reserves stood at 1.84 million BTC on July 18, down 14,000 BTC versus the July 14 tally.
For CryptoQuant contributor Edris, the numbers were an encouraging sign, hinting that miners were now contributing to establishing a macro BTC price floor.
“Bitcoin miners are finally capitulating,” he summarized over the weekend.
BTC price has been consolidating at the $20K level for the past few weeks, making investors wonder whether an accumulation or distribution phase is going on. Looking at the Miners' Reserve chart, it seems like the latter is the case.
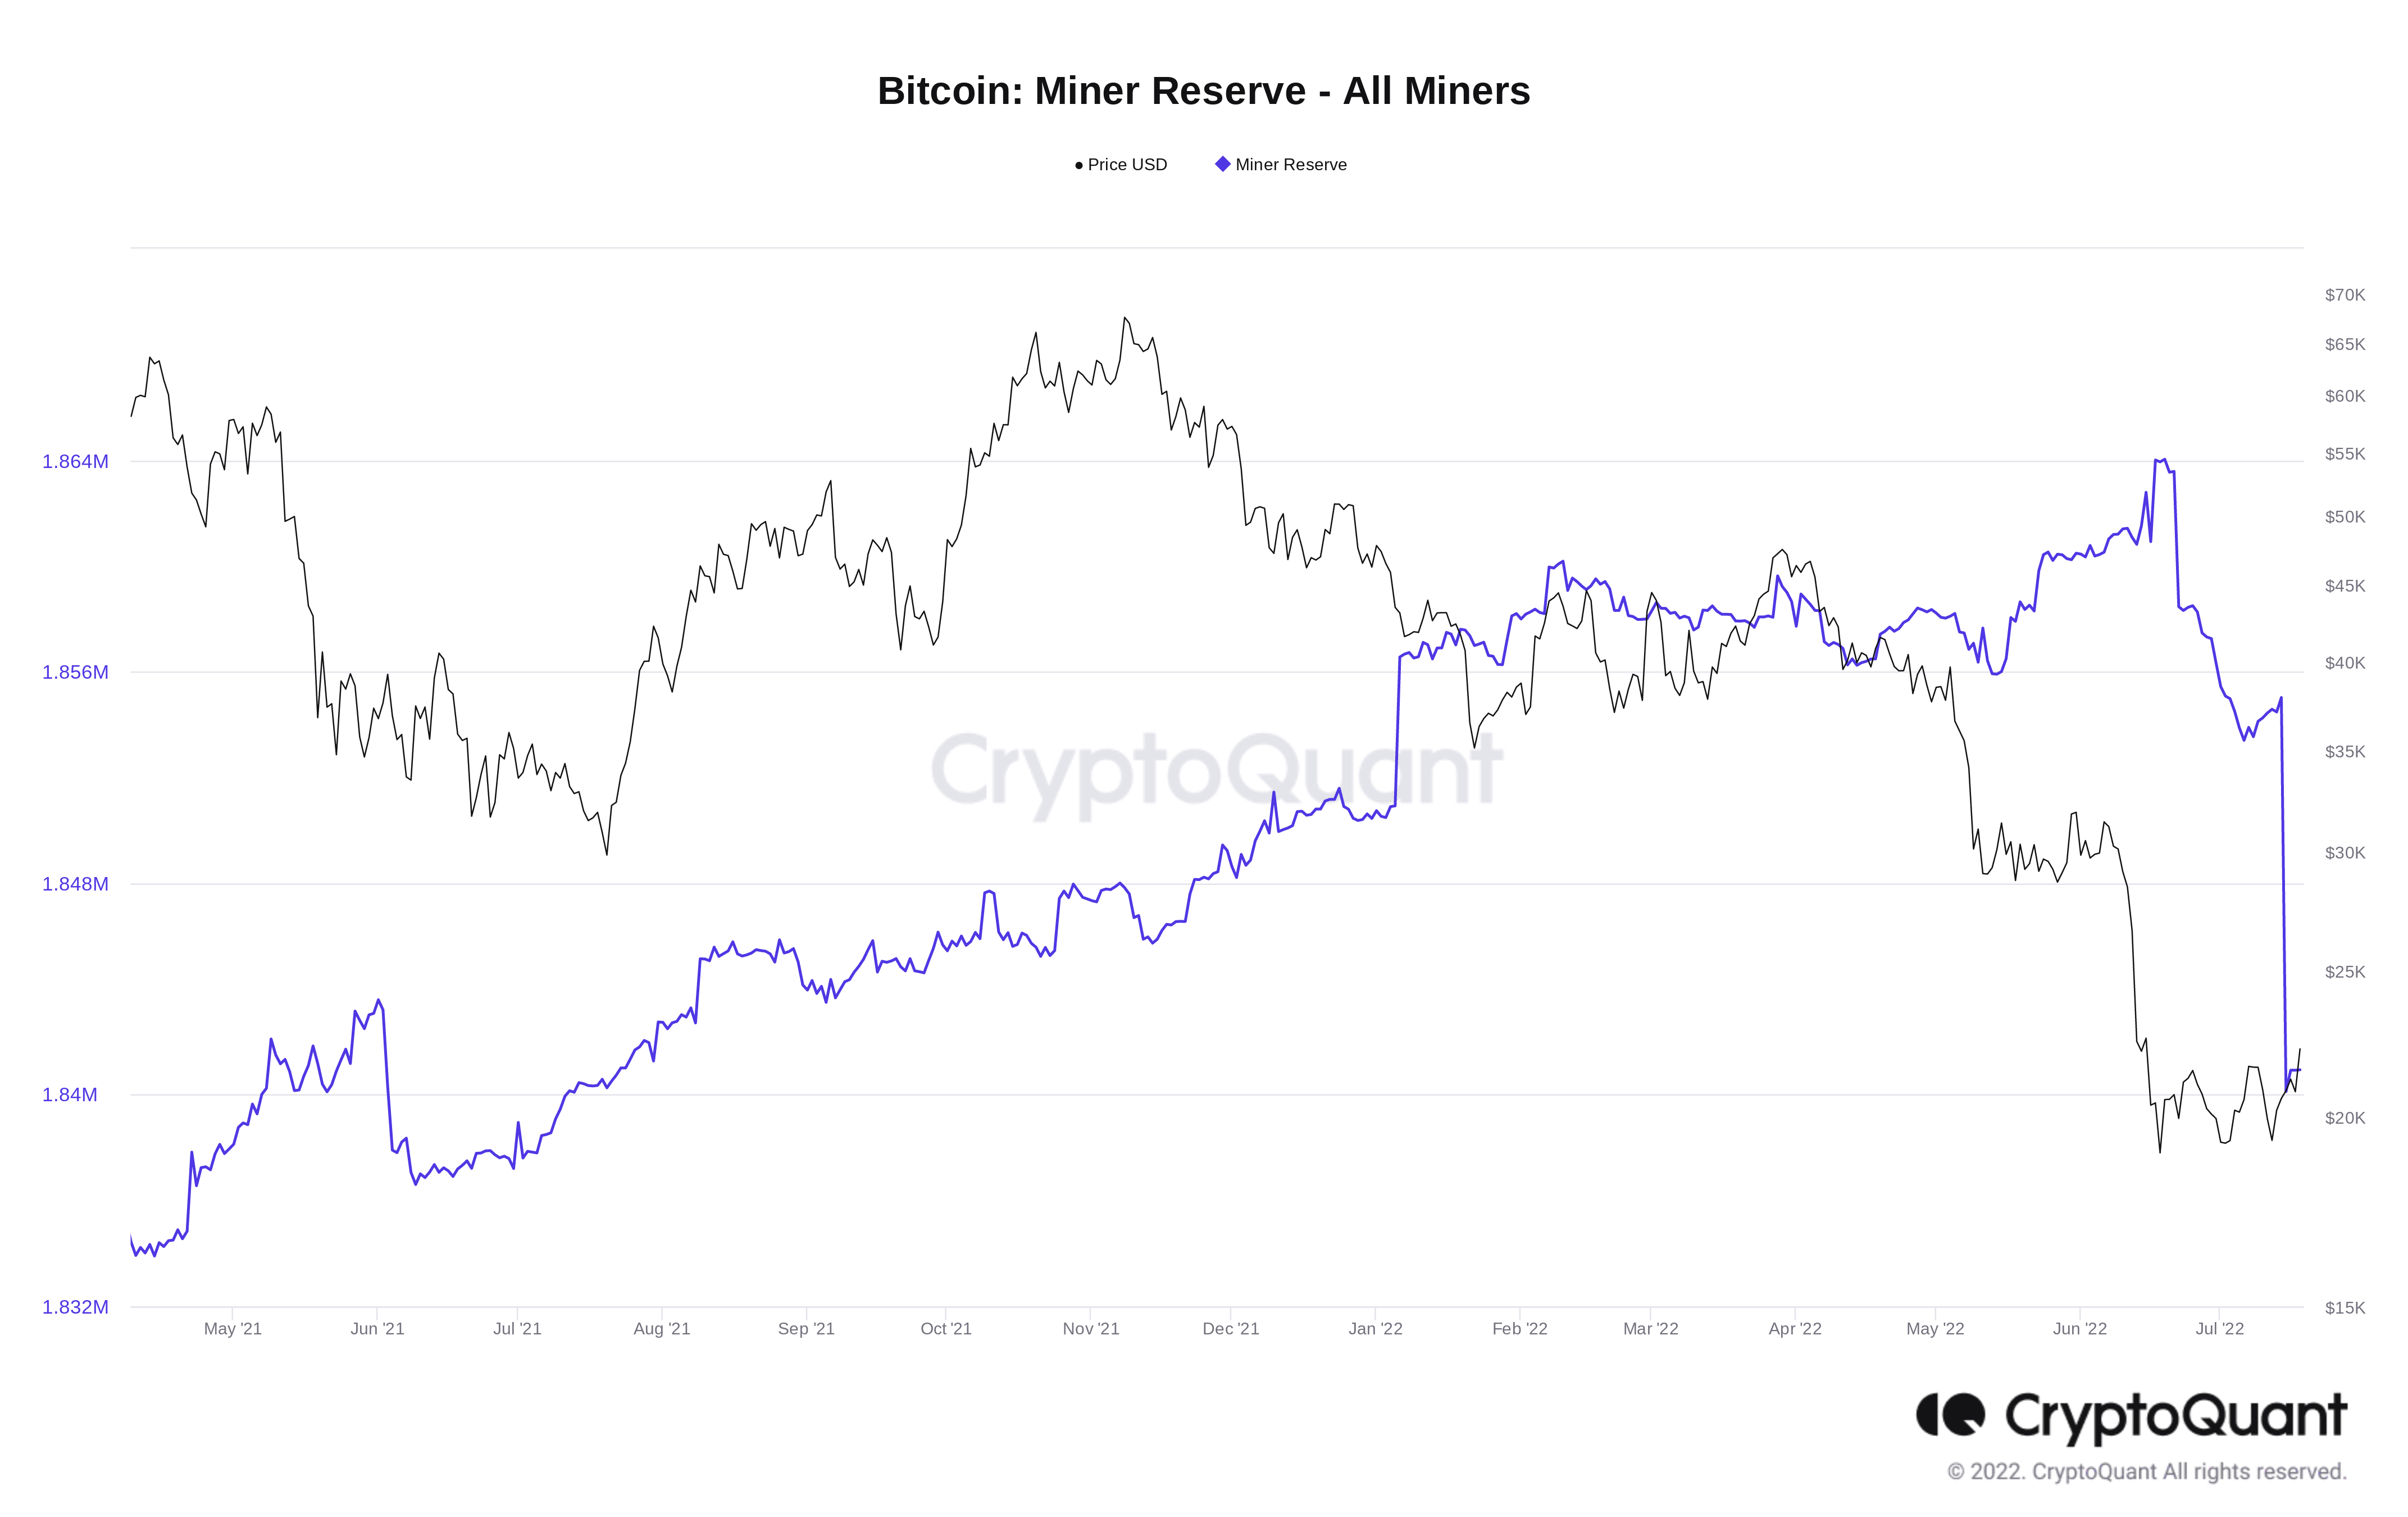
Bitcoin miner reserves chart. Source: CryptoQuant
Macro analyst Alex Krueger meanwhile described June’s miner sales as a “clear sign of capitulation,” adding that miners “tend to accumulate on the way up then puke when things go bad.”
RSI sparks "very rare" BTC price inflection point
Finally, a “rare” event on the Bitcoin chart may just have provided the fuel for a historic turnaround, analysis suggests.
Taking the BTC/USD chart from the beginning of Bitcoin’s lifespan, Stockmoney Lizards noted that Bitcoin’s relative strength index (RSI) is now at suitably low levels and has combined with a touch of a log chart trendline which sparked the greatest BTC price recoveries.
“Current exciting and very rare situation now,” it announced at the weekend.
RSI below 45 and logaritmic bottom showed a great reversal in the past, followed by a crazy bull run. Cross = RSI<45 + log. Bottom.
An accompanying chart showed the power of such an event, which follows RSI hitting its lowest levels on record.
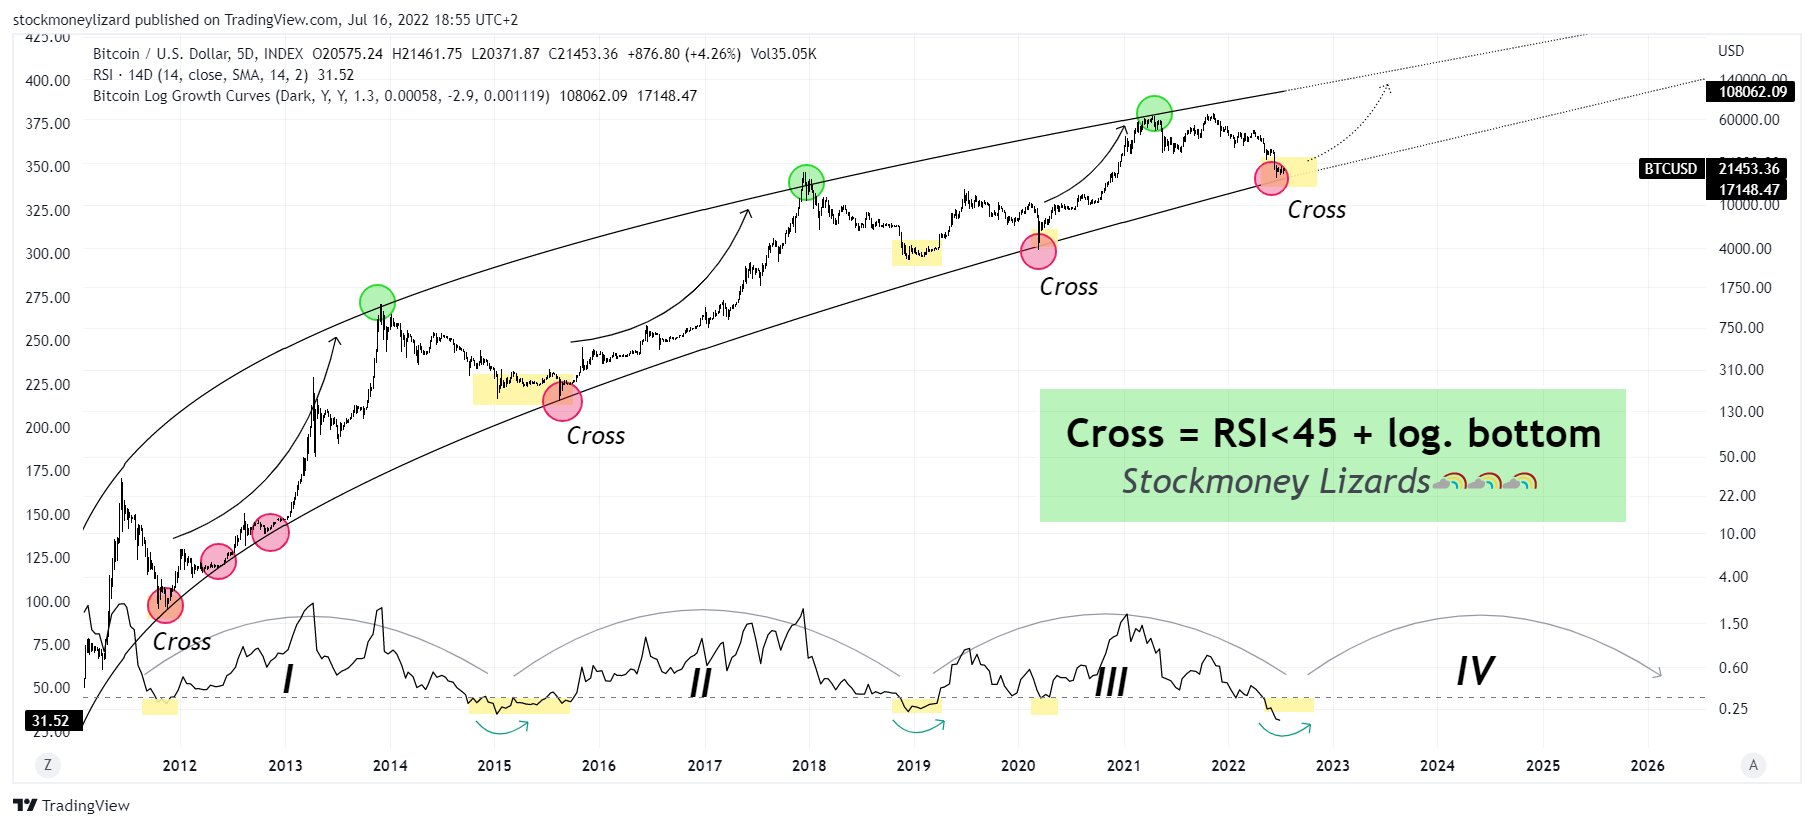
BTC/USD annotated chart. Source: Stockmoney Lizards/ Twitter
For CoinPicks analyst Johnny Szerdi, meanwhile, Bitcoin needed to break the 50 mark on RSI, a key resistance zone in recent months, to avoid the risk of a fresh sell-off.
Author

Cointelegraph Team
Cointelegraph
We are privileged enough to work with the best and brightest in Bitcoin.


