Bitgreen sweeps Polkadot's 29th parachain auction ahead of a 14% tumble in DOT price


  • Polkadot price could quickly validate a 14% falling triangle breakout to $5.30.
  • Bitgreen, a platform linking Web3 and DeFi, wins Polkadot’s 29th parachain auction.
  • The prevailing oversold conditions may invalidate the move to $5.30.

Polkadot price’s time in the murky waters of a bear market run seems far from over. If a falling triangle pattern matures, the parachain token risks plunging 14% from the breakout point. For now, support at $6.15 is moderating the building selling pressure. However, most technical indicators hint at a continuing downtrend.

Bitgree tops Polkadot 29th parachain auction

Bitgreen was announced the winner of the highly contested 29th Polkadot parachain auction. Parachains are used to connect to Polkadot blockchain by leasing a slot on its Relay Chain. Crypto projects that clinch the spot get up to 96 weeks of support, with an option to renew the lease.

Action winners are required to lock up a bond in DOT for the duration of the lease. The DOT tokens locked on the Polkadot blockchain are leased at the end of the lease – as it is viewed as the opportunity cost to use the assets for other engagements.

Bitgreen is an upcoming crypto project building a permissionless blockchain. The idea is to bring DeFi (decentralized finance) and Web3 under one roof while focusing “on green projects, renewable energy tech, microfinance & impact investing.”

DOT price is preparing for another selloff

Polkadot price is testing the strength of the buyer congestion zone at $6.15 after failing to crack the falling triangle’s hypotenuse resistance. The 50-day SMA (Simple Moving Average), red, was in line to provide support at $6.40, but it did little to prevent DOT price from revisiting the x-axis support.

A falling triangle is a highly bearish technical pattern often prolongs an asset’s preceding trend. In other words, Polkadot price will tumble 14% from the breakout point (a-axis). Traders must wait for the price to confirm movement below the support (a-axis) before activating their short orders. The breakout target is equal to the distance between the highest and lowest points of the falling triangle.
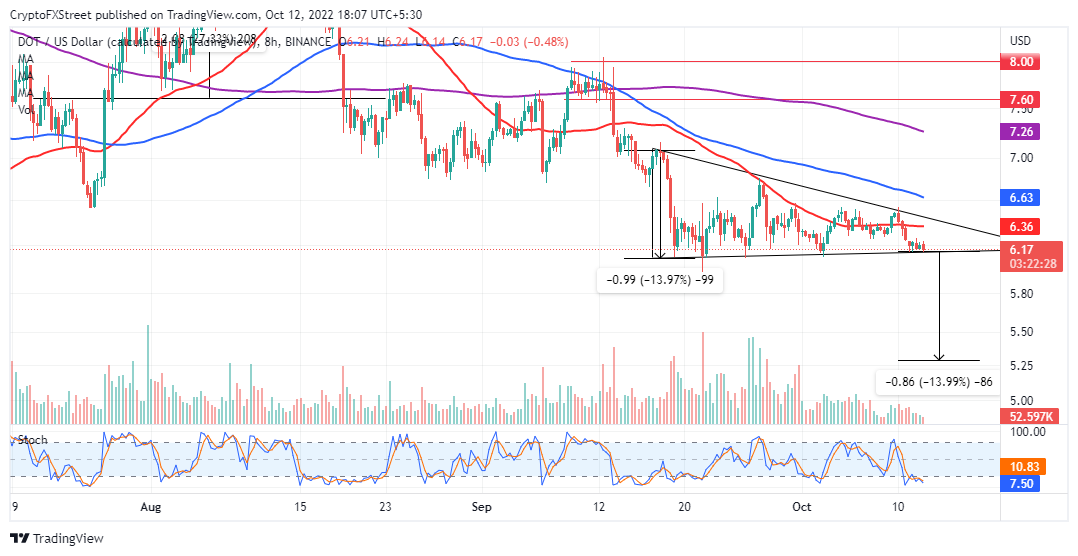
DOT/USD daily chart

DOT/USD daily chart

An immediate rebound from the axis support at $6.15 cannot be ruled out, especially with Polkadot price wallowing in oversold conditions. Insight from the Stochastic oscillator cements the bears’ influence on DOT. However, the index is expected to regain ground, which might call on buyers to join the market and take advantage of a potential swing to $7.10 or even to $8.00, respectively.


Information on these pages contains forward-looking statements that involve risks and uncertainties. Markets and instruments profiled on this page are for informational purposes only and should not in any way come across as a recommendation to buy or sell in these assets. You should do your own thorough research before making any investment decisions. FXStreet does not in any way guarantee that this information is free from mistakes, errors, or material misstatements. It also does not guarantee that this information is of a timely nature. Investing in Open Markets involves a great deal of risk, including the loss of all or a portion of your investment, as well as emotional distress. All risks, losses and costs associated with investing, including total loss of principal, are your responsibility. The views and opinions expressed in this article are those of the authors and do not necessarily reflect the official policy or position of FXStreet nor its advertisers. The author will not be held responsible for information that is found at the end of links posted on this page.

If not otherwise explicitly mentioned in the body of the article, at the time of writing, the author has no position in any stock mentioned in this article and no business relationship with any company mentioned. The author has not received compensation for writing this article, other than from FXStreet.

FXStreet and the author do not provide personalized recommendations. The author makes no representations as to the accuracy, completeness, or suitability of this information. FXStreet and the author will not be liable for any errors, omissions or any losses, injuries or damages arising from this information and its display or use. Errors and omissions excepted.

The author and FXStreet are not registered investment advisors and nothing in this article is intended to be investment advice.

Join Telegram

Recommended content


Recommended Content

Editors’ Picks

Ripple on-chain metrics show bullish signs amidst legal struggle with SEC, XRP eyes recovery

Ripple on-chain metrics show bullish signs amidst legal struggle with SEC, XRP eyes recovery

Ripple made a comeback above $0.48 on Tuesday and hovers above that level in Wednesday’s European session. Ripple on-chain metrics such as transaction volume and Network Realized Profit/Loss have turned bullish, supporting a recovery in the altcoin. 

More Ripple News

Bitcoin price falls amidst German government transfers, miners activity

Bitcoin price falls amidst German government transfers, miners activity

Bitcoin (BTC) extends correction on Wednesday and hovers around $61,000 after finding resistance near the $64,000 level on Monday. Recent on-chain data indicates heightened selling activity from Bitcoin miners early in the week. 

More Bitcoin News

Crypto Today: Bitcoin erases gains from end of June, Ethereum declines while Ripple holds

Crypto Today: Bitcoin erases gains from end of June, Ethereum declines while Ripple holds

Bitcoin wipes out gains from the last week of June and falls below $60,000 on Wednesday. Ethereum and top altcoins ranked by market capitalization erased gains as the inflation outlook worsened. Ripple holds on to recent gains and hovers above $0.48 on Wednesday. 

More Cryptocurrencies News

Three reasons why altcoins could shake off losses this week

Three reasons why altcoins could shake off losses this week

On-chain data from Santiment shows that altcoins are currently in the opportunity zone, or generating buy signals. The top three altcoins in the buy zone are Basic Attention Token (BAT), Chromia (CHR), and Highstreet (HIGH), per Santiment. 

More Altcoins News

Bitcoin: BTC price correction could end in July, according to seasonal data

Bitcoin: BTC price correction could end in July, according to seasonal data

Bitcoin (BTC) price appears poised for a decline this week, influenced by slight outflows in US spot ETFs, selling activity among BTC miners, and a combined transfer of 4,690.28 BTC to centralized exchanges by the US and German governments.

Read full analysis

BTC

ETH

XRP