Bitcoin's correlation to US equities and Ether weakens: Van Straten
-
To the general populace, bitcoin is considered a risk-on asset due to its volatility and perceived correlation with U.S. equities.
-
In 2024, Bitcoin and nasdaq have gone up or down together on the same day only 52% of the time.

Bitcoin (BTC), the largest token by market capitalization, is currently around the $92,000 price mark, up over 115% year-to-date. At the same time, the total cryptocurrency market has just breached $3.025 trillion, a new all-time high according to the metric TOTAL on TradingView.
The market perceives bitcoin as a risk-on asset; one of the riskiest assets in the market, the higher the degree of risk, the further out on the risk curve the asset is.
Bitcoin has an implied volatility of approximately 60% over the past 30 days, according to Glassnode data. However, the implied volatility has come down from over 100% in 2021. If bitcoin is held correctly in self-custody the fundamental properties of bitcoin support the idea of no inherent counterparty risk with the asset.
As bitcoin is considered a risk-on asset, it tends to have a high correlation with U.S. equities, which are also a risk-on asset, but again, not as far on the risk curve as bitcoin.
Looking at TradingView data, on a 30-day correlation basis, over the past five years, bitcoin has experienced periods of 1:1 correlation with the Nasdaq Composite. This was very much the case for 2021 and 2022 when both assets rose together and fell together; some would say they were joined at the hip.
This trend continued into the first half of 2024, when Bitcoin broke its all-time high, and went above $73,000 in March. However, since March, the Nasdaq has continued to make new all-time highs while bitcoin consolidated in a long-range between $50,000 and $70,000. But since Donald Trump won the U.S. election on Nov. 6, bitcoin has only continued to soar, while the nasdaq has stagnated.
The current 30-day correlation between the two assets is just 0.46, one of the lowest recorded levels in the past five years. While in September, we observed a negative correlation of almost -0.50.
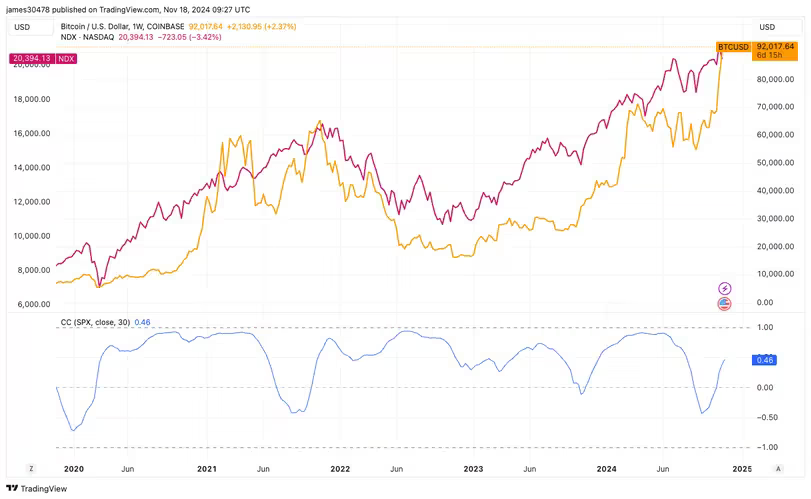
BTC VS Nasdaq Correlation (TradingView)
Since Donald Trump won the U.S. presidential election, bitcoin went on to make new highs above $93,000, while the Nasdaq also went on to make new all-time highs shortly after. However, the interesting part is the Nasdaq has fallen further away from its all-time high, of 4%, while bitcoin is just over 1.5% away from new highs.
Out of the 222 trading days so far in 2024, Bitcoin CME futures (which trades five days a week) and the Nasdaq have either fallen or risen together just 52% of the time, according to data from Investing.com. However, three of the past four trading days have seen bitcoin rise while the Nasdaq has fallen. This may be a small sample size, but it is something to keep an eye on.
Fidelity data shows two charts. The chart on the left shows the sharp ratio of major asset classes over the past five years. A sharp ratio compares an investment's return with its risk; according to the data, bitcoin would be the best asset class in terms of performance against its risk.
Second is how major assets are correlated with the S&P 500; bitcoin has only a 19% correlation with SPX, a relatively small correlation.
The data implies that bitcoin will be correlated to risk-on assets at certain moments, especially in times of risk-on or risk-off. However, the data shows that over a long period of time, and especially in the back half of 2024, we are starting to see a divergence in the correlation between bitcoin and the Nasdaq.
As bitcoin becomes a larger asset class, now the seventh largest asset by market cap, it is expected to start to trade on its own as the market has a better understanding of the asset.
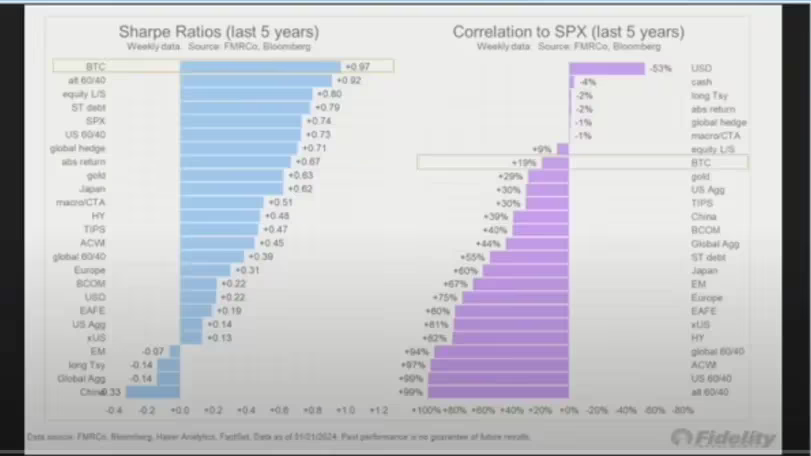
BTC Correlation and Sharpe Ratio (Fidelity)
Bitcoin and Ether's correlation weakens
This is also the case between the two largest tokens by market cap, bitcoin and ether (ETH). Since 2019, ether and bitcoin have had a 1:1 correlation, with a brief dip in 2021, when ether soared beyond bitcoin during the bull market where bitcoin stagnated.
However, on a 30-day rolling correlation, bitcoin and ether now just have a 0.35 correlation, which is the second lowest recorded level. The expectation is that as the market continues to gain a better understanding of these two assets, they may have a 1:1 correlation in certain moments, but over a long enough time frame, assets that used to be correlated may start to deviate away from one another.
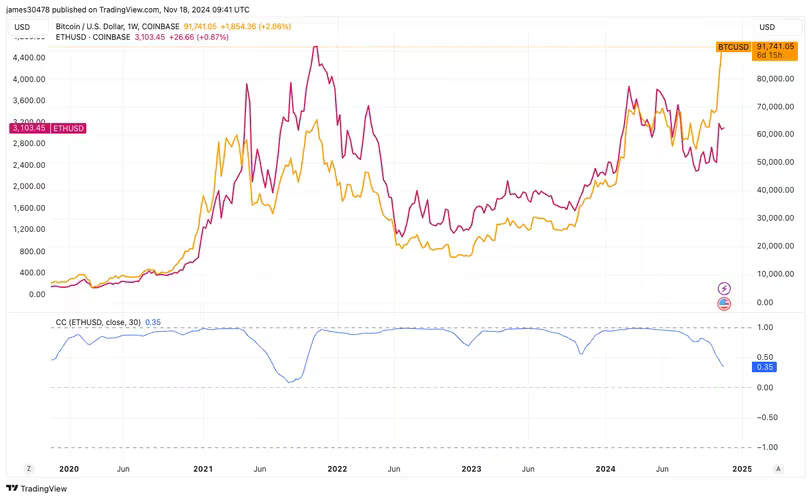
Bitcoin and ether correlation (TradingView)
Author

CoinDesk Analysis Team
CoinDesk
CoinDesk is the media platform for the next generation of investors exploring how cryptocurrencies and digital assets are contributing to the evolution of the global financial system.


