Bitcoin Weekly Forecast: Will BTC correct to $35k or continue bull run without steep corrections?
- Bitcoin price moves on Thursday triggering more than $200 million worth of liquidations in both directions.
- While some investors expect a correction to $35,000, others are anticipating a sustained run after a sweep of $40,000.
- On-chain metrics do not show alarming signs that hint at a sustained sell-off.

Bitcoin (BTC) price currently trades around $41,094 after dropping 4.60% on Thursday, putting an end to the $2,000 trading range. This move comes after Adam from GeeksLive noted that the volatility level of BTC dropped to a new low in a month. In addition to the significant Realized Volatility (RZ) declines, the short-term Implied Volatility (IV) plummeted below -45%.
The short-term impact of the ETF's passage is largely over. BTC's volatility level dropped to a new low in the past month, with both major terms RV and IV showing significant declines, and short-term IV plummeting to below 45%.
— Greeks.live (@GreeksLive) January 18, 2024
Judging from the current options market data,… pic.twitter.com/mwubxgjRe2
This drop in volatility is logical, considering that investors tend to speculate on the price action before ETF approval. After the watershed moment, many traders are likely to start winding up their positions and reallocating to newer and trending narratives.
While the short-term dip in volatility might be alarming, the start of the Chinese New Year in February and speculative trading could alleviate these concerns.
Regardless of what’s about to happen, the short-term correction in Bitcoin triggered marketwide liquidations worth more than $200 million, according to data from CoinGlass.

Total liquidation chart
Also read: SEC lives up to the expectations as it delays spot ETH ETF; Ethereum price makes no move
Bitcoin price squeezes on LTF
Bitcoin price is stuck trading at $41,094, roughly around the midpoint of the 2021 bear market crash of 77%. Admittedly, it explains the need for range tightening as investors are split into two camps:
- the ones expecting a pullback before the extension of the bull run.
- others waiting for a continuation of the ongoing uptrend.
Last week’s massive swing failure pattern seems to favor cohorts expecting a short-term correction. If it does, the ideal support levels include the $34,067 and $32,293 levels. These investors could be disappointed if BTC briefly dips below $40,000 and continues its ascent.
For the second scenario to unfold, BTC would have to continue its ascent from its current position. But this outlook is unlikely, and the pioneer crypto is likely to slide lower before resuming its uptrend.
An ideal scenario would occur this way:
Bitcoin price dips below the $40,000 psychological level, culling late bulls and attracting short-sellers.
A quick recovery above this key level could trap the greedy bears and is a classic manipulation price action that is often seen before the start of a new trend. This move would force short sellers to buy back their positions, adding upward pressure. Additionally, this is where sidelined smart money is likely to step in, kickstarting the uptrend.
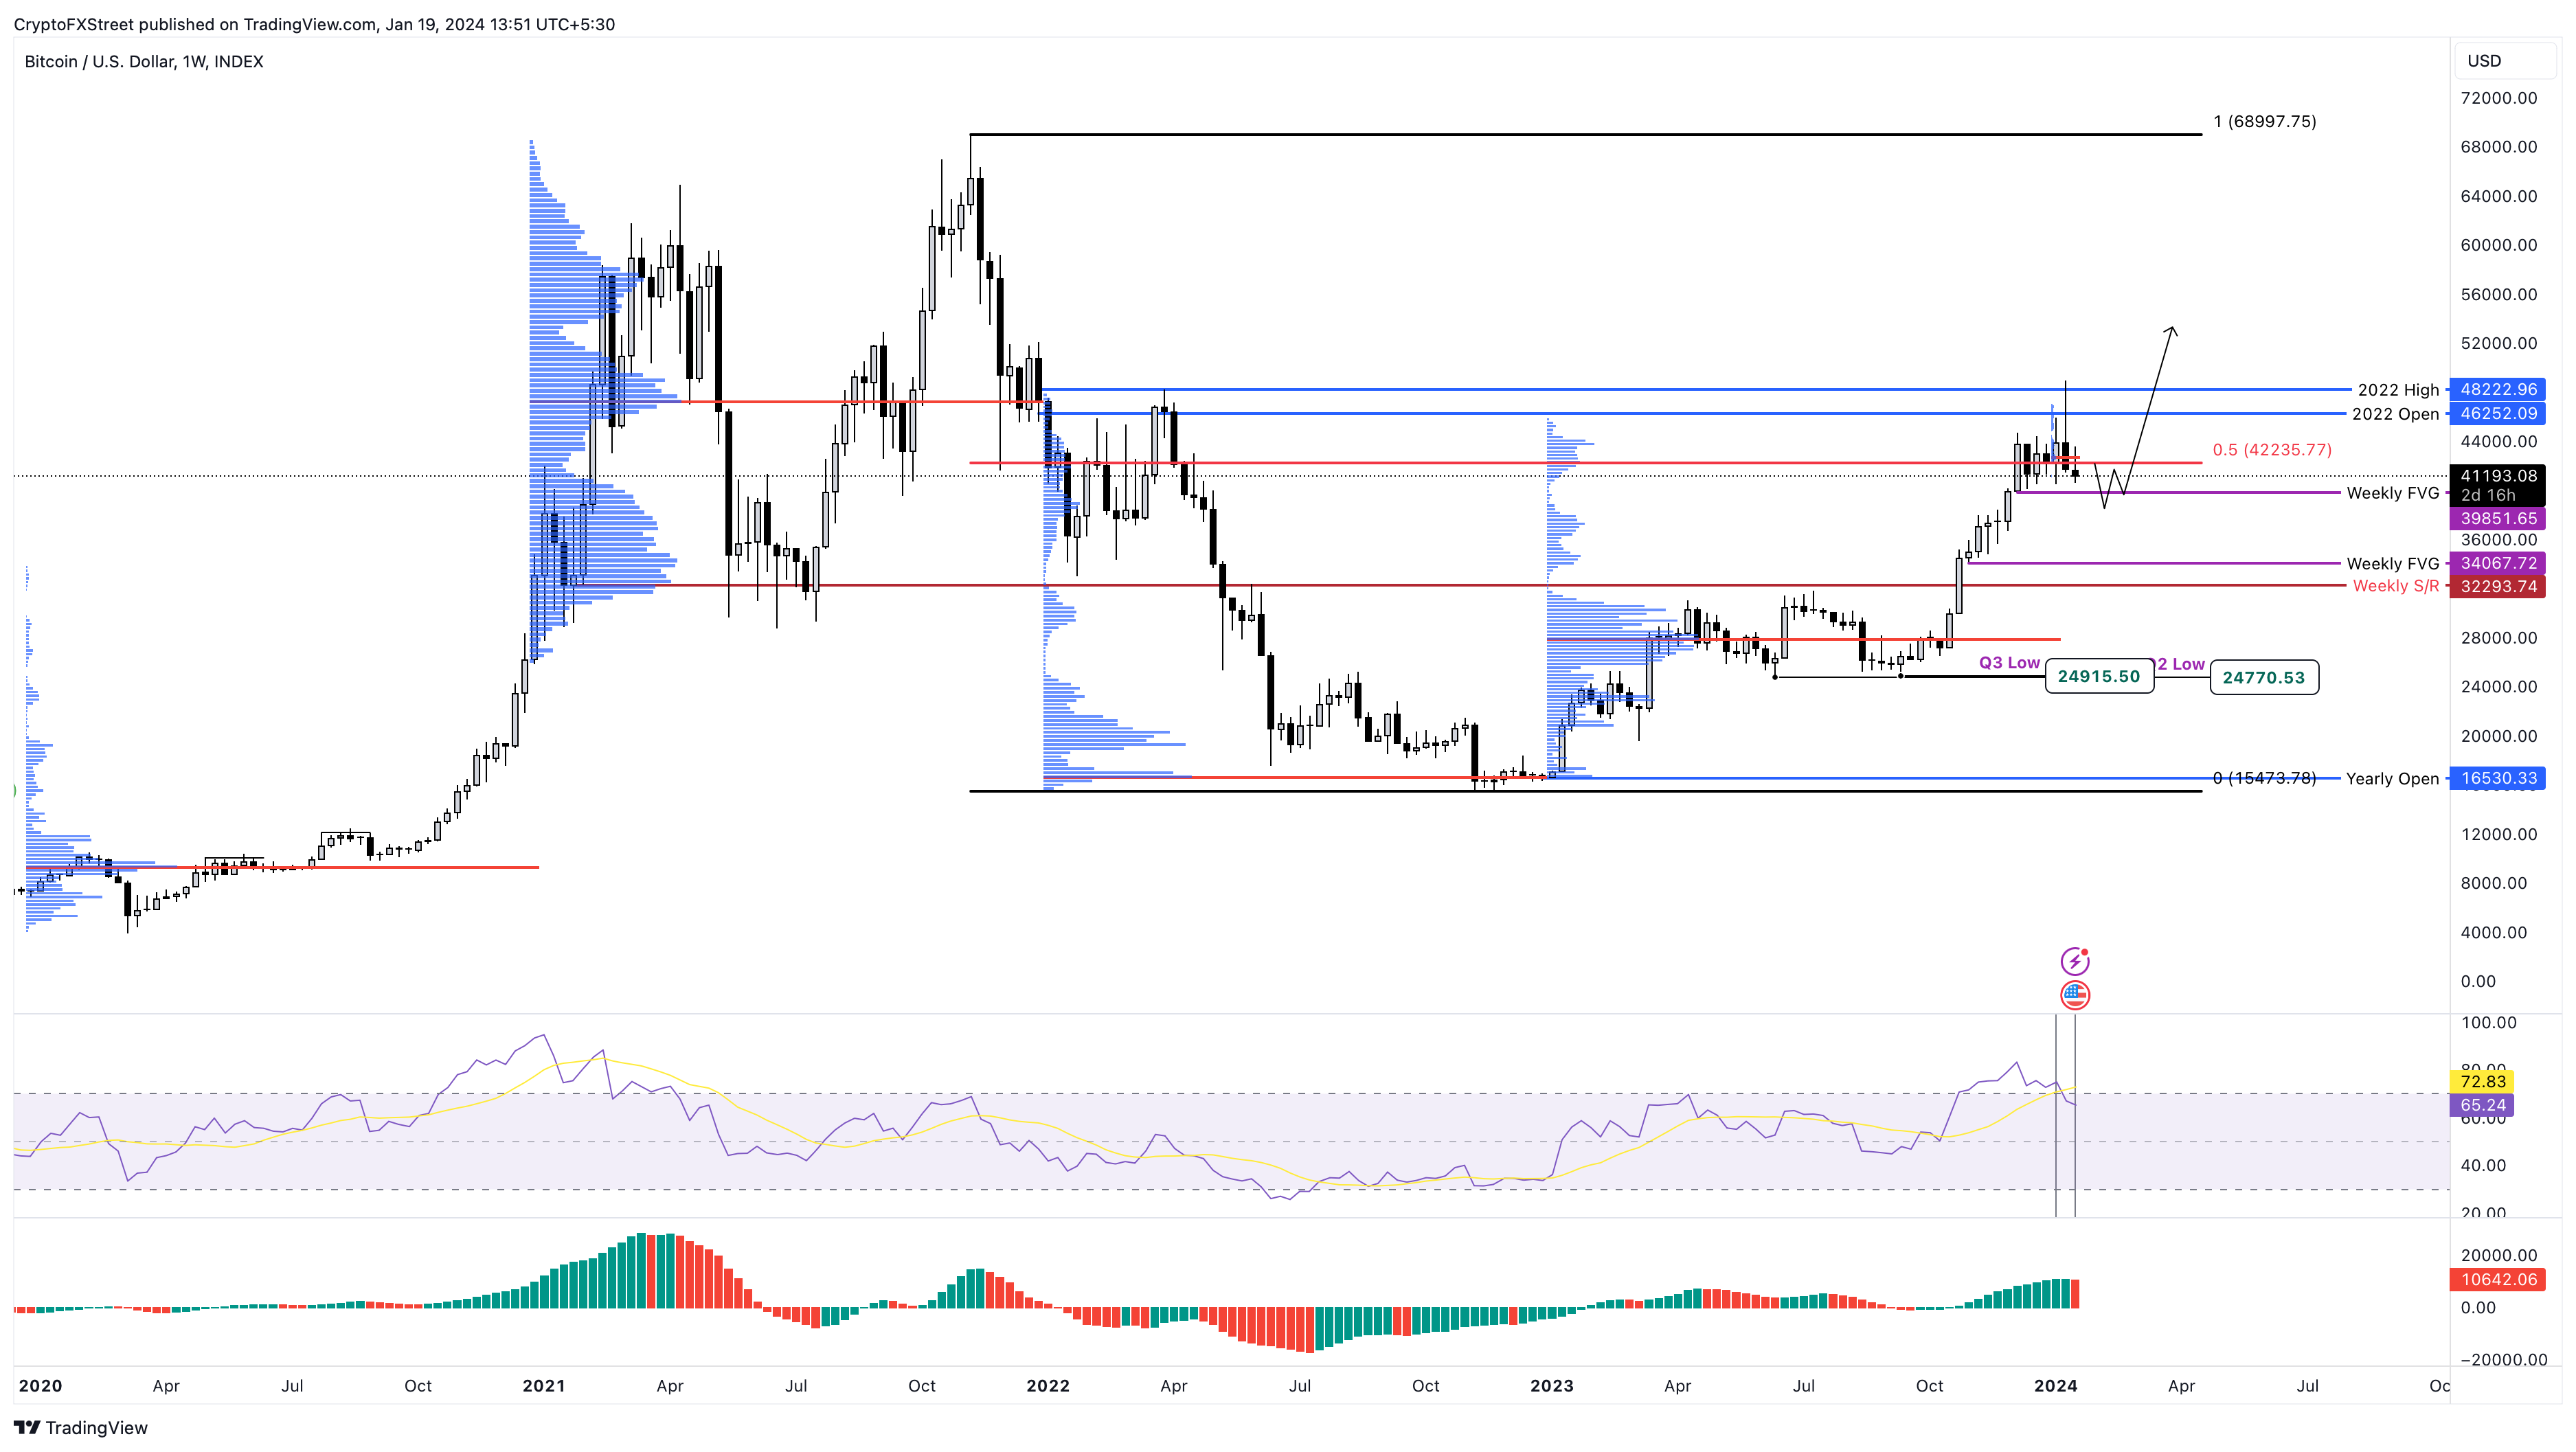
BTC/USDT 1-week chart
On-chain metrics support mild corrections
Santiment’s 365-day and 180-day Market Value to Realized Value (MVRV) ratio indicators give a good understanding of market participants’ health. This metric is used to track the average profit/loss of investors who purchased BTC over a specific time frame. In this case, 365-day and 180-day.
Currently, the 365-day MVRV hovers at 22.60% and the 180-day MVRV at 10.30%. It means that investors who purchased BTC 365 days ago have an average profit of 22.60%, and those who bought BTC 180 days ago are up 10.30%.
A high unrealized profit number would be a threat since the market could tank if these investors decide to realize their profits. But at the current levels, it is unlikely to trigger a massive selling spree.
Moreover, a quick look at July 2020 shows MVRV 365-day and 180-day retraced from 30% and 29% to 8.5% and 0.71% under two weeks. During this time, Bitcoin price dropped from $11,700 to $10,200, a mere 12% correction. But this short-term pullback was followed by a sustained ascent to new all-time highs in 2021.
 [10.53.27, 19 Jan, 2024]-638412493418052621.png)
BTC 365-day, 180-day MVRV
Despite the recent BTC transfers to the Coinbase exchange, which could have partially triggered Thursday’s drop, the supply on exchanges continues to plummet. Currently, the total supply on centralized platforms sits at 1.06 million, down 18% from the start of 2023.
The reduction in supply held on exchanges denotes that investors are confident in BTC’s performance, which means they’re not planning to sell their holdings anytime soon. Overall, this is a bullish mindset, which often happens during the bull run.
 [11.53.54, 19 Jan, 2024]-638412493662239125.png)
BTC supply on exchanges
On the other hand, a breakdown of the $35,000 support floor would be pessimistic for the crypto markets. This development would suggest that the Bitcoin spot ETF approval was a sell-the-news event that marked a local top for BTC at $48,975. In such a case, investors need to watch for a lower high to form below $49,975 for confirmation of a downtrend.
If BTC sets up a lower high, the price action would be reminiscent of the 2019 mini bull run, which formed a local top at $13,870, roughly at the 61.8% Fibonacci retracement level of the 2017 bull rally. As a result, investors can expect Bitcoin price to follow the 2019 trend and correct to the $34,067 to $32,293 support floors.
In a dire case scenario, Bitcoin price could revisit 2023’s highest traded volume at $27,774, which is roughly 13% from the $32,293 barrier.
Author

Akash Girimath
FXStreet
Akash Girimath is a Mechanical Engineer interested in the chaos of the financial markets. Trying to make sense of this convoluted yet fascinating space, he switched his engineering job to become a crypto reporter and analyst.


