Bitcoin Weekly Forecast: Why a $28,000 BTC makes more sense now?
- Bitcoin price triggers a bullish breakout after developing a bullish divergence the past month ago.
- On-chain metrics and technicals point to a potential Q4 rally that could push BTC to $28,000 and higher.
- This optimistic outlook will be invalidated if BTC shatters the $18,981 support level on a weekly chart.

Bitcoin price is reacting well to the bullish developments that have been taking place over the last month or so. A recent breakout could be the start of a prolonged move up when looked at via the lens of Bitcoin’s historical performance in Q4s stretching over the last decade.
Attached below is a table showing that the average return of Bitcoin price in different quarters since 2009. The average return in Q4 is 27%, which is the highest after Q2’s 21%.
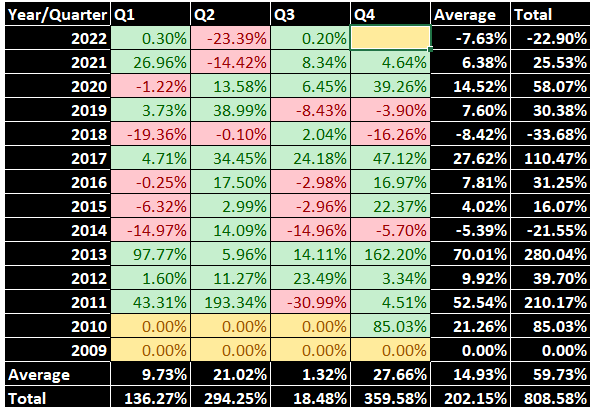
BTC's historical quarterly performance
Whilst historical performance is not a surefire way of predicting the future it is possible that if the cycle repeats in 2022, investors could see an explosive move north over the next two months.
Bitcoin price hints at a continuation of bullish outlook
Bitcoin price saw a bullish divergence on the three-day chart that developed between June 30 and October 25. This technical formation happens when price declines are not reflected in similar falls in the Relative Strength Index (RSI), a popular momentum indicator. Such non-confirmation by RSI is usually a sign of weakening bearish momentum and can be indicative of the approach of a market reversal. Bitcoin price eventually saw a massive breakout on October 25, resulting in a 9% upswing in roughly 24 hours. Following this, BTC price underwent a minor pullback to support levels at $19,850 or $19,650 which could turn out to be key accumulation zones for the next leg higher, that could propel BTC to the $25,000 psychological level.
The $25,000 hurdle is the midpoint of the 45% move that occurred between May and June and is a pivotal point in BTC’s journey. Flipping this resistance level into a support floor will indicate a bullish resurgence and propel Bitcoin price to the next significant area, extending between $28,000 and $29,000.
As mentioned in previous articles, these levels are where the Chicago Mercantile Exchange’s (CME) Bitcoin chart has gaps in price action since the platform remains closed at weekends. Historically, the big crypto moves in such a way that it rebalances these inefficiencies, making the area between $28,000 and $29,000 a good place to book profits.
In a wildcard scenario, this Bitcoin price rally could extend to the $30,000 psychological level, bringing the total gain to 51%.
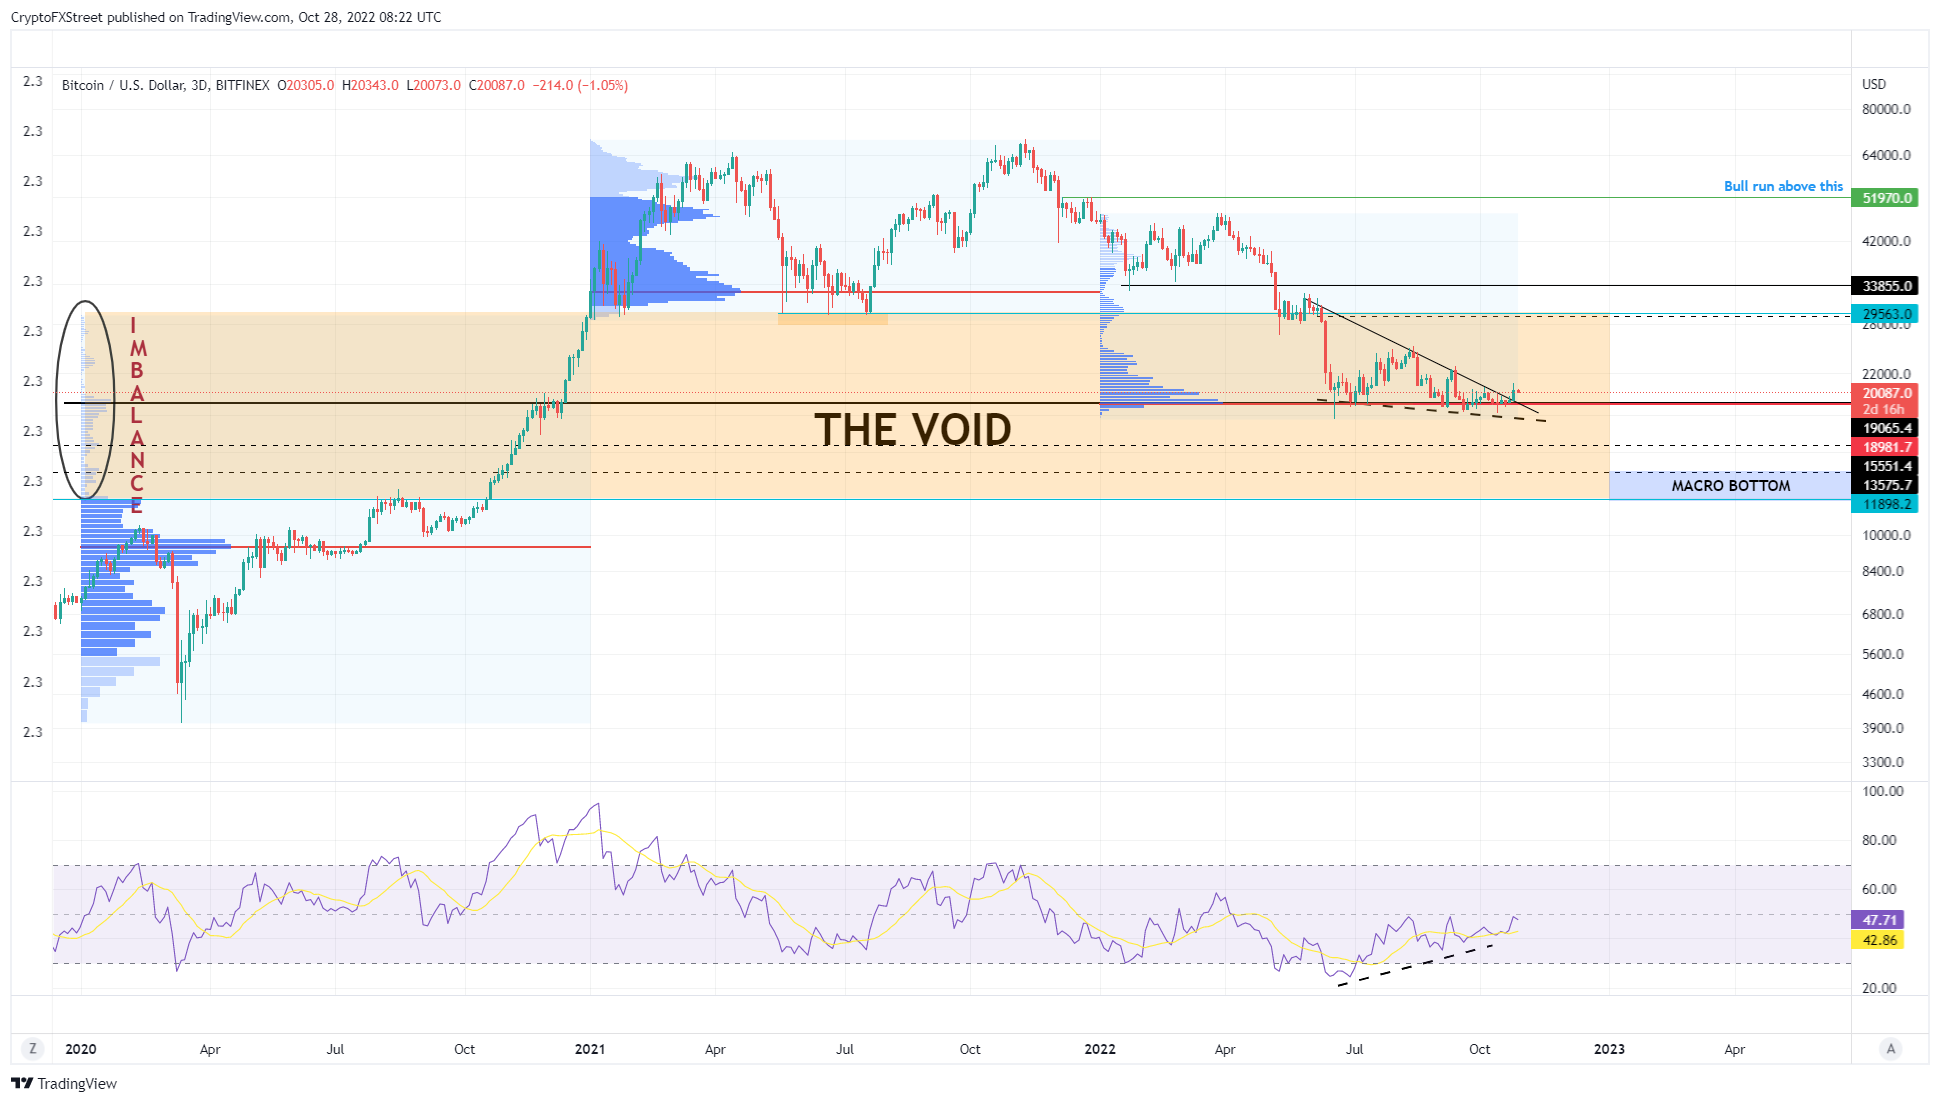
BTC/USDT 3-day chart
Although this outlook might at first seem overly bullish, the Supply on Exchanges on-chain metric is reassuring to buyers. The metric works in a contrarian fashion with a fall in supply indicating bullishness and a rise: bearishness. This is explained by the fact that investors tend to move their Bitcoins from more secure wallets to exchanges as a first step before liquidating them. From June 13 to October 27, the supply of BTC on exchanges dropped from 1.92 million to 1.6 million.
This 16% decline indicates investor confidence and suggests that fewer holders are looking to sell their holdings, which is a bullish development.
 [14.24.58, 28 Oct, 2022]-638025497180267236.png)
BTC Supply held on exchanges
Accumulating opportunities on lower time frames
The 9% upswing Bitcoin price witnessed this week was impressive, but it is unsustainable from a lower time frame perspective. The Short Term Holder Spent Output Ration or STH-SOPR indicator is used to determine if investors are selling their holdings at profit, loss or break-even.
If the STH-SOPR is greater than 1, then the short-term holders are selling at a profit, which denotes an increase in selling pressure and could trigger a bearish reversal.
Currently, this on-chain indicator is hovering above 1, hinting at a potential for a pullback.
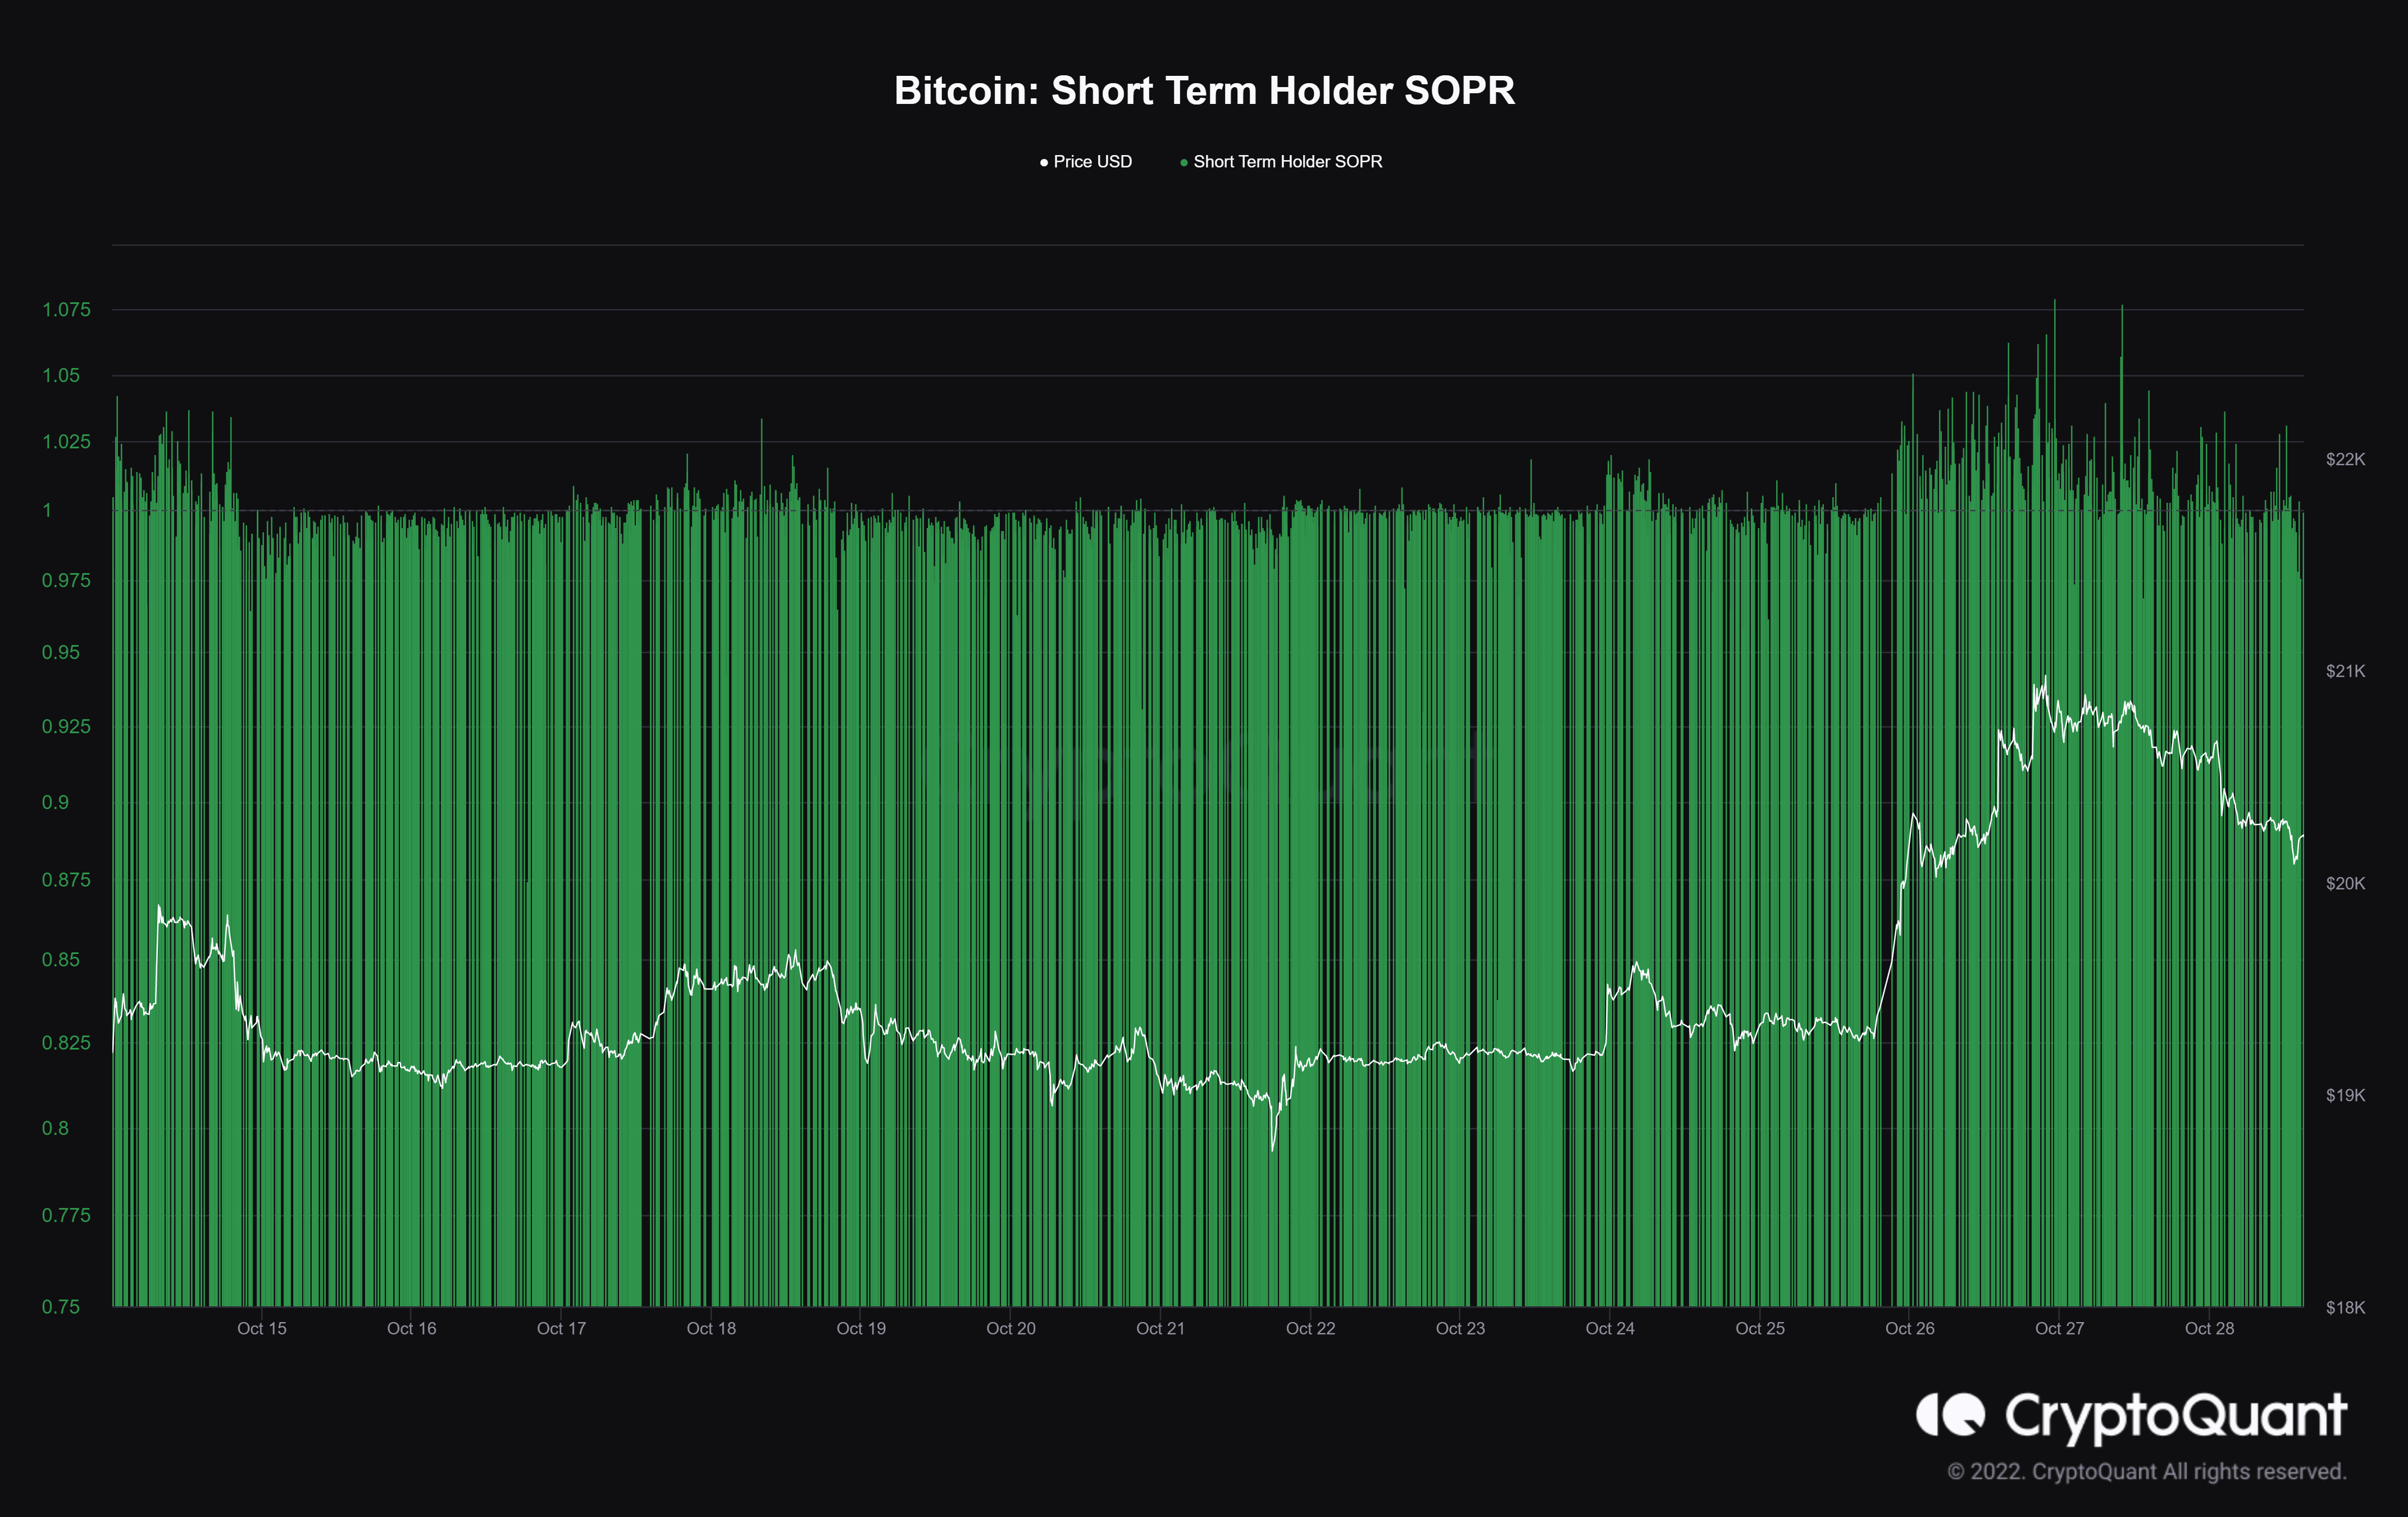
BTC STH-SOPR
On the one-day chart, the potential levels where Bitcoin price could retest include the 50-day and 30-day Exponential Moving Averages (EMAs) at $19,847 and $19.640, respectively.
Therefore, accumulating at these levels could yield maximum gains if BTC eventually reaches its destination of $30,000.
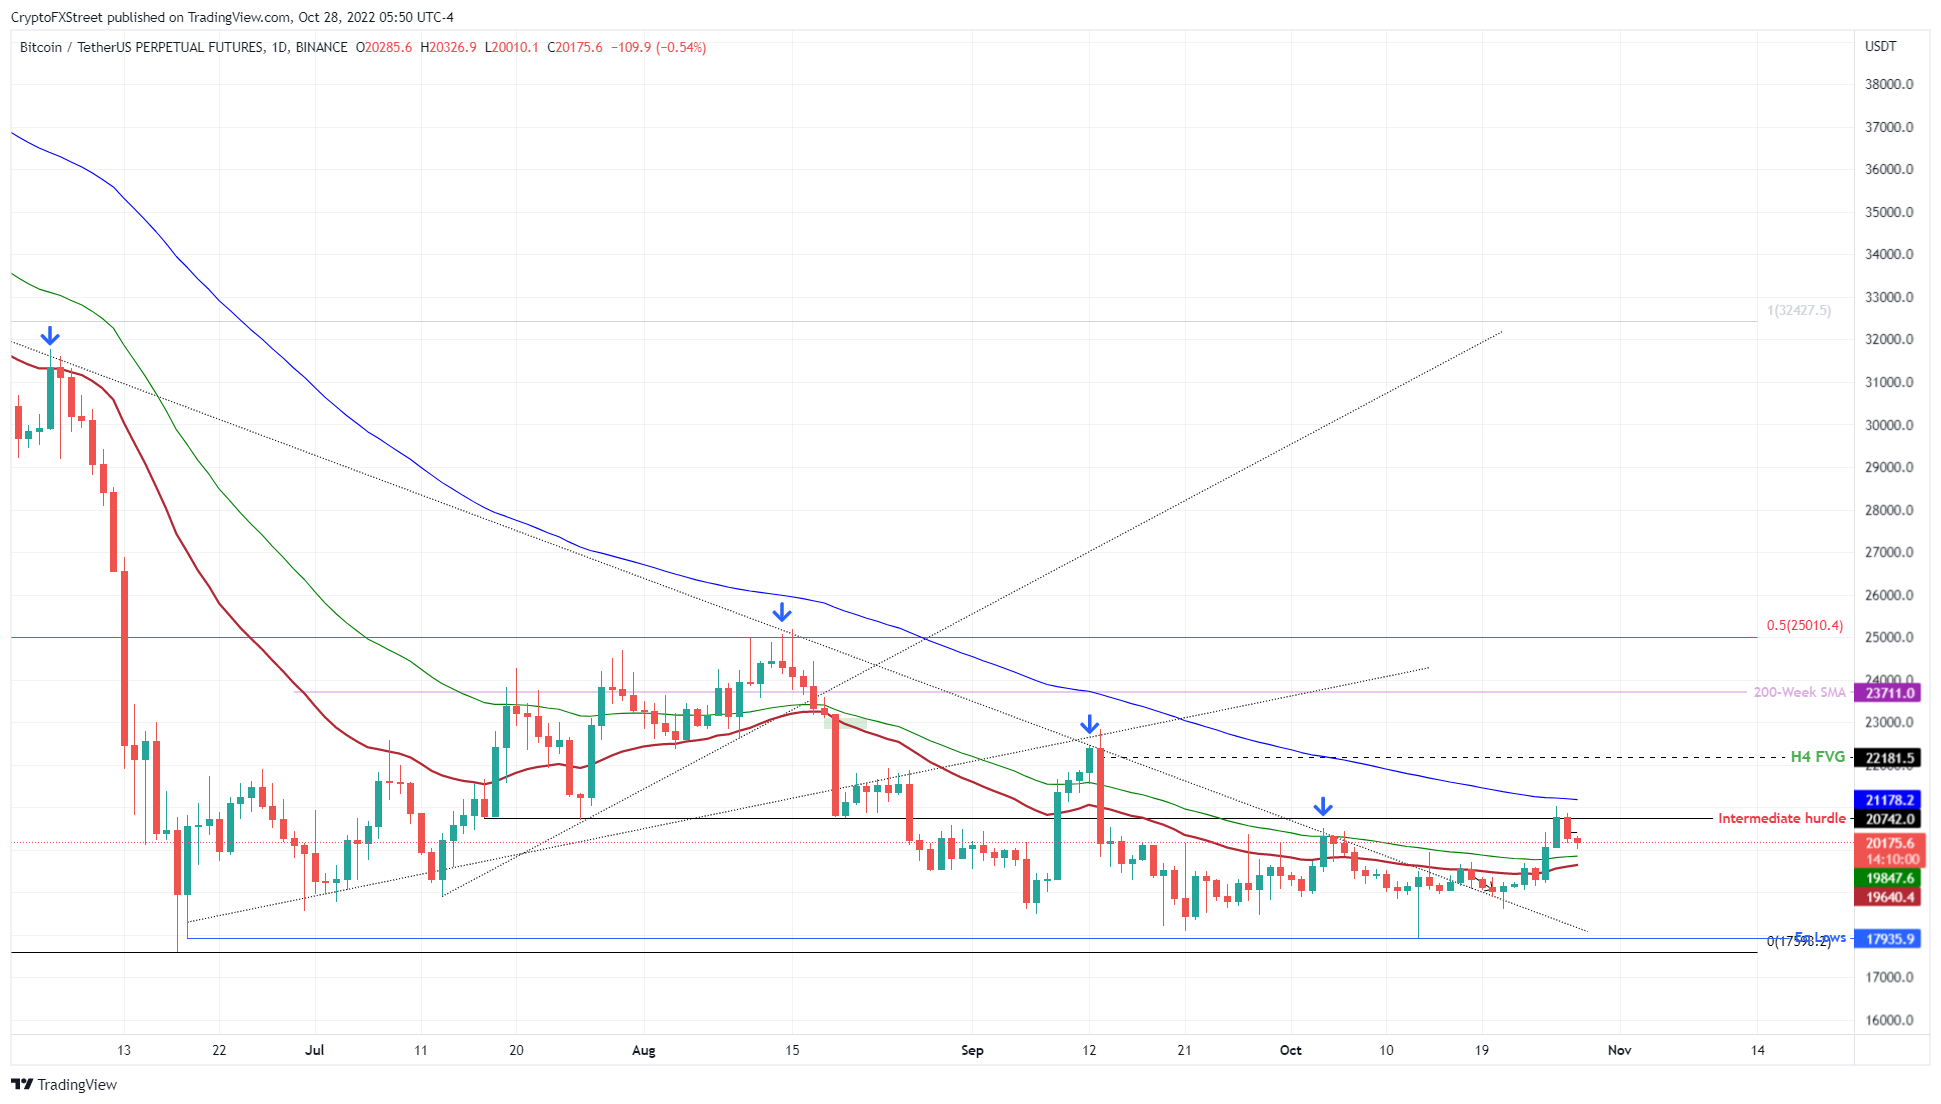
BTCUSD 1-day chart
While things are looking up for Bitcoin price, a breakdown of the point of control, aka the highest volume traded level for 2022 at $18,981, would invalidate the bullish thesis for BTC. This development could trigger a further crash that could knock the big crypto down to sweep the June 18 swing low at $17,593.
Here, buyers have another chance to step in, however, accumulate BTC and potentially kick-start a recovery.
Author

Akash Girimath
FXStreet
Akash Girimath is a Mechanical Engineer interested in the chaos of the financial markets. Trying to make sense of this convoluted yet fascinating space, he switched his engineering job to become a crypto reporter and analyst.


