- Bitcoin price seems to be holding up its bullish narrative despite the recent 6.5% sell-off.
- The sudden downswing pushed $65 million worth of both long and short positions to be liquidated.
- The bullish outlook could face extinction if BTC flips the $21,626 support level into a resistance barrier.
Bitcoin (BTC) price edges closer to the lower limit of its bullish structure after Thursday’s market sell-off. This move has also caused many altcoin traders to be caught off guard leading to $65 million in liquidations. Regardless, this is a time for investors to exercise caution as BTC scrambles to find its footing.
Also read: Bitcoin long liquidations hit highest level since August
Bitcoin price plays the silent game
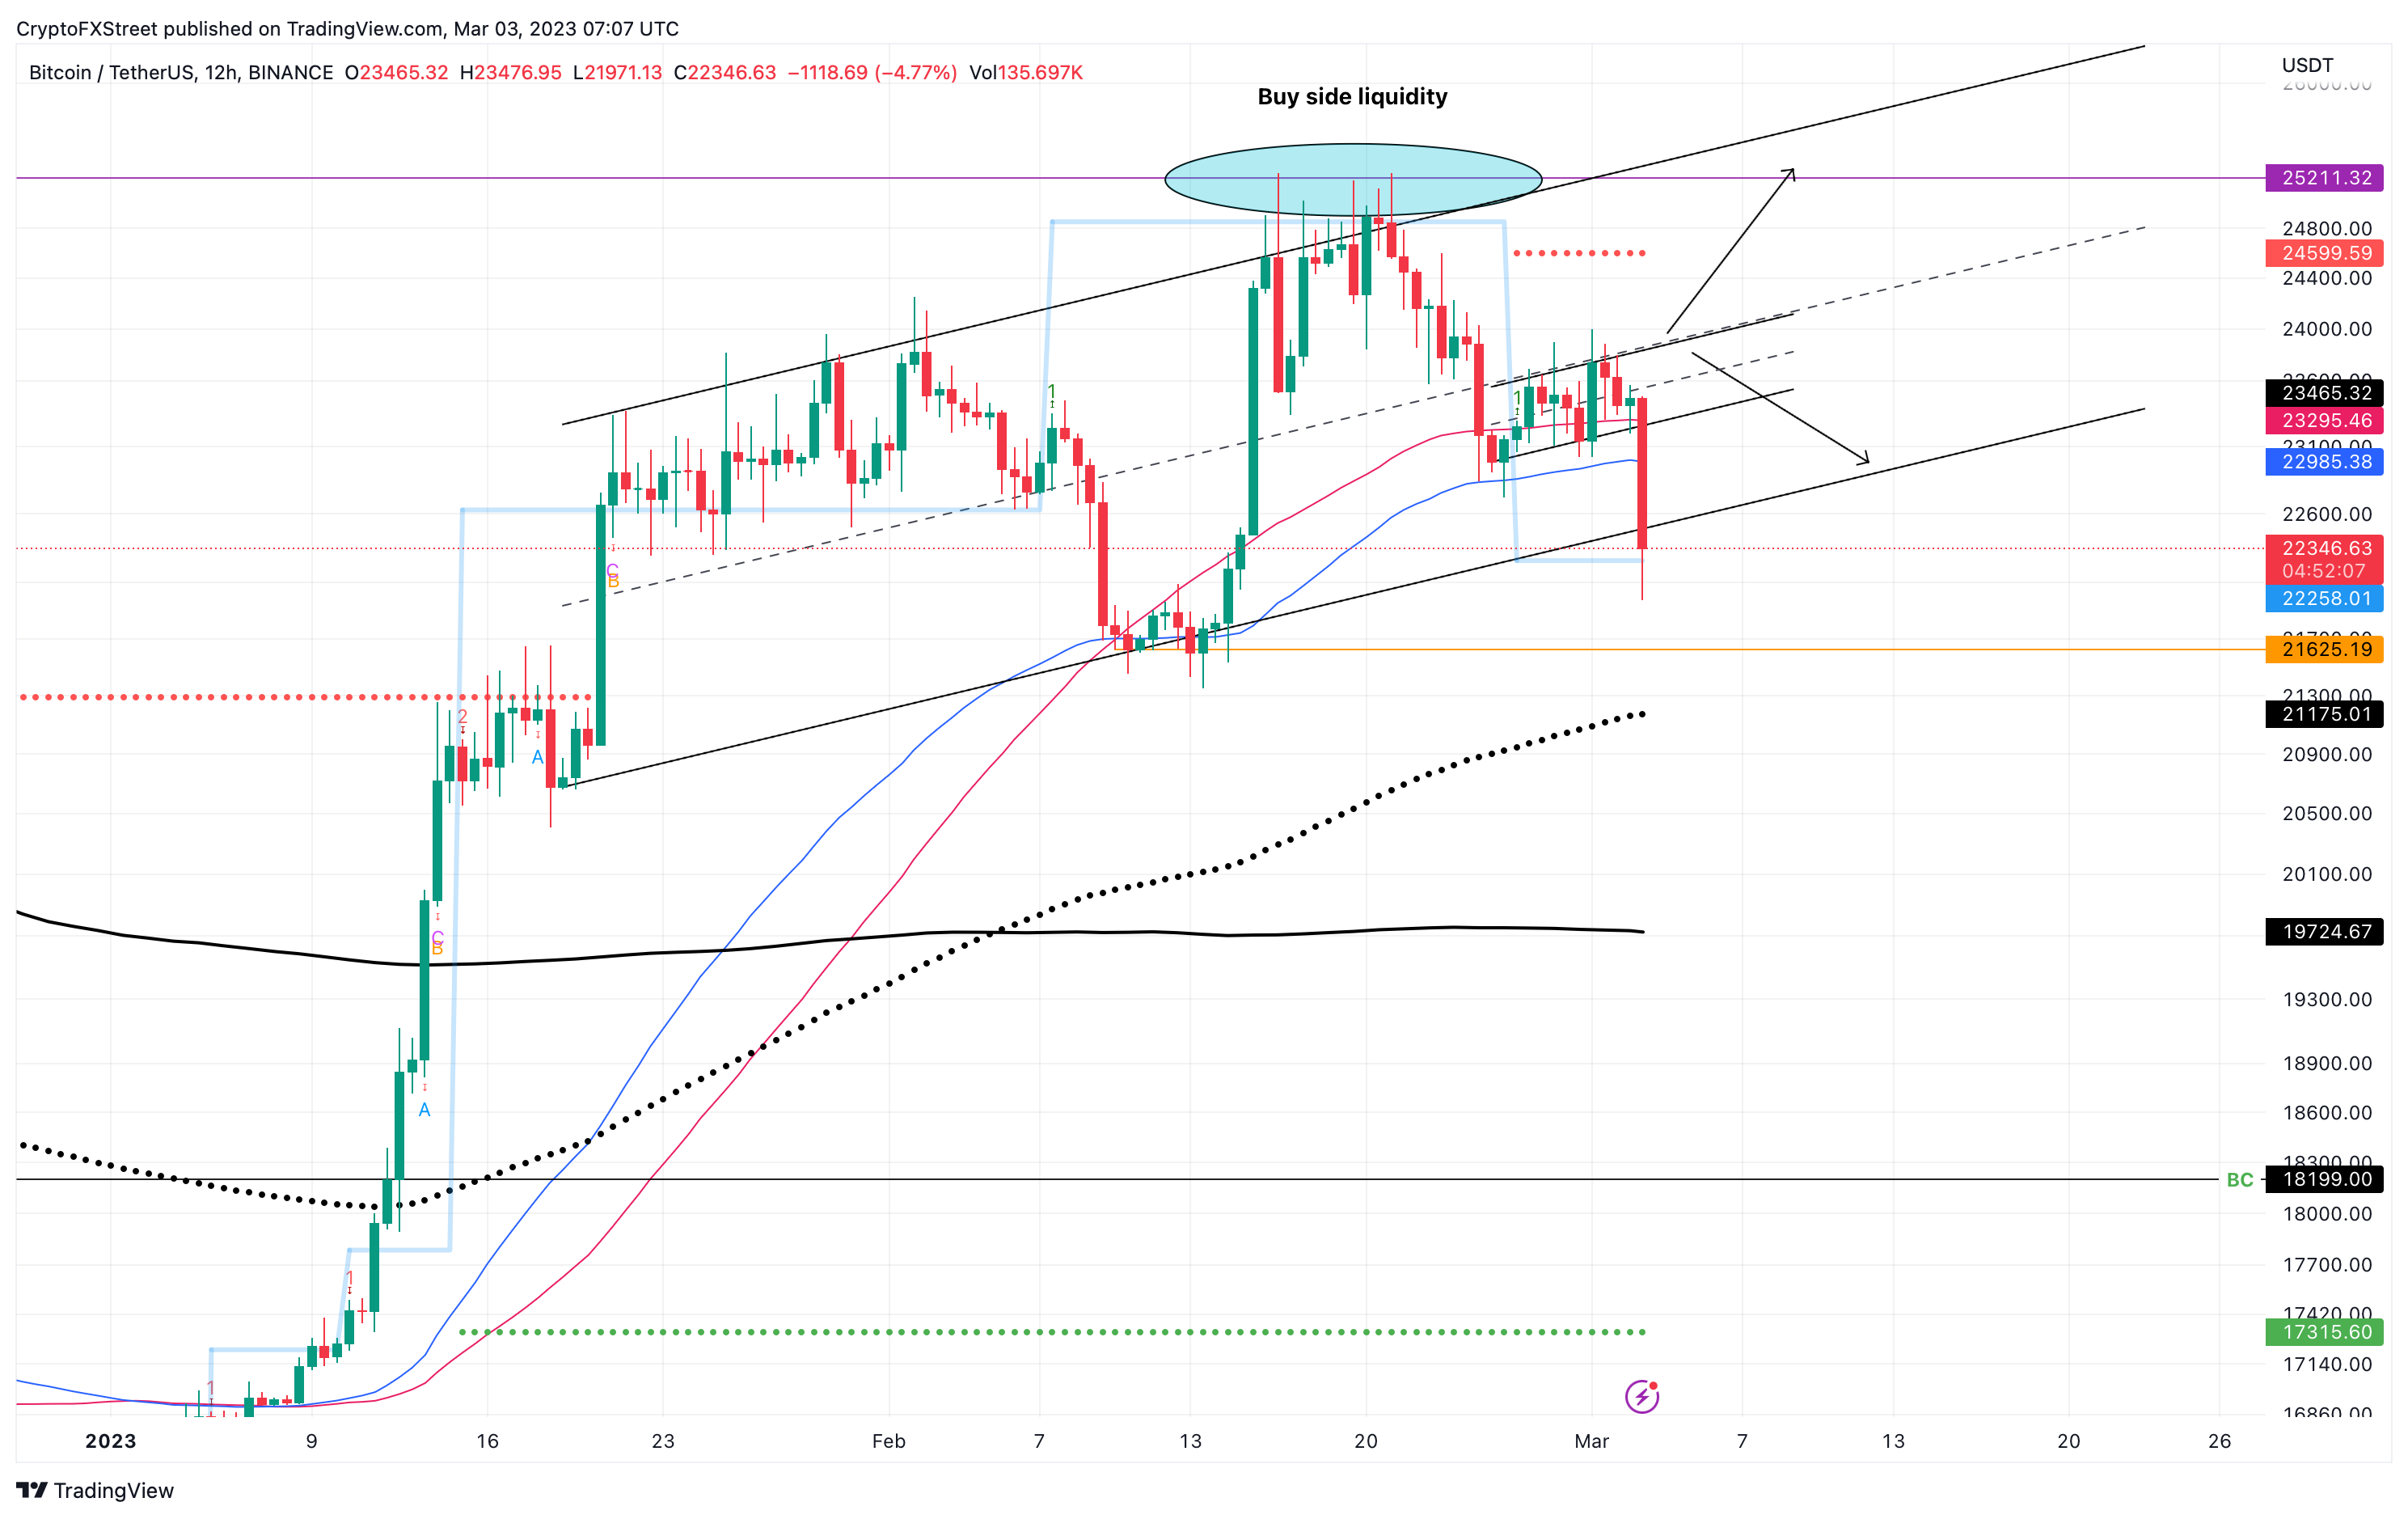
Bitcoin price has set up five higher highs and two higher lows in its pursuit of tagging and overcoming the $25,000 psychological level. Connecting trend lines across these swing points reveals an ascending parallel channel.
Thursday’s descent caused Bitcoin price to slice through the 200 four-hour Simple and Exponential Moving Averages (SMA, EMA) and is currently bouncing off the Momentum Reversal Indicator’s (MRI) breakout line at $22,258.
This breakout line is key in determining the next move for Bitcoin price.
From a technical point of view, a breakdown of the $21,265 support level will create a lower low. Such a development will not only trigger an influx of selling pressure from sidelined investors but it will also invalidate the bullish outlook.
The combined selling pressure will most likely shatter through the 200-day EMA at $21,175 and tag the 200-day SMA at $19,724.
BTC/USDT 1-day chart
An interesting detail about the aforementioned levels is that they coincide with the gaps formed in the Bitcoin price action seen in the Chicago Mercantile Exchange (CME). CME only allows BTC trading on weekdays, so the chart has gaps over the weekends. Chart experts have found that gaps are almost always eventually filled. This suggests an increased chance BTC price will fall down to the level of the CME gap and fill it.
If Bitcoin price were to break its ongoing bullish structure and flip the $21,625 support level into a resistance barrier, the next significant zone would be the immediate CME gap, extending from $19,995 to $20.460, coinciding with the 200-day SMA.
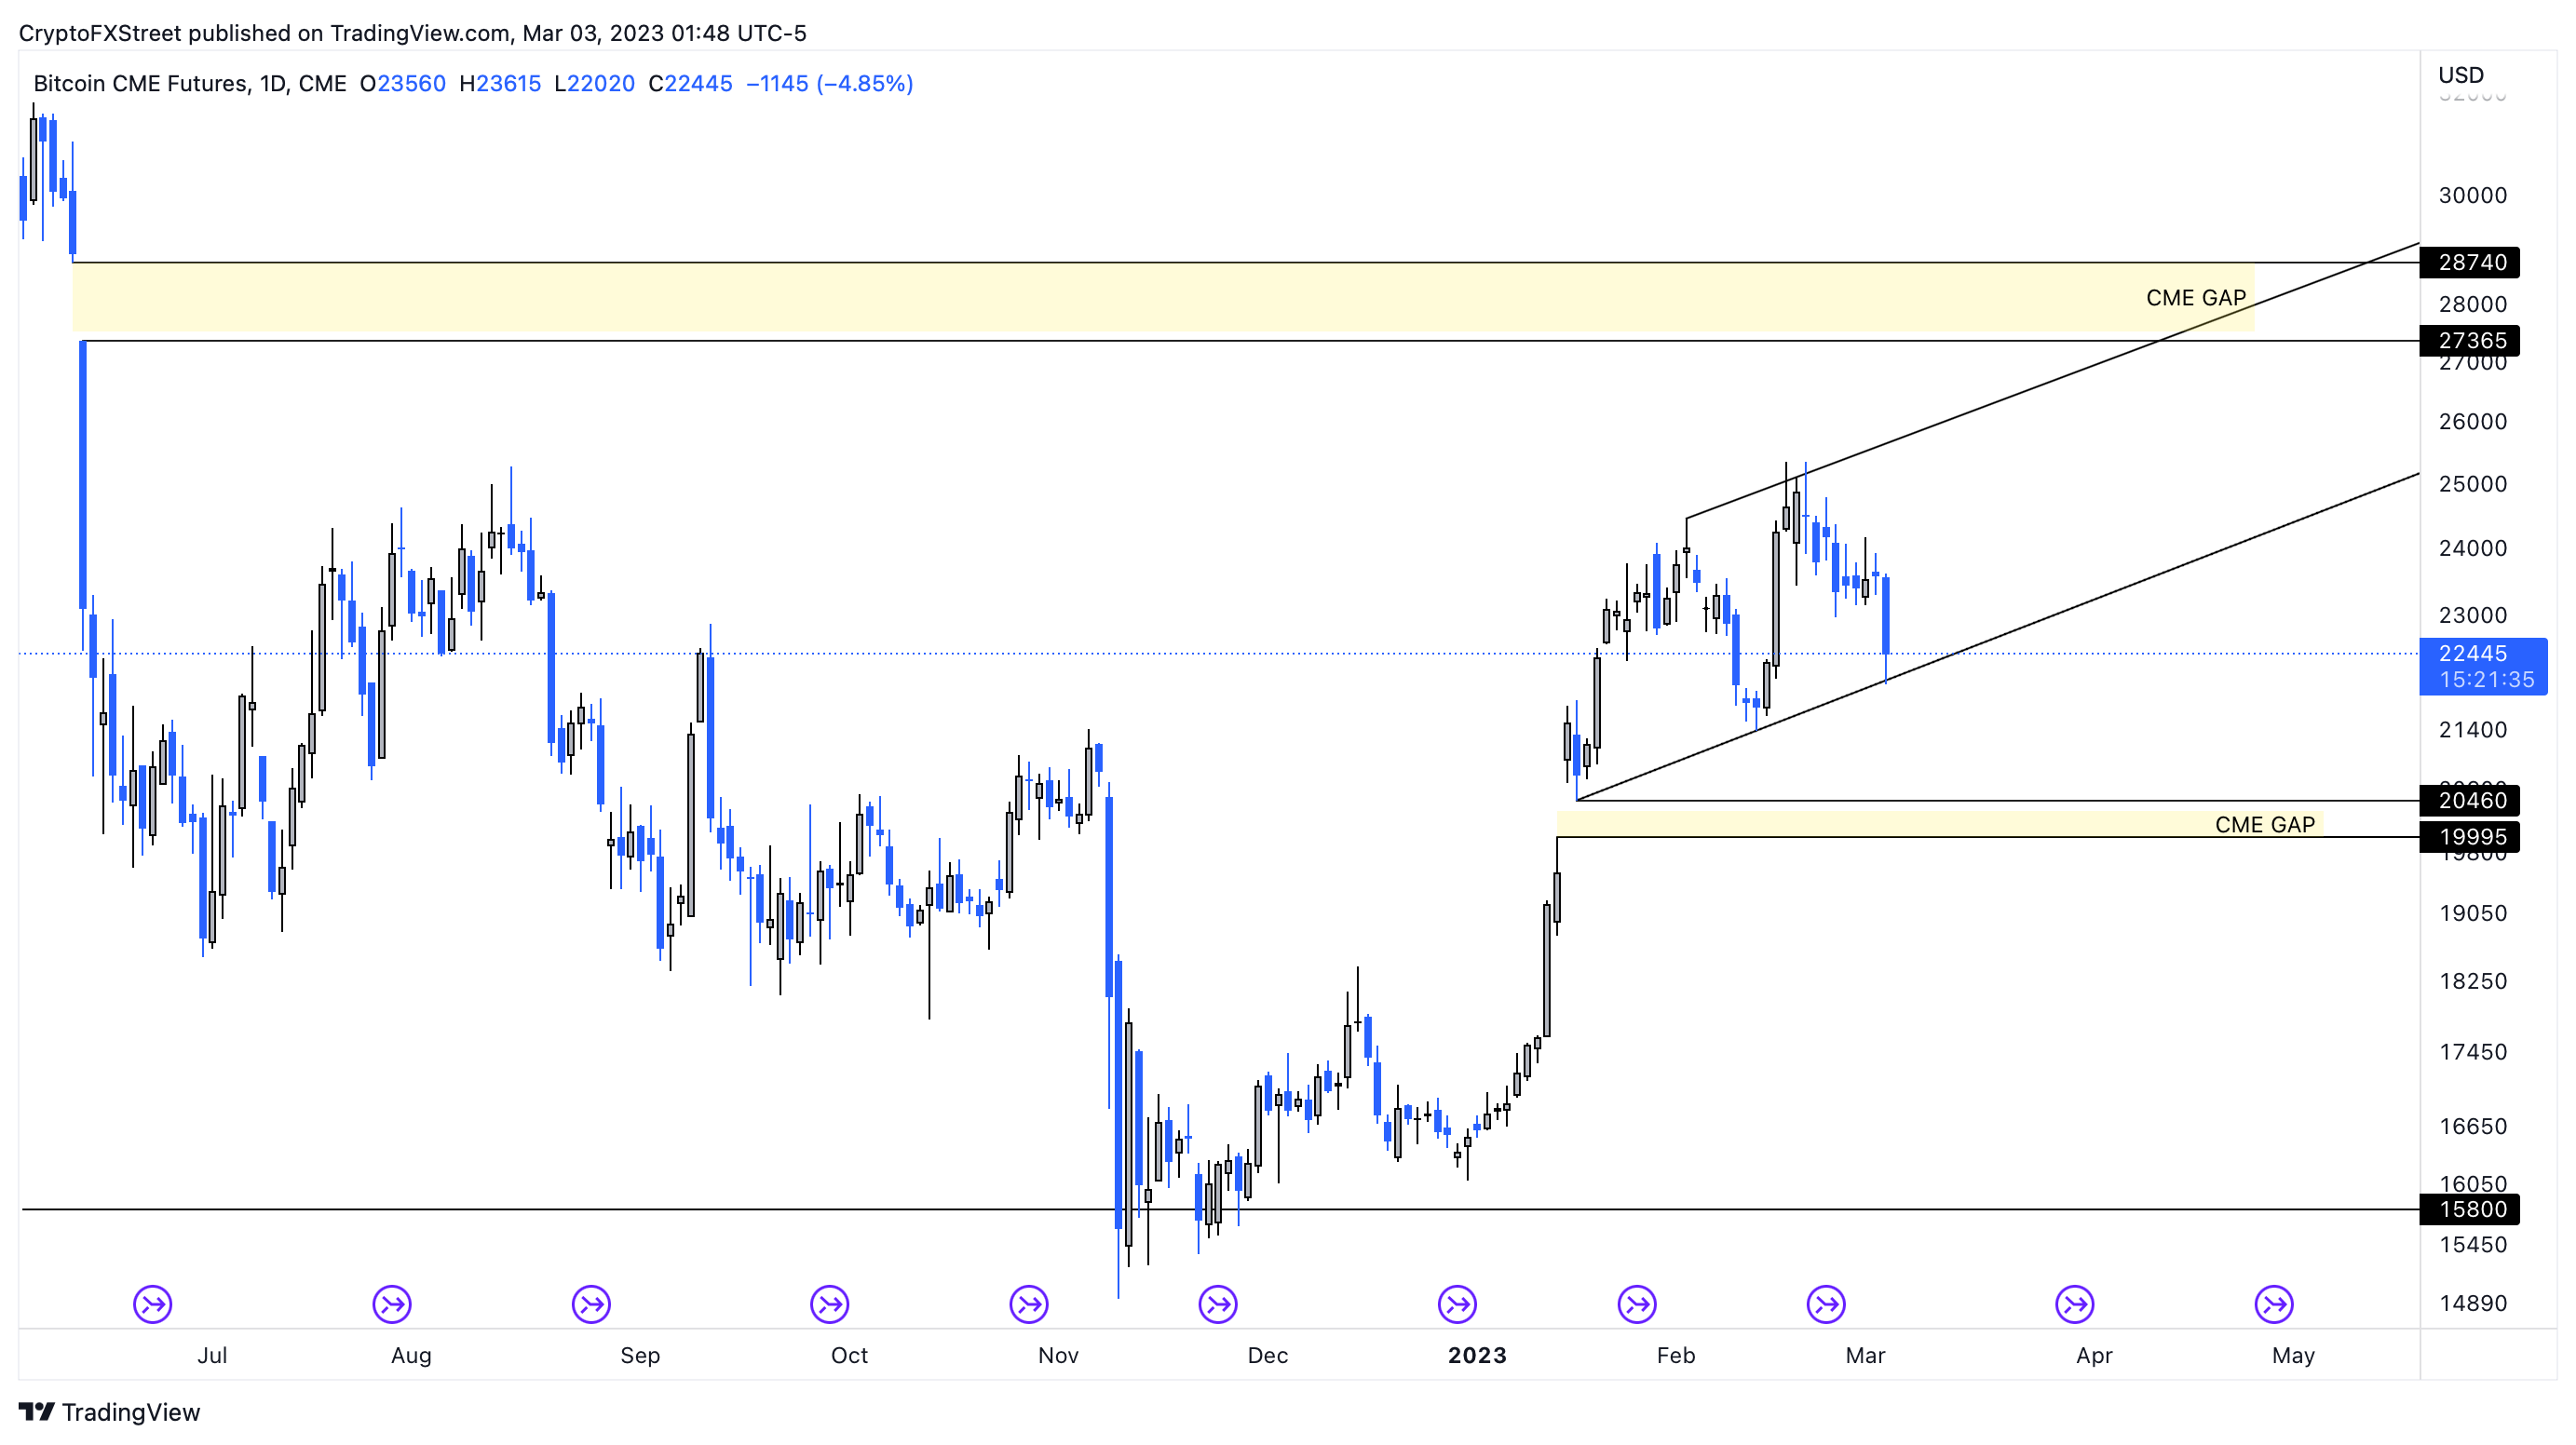
BTC 1-day CME chart
A break in correlation with the stock market?
To a certain degree the Bitcoin price is correlated with the stock market as both are impacted by the cost of money and the value of the US Dollar, both of which are linked to policies enacted by the Federal Reserve.
When there is a disconnect between stock prices and BTC as happened during BTC’s recent sell-off, therefore, it is the exception to the rule.
The chart attached below shows that BTC’s recent decline was an isolated event. BTC and ETH turned down sharply while the S&P 500 saw an uptick. Gold price, meanwhile, remained unaffected.
It is too early to determine if this disconnect is short-term or if it will persist over the longer term.
 [11.14.32, 03 Mar, 2023]-638134283180674854.png)
BTC vs. ETH vs. Gold vs. S&P500 chart
Traders should probably adopt a “look before you leap” philosophy in regards to the current decline in BTC price, rather than simply jumping on the bandwagon.
After a sudden move like this, the market needs time to consolidate before it reveals its next hand. Until then investors should remain cautious.
If the $21,625 support level or the bullish structure sustains, and sidelined buyers come to Bitcoin’s rescue, investors can expect BTC price to attempt a recovery. In such a case, the $23,747 will be a tough level to overcome.
Successfully doing so would open the path to collect the buy-side liquidity resting above the equal highs formed at $25,211. A flip of this level on a weekly timeframe will invalidate the bearish outlook and potentially trigger a run-up to the $30,000 psychological level.
Information on these pages contains forward-looking statements that involve risks and uncertainties. Markets and instruments profiled on this page are for informational purposes only and should not in any way come across as a recommendation to buy or sell in these assets. You should do your own thorough research before making any investment decisions. FXStreet does not in any way guarantee that this information is free from mistakes, errors, or material misstatements. It also does not guarantee that this information is of a timely nature. Investing in Open Markets involves a great deal of risk, including the loss of all or a portion of your investment, as well as emotional distress. All risks, losses and costs associated with investing, including total loss of principal, are your responsibility. The views and opinions expressed in this article are those of the authors and do not necessarily reflect the official policy or position of FXStreet nor its advertisers. The author will not be held responsible for information that is found at the end of links posted on this page.
If not otherwise explicitly mentioned in the body of the article, at the time of writing, the author has no position in any stock mentioned in this article and no business relationship with any company mentioned. The author has not received compensation for writing this article, other than from FXStreet.
FXStreet and the author do not provide personalized recommendations. The author makes no representations as to the accuracy, completeness, or suitability of this information. FXStreet and the author will not be liable for any errors, omissions or any losses, injuries or damages arising from this information and its display or use. Errors and omissions excepted.
The author and FXStreet are not registered investment advisors and nothing in this article is intended to be investment advice.
Recommended Content
Editors’ Picks

Bitcoin Weekly Forecast: BTC nosedives below $95,000 as spot ETFs record highest daily outflow since launch
Bitcoin price continues to edge down, trading below $95,000 on Friday after declining more than 9% this week. Bitcoin US spot ETFs recorded the highest single-day outflow on Thursday since their launch in January.

Bitcoin crashes to $96,000, altcoins bleed: Top trades for sidelined buyers
Bitcoin (BTC) slipped under the $100,000 milestone and touched the $96,000 level briefly on Friday, a sharp decline that has also hit hard prices of other altcoins and particularly meme coins.

Solana Price Forecast: SOL’s technical outlook and on-chain metrics hint at a double-digit correction
Solana (SOL) price trades in red below $194 on Friday after declining more than 13% this week. The recent downturn has led to $38 million in total liquidations, with over $33 million coming from long positions.

SEC approves Hashdex and Franklin Templeton's combined Bitcoin and Ethereum crypto index ETFs
The SEC approved Hashdex's proposal for a crypto index ETF. The ETF currently features Bitcoin and Ethereum, with possible additions in the future. The agency also approved Franklin Templeton's amendment to its Cboe BZX for a crypto index ETF.

Bitcoin: 2025 outlook brightens on expectations of US pro-crypto policy
Bitcoin (BTC) price has surged more than 140% in 2024, reaching the $100K milestone in early December. The rally was driven by the launch of Bitcoin Spot Exchange Traded Funds (ETFs) in January and the reduced supply following the fourth halving event in April.

Best Forex Brokers with Low Spreads
VERIFIED Low spreads are crucial for reducing trading costs. Explore top Forex brokers offering competitive spreads and high leverage. Compare options for EUR/USD, GBP/USD, USD/JPY, and Gold.