Bitcoin Weekly Forecast: Three key BTC accumulation levels before ETF approval in January 2024
- Bitcoin price sell signals on the daily time frame persist.
- A correction could send BTC 10% to 15% lower to $33,000 and $35,000 levels.
- Invalidation of the bearish thesis will occur if BTC flips the $40,100 hurdle into a support floor.
Bitcoin (BTC) price, from a high time-frame perspective, has been in an up-only trend since the start of 2023. BTC has ignored many sell signals due to the likelihood of an Exchange-Traded Fund (ETF) approval. With the holidays around the corner, falling liquidity could see BTC discounted from its current level, hovering around the $37,000 region, where it has been for roughly two weeks.
Read more: Binance’s settlement with US authorities is positive for crypto as well as the exchange: JPMorgan
Bitcoin sells signals and discount
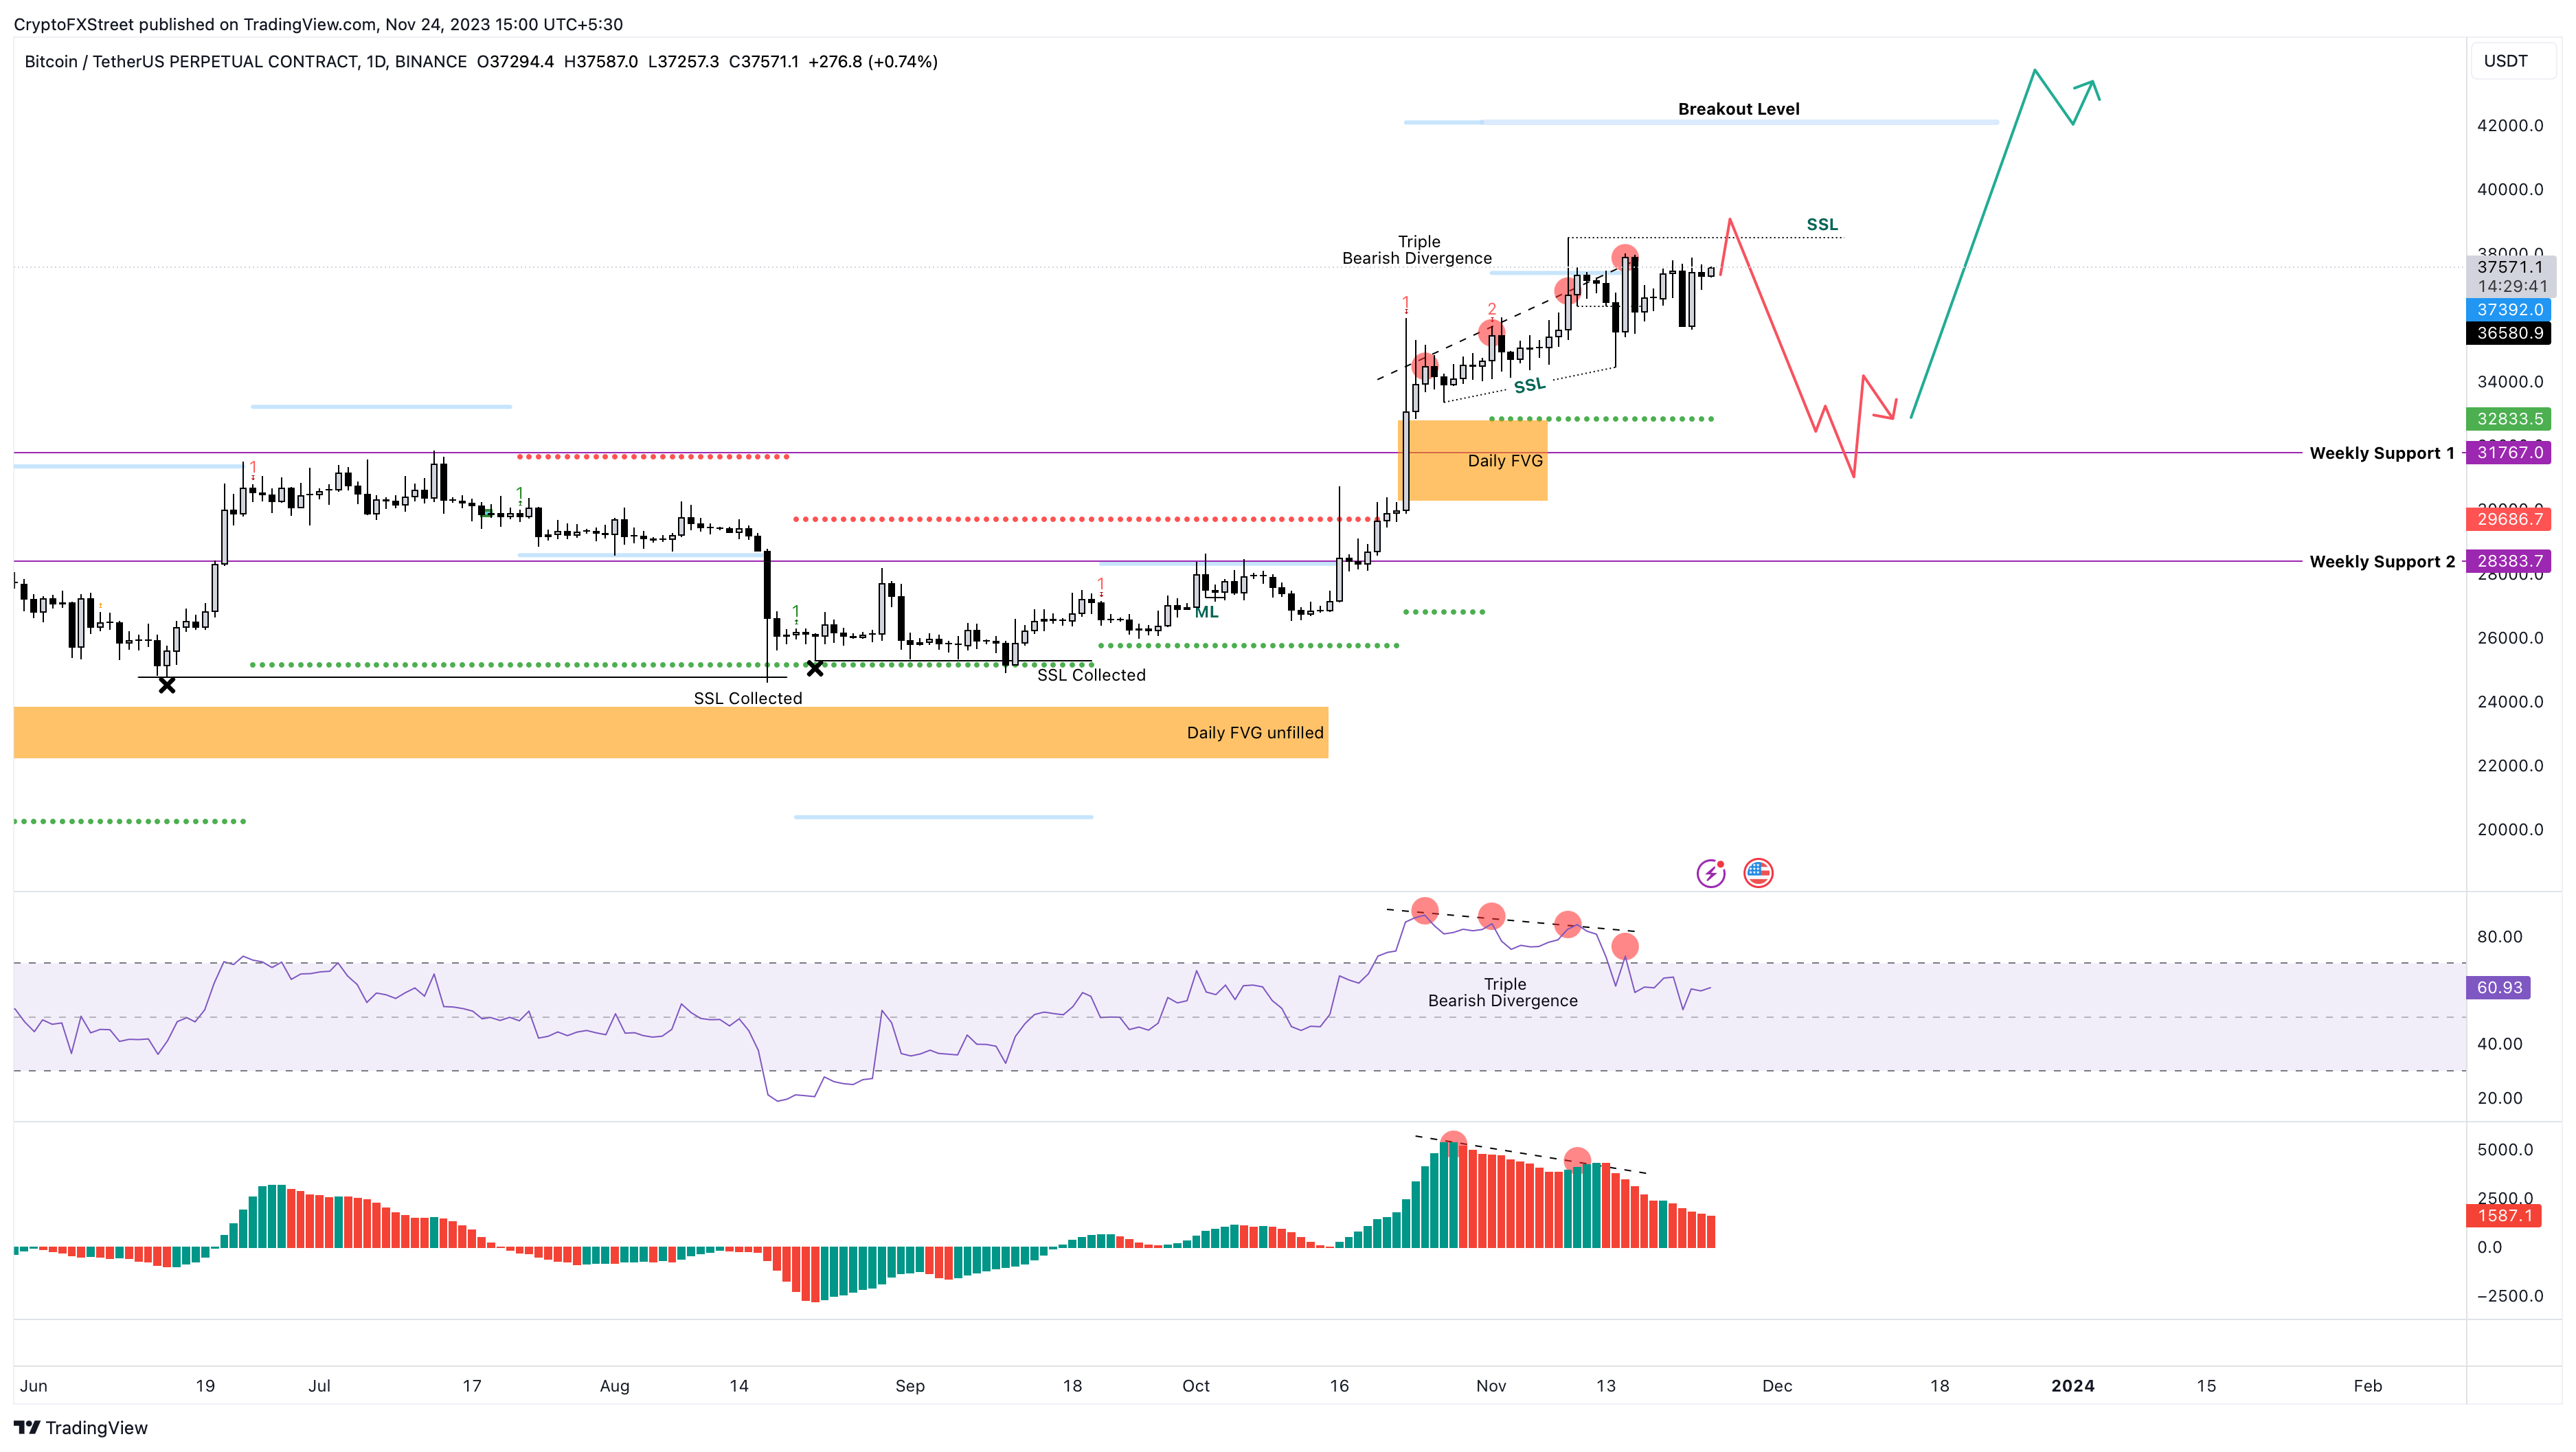
Bitcoin price has been in a slow uptrend since October 27. This climb has produced multiple higher highs, which do not conform with the Relative Strength Index’s (RSI) lower highs. Such non-conformity is termed bearish divergence and is a sell signal that forecasts a move in the opposite direction. This move could either be a small pullback or a steep correction.
The daily Bitcoin price chart shows that the higher lows produced since October 27 have uncollected sell-side liquidity that has not been collected.
Hence, there is a risk that the bearish divergence-induced pullback could knock Bitcoin price down to $33,350, which is the October 27 swing low.
Resting just below is the Momentum Reversal Indicator’s support trend line at $32,833 and the weekly support level at $31,767. These levels are roughly 12.6% and 15.4% away from the current position of $37,587.
Hence, investors should expect a 10% to 15% downswing.
Considering the reduced volume and liquidity during the holiday season, investors can expect this correction to come sooner rather than later.
Read more: If you like Bitcoin, buy Bitcoin: Jim Cramer admits to making profits from Bitcoin investments
BTC/USDT 1-day chart
According to data from CoinGlass, the $37,900 to $38,100 range harbors roughly $3 billion worth of liquidity. When the price moves against a trader’s position, crypto exchanges calculate the liquidation levels based on the margin available. A liquidation event occurs if the price moves against a trader’s position and there is insufficient margin to cover the open positions.
These areas act as magnets for the underlying asset to move in that direction. Once the liquidity is collected, trend reversals are likely to occur, but not always. In some cases, the price can continue to move in the same direction.
For Bitcoin price, the last liquidity event was on November 9, which immediately led to a reversal.
From a technical analysis perspective, the highest probability scenario for a correction to occur would be after the sweep of the liquidity resting around the $38,000 region or the November 9 swing high of $38,500.

BTC liquidation levels
Concluding thoughts
While the Bitcoin price correction scenario detailed above is logical, investors should note that the ETF approval narrative has a lot of potential and could continue to push BTC higher up to $40,000 before a correction could occur. In some cases, this much-anticipated pullback might never happen.
If Bitcoin price overcomes the MRI’s breakout level at roughly $42,100, it could attract sidelined buyers and retail investors to step in, extending the 2023 rally. This move would invalidate the bearish thesis for BTC.
As FOMO snowballs, BTC could eye to revisit the whole number levels like $45,000 and $50,000.
(This story was corrected on November 24 at 15:33 GMT to say that Bitcoin's price move over the $42,100 level would invalidate the bearish thesis, not $42,1000 and not bullish thesis.)
Author

Akash Girimath
FXStreet
Akash Girimath is a Mechanical Engineer interested in the chaos of the financial markets. Trying to make sense of this convoluted yet fascinating space, he switched his engineering job to become a crypto reporter and analyst.