Bitcoin Weekly Forecast: The bull and the bear case for BTC
- Bitcoin price is stuck between $60,000 and $53,000 and shows no directional bias whatsoever.
- The bull case for the pioneer crypto is likely if it manages to produce a daily close above $65,000.
- However, losing $53,000 as support could push BTC to retest $50,000 or even dip lower.

Bitcoin price saw a recent bullish impulse that faced massive headwinds before it tagged a crucial psychological barrier. With directional bias and choppy price action, BTC is likely to experience massive volatility as the situation resolves over time.
Bitcoin’s bull case
Bitcoin price has set a higher low close to the $53,000 area but failed to retest it. As buyers stepped in, BTC experienced a quick rally to $59,269 and missed revisiting two crucial resistance barriers — last weeks’ high at $59,608 and the $60,000 psychological level.
For the bull case to come into play, the technical perspective suggests that Bitcoin price needs to flip the $60,000 level into a support floor. This could mark the beginning of a new uptrend, but BTC will need to enter an area of high resistance that extends from $63,000 to $65,000 and rise above it to produce a higher high.
A daily close above $65,000 will confirm the optimistic outlook. In this situation, BTC will make a run towards the all-time high at $69,000. If the bullish momentum persists, the pioneer crypto will make its way to set a new record high at $77,908, coinciding with the 161.8% Fibonacci extension level.
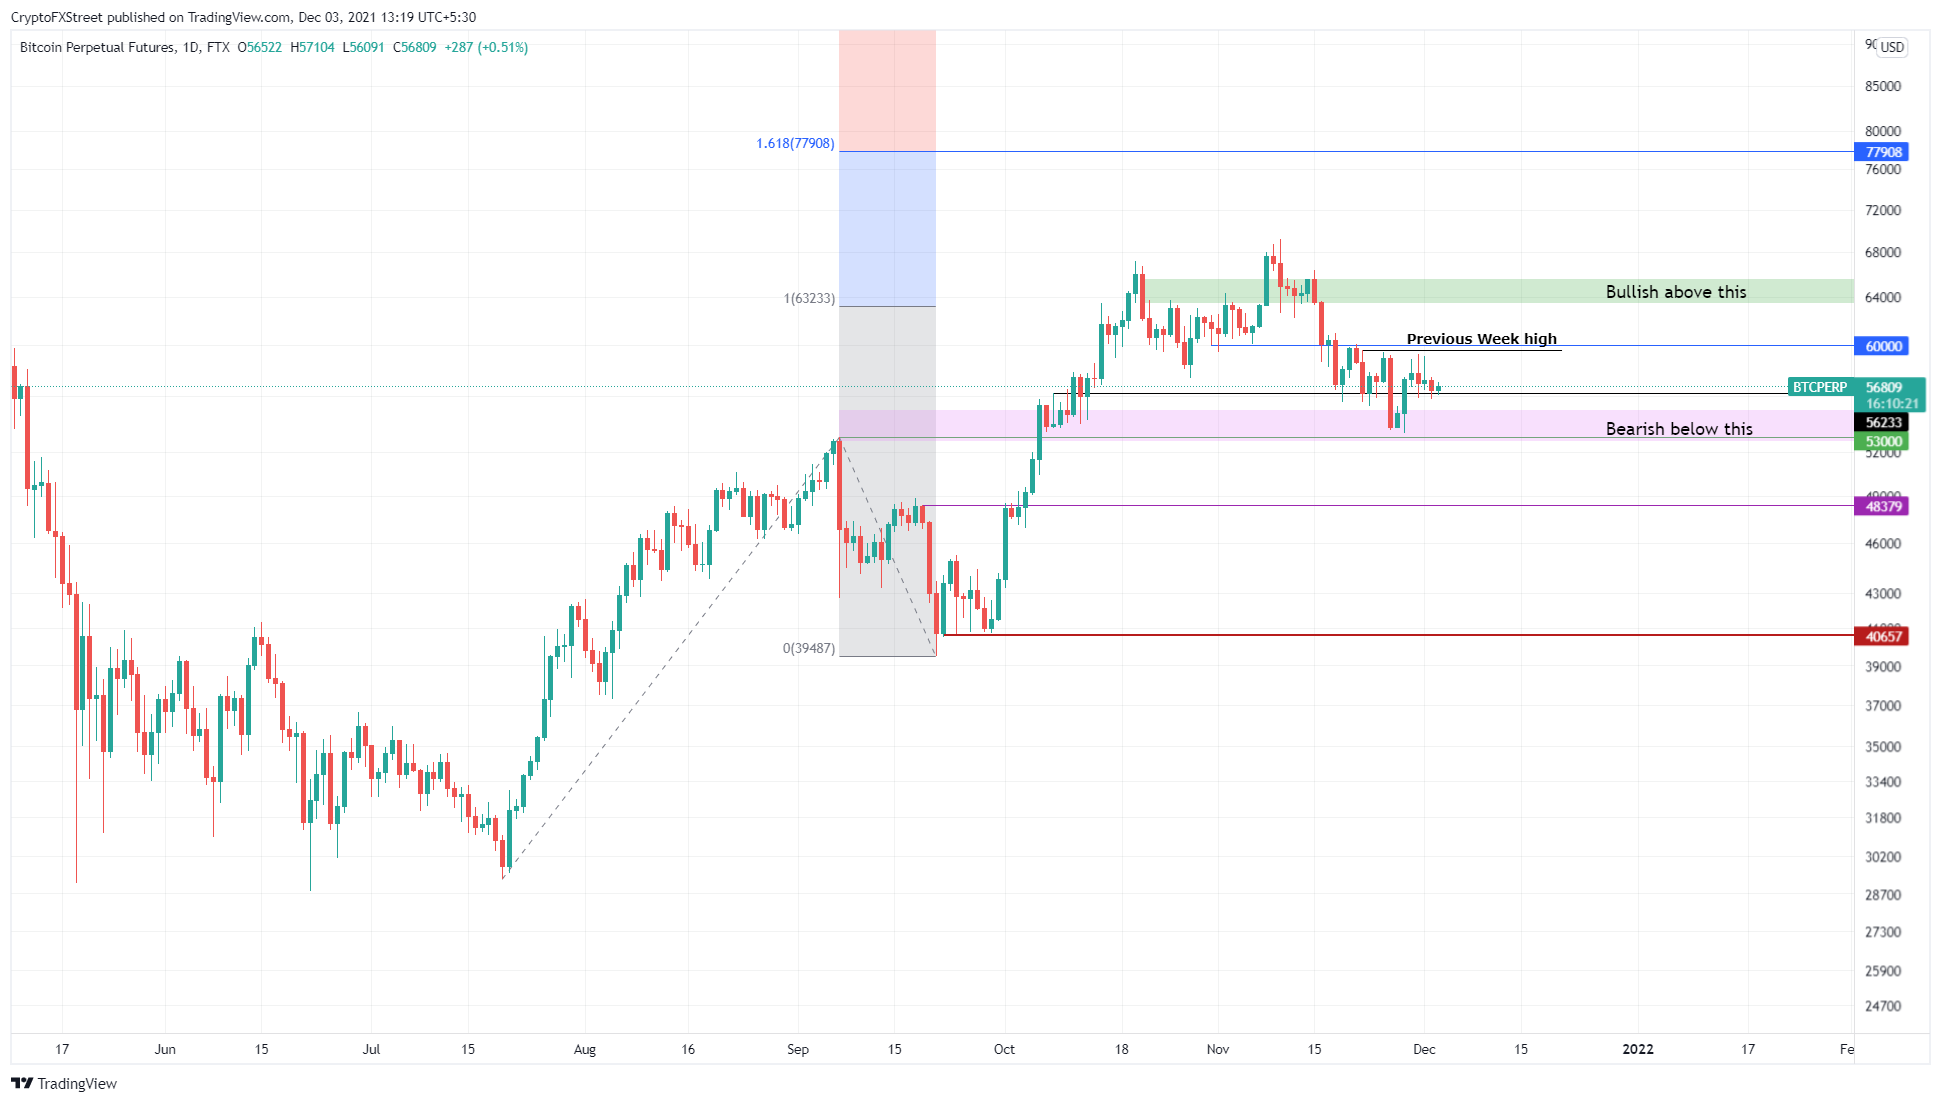
BTC/USDT 1-day chart
Supporting the bullish narrative for Bitcoin price is the decline in the supply on exchanges. Over the past month, the number of BTC held on centralized entities has declined by 20,000 tokens, suggesting that investors are optimistic about the future price action.
On the contrary, if investors were unsure or bearish, this number would increase so they can cash out of their positions for stablecoins.
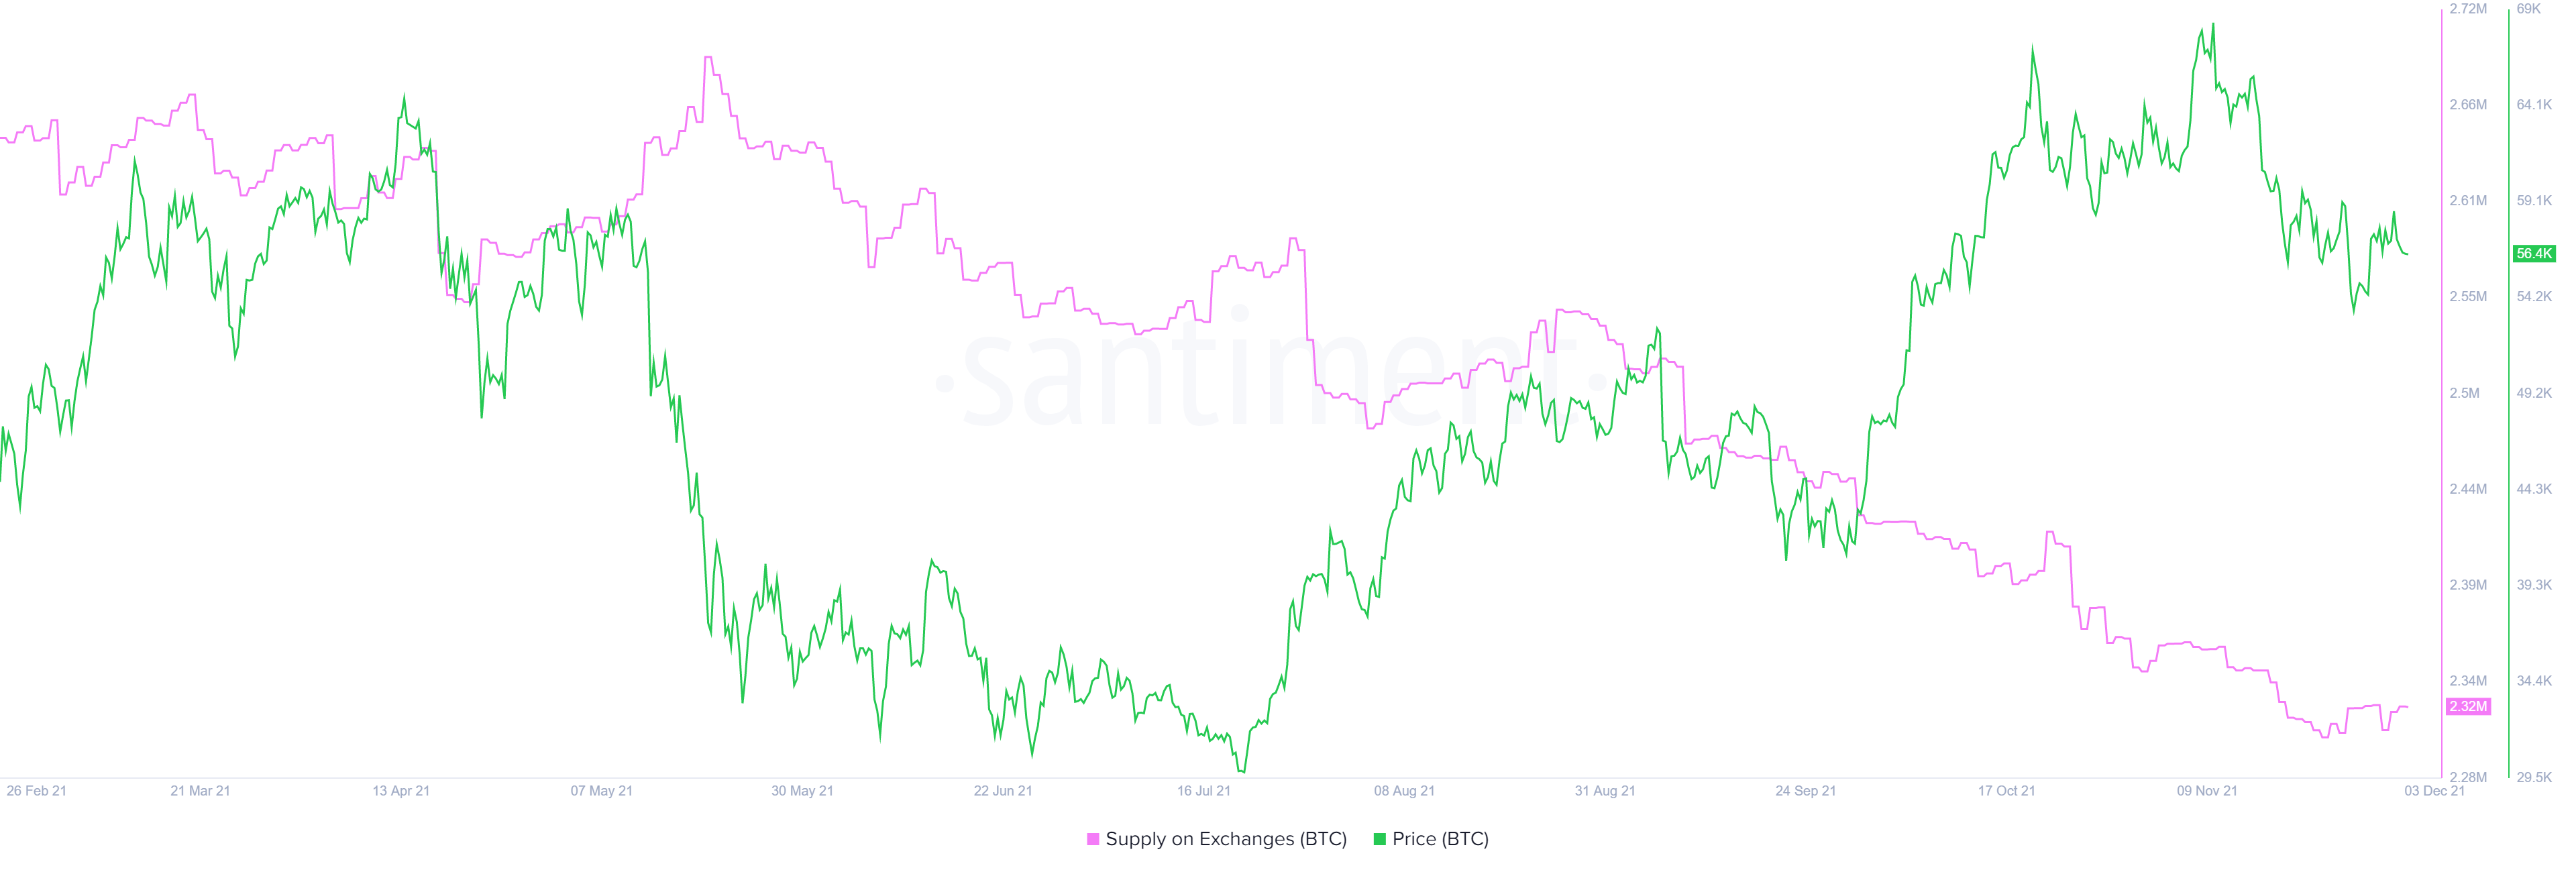
BTC supply on exchanges chart
Further encapsulating the bullish outlook of involved parties is the 10% increase in daily active addresses interacting with the Bitcoin blockchain since November 1. This uptick indicates that investors are interested in BTC at the current price levels and are leaning bullish.
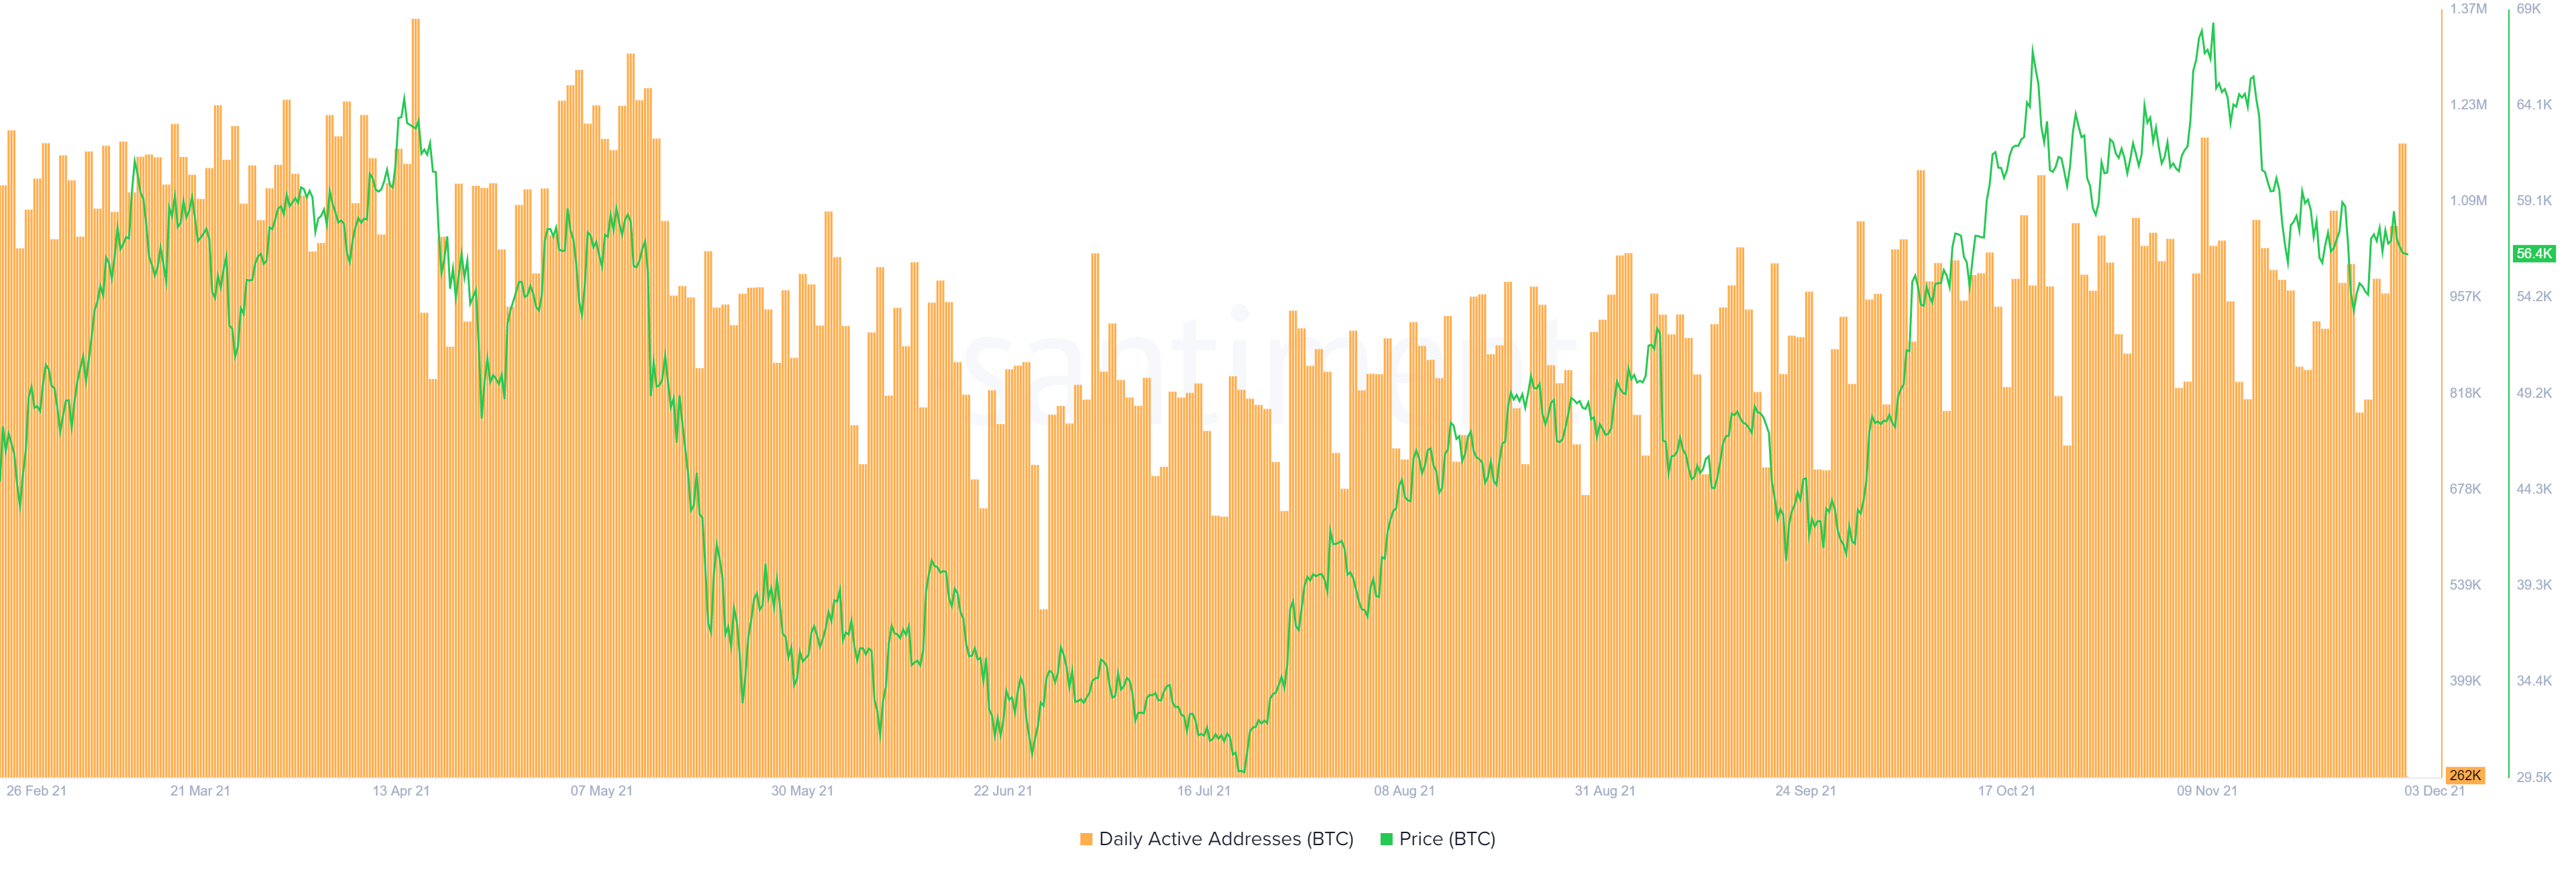
BTC daily active addresses chart
Lastly, IntoTheBlock’s Global In/Out of the Money (GIOM) model shows that Bitcoin price is on the verge of tackling the last supply zone that extends from $58,018 to $67,413. Here, roughly 4.2 million addresses that purchased 2.1 million BTC are underwater.
A potential spike in buying pressure that pushes BTC to produce a daily close above $61,461 will push a majority of these holders “In the Money,” reducing the overall selling pressure. Moreover, Bitcoin is already close to flipping the current cluster of investors from underwater to profitable.
These holders that purchased nearly 2 million BTC between $55,241 to $58,018 will be “In the Money,” if the Bitcoin price produces a daily close above roughly $57,000.
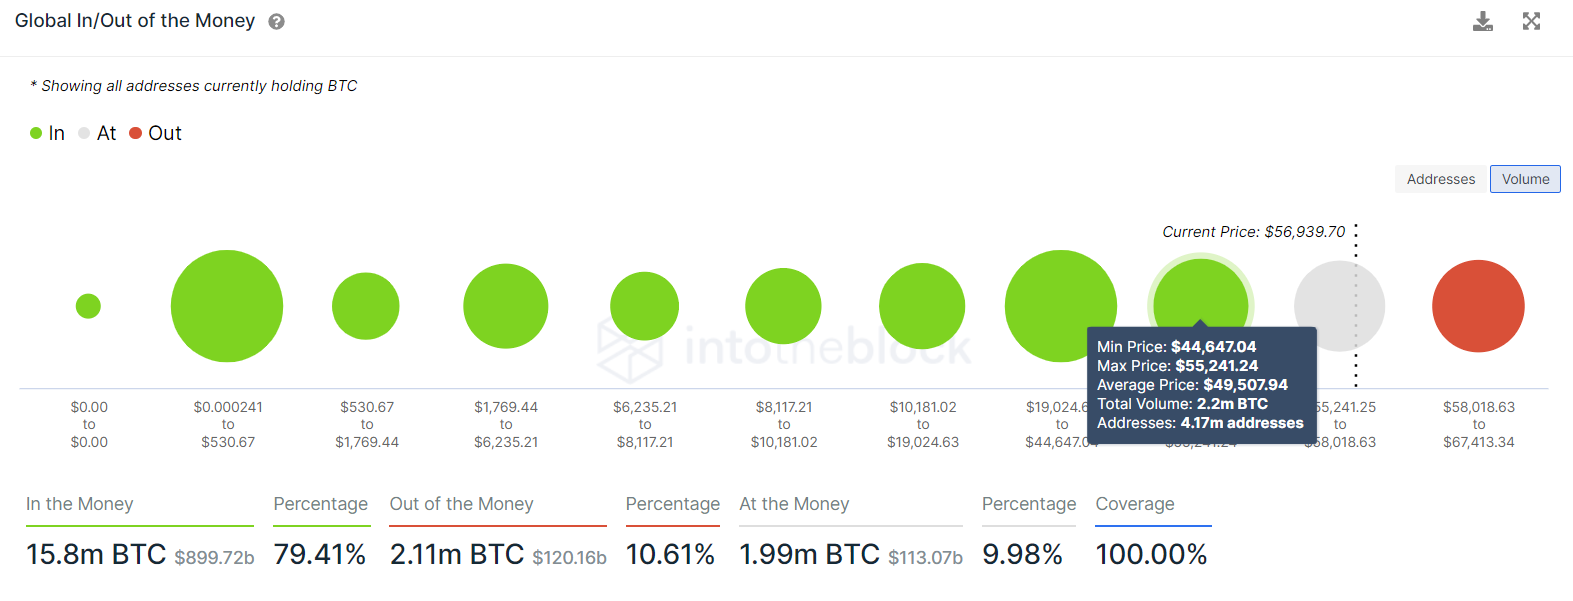
BTC GIOM chart
The bear case for BTC
While the optimistic narrative assumes that Bitcoin flips the $65,000 into a support floor, it is speculative at best. In the case that the buying pressure fails to hold, there is a high chance prices free fall back to $53,000. This development will indicate the affinity of the market makers to push the big crypto lower in search of liquidity or market inefficiencies.
A daily close below $53,000 will trigger a bearish outlook and knock Bitcoin price down to $48,379, which is the first line of defense. Failing to hold above this barrier will see BTC retest the $40,657 support floor and collect the liquidity resting below it.

BTC/USDT 1-day chart
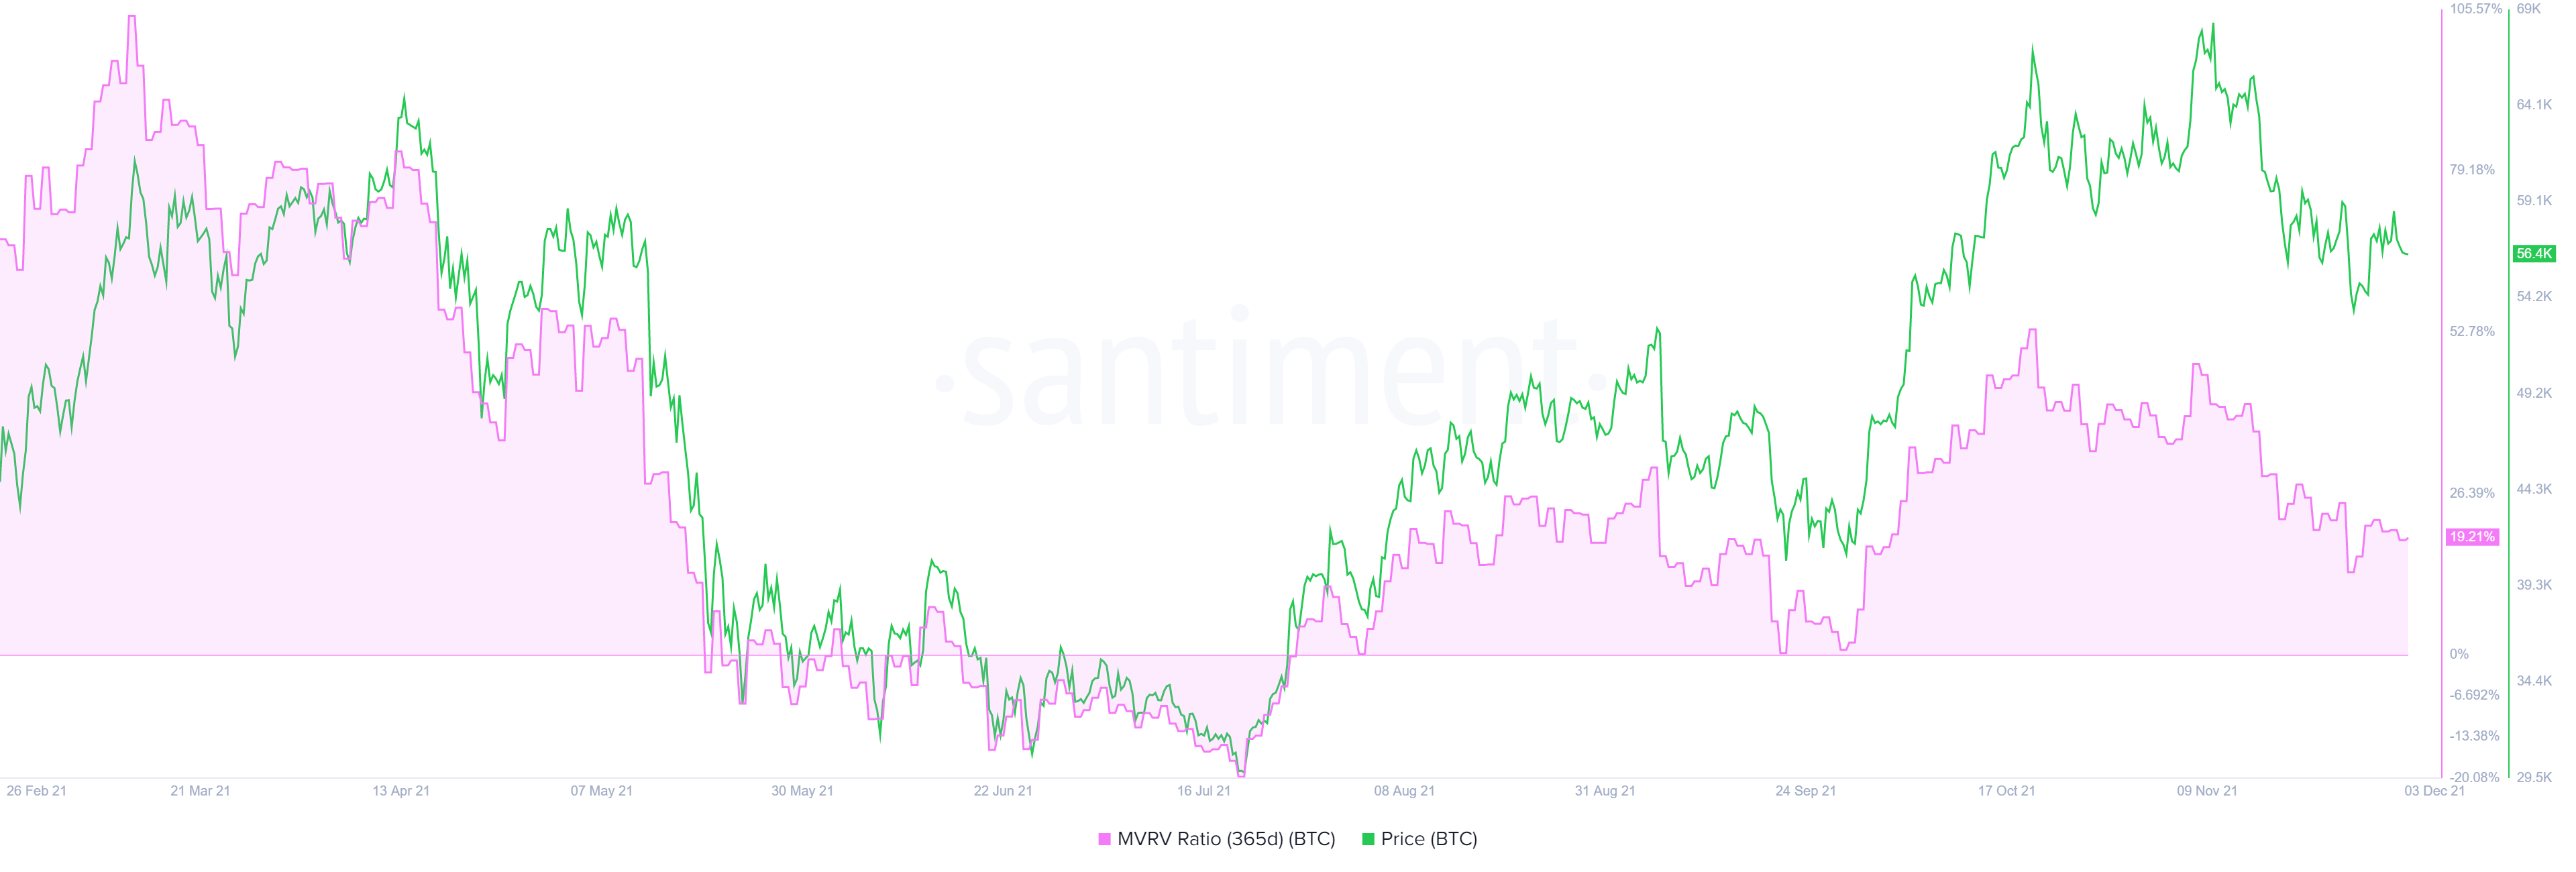
The main support factor for this bearish outlook is the 365-day Market Value to Realized Value (MVRV) model, which is hovering around roughly 20%. This on-chain metric tracks the average profit/loss of investors that purchased BTC over the past year.
Since 20% of the market participants are in profit, there is a chance these investors might offload, increasing the selling pressure and causing prices to crash. If this were to happen, the 365-day MVRV would reset, allowing Bitcoin price to rise unhinged.
BTC 365-day MVRV chart
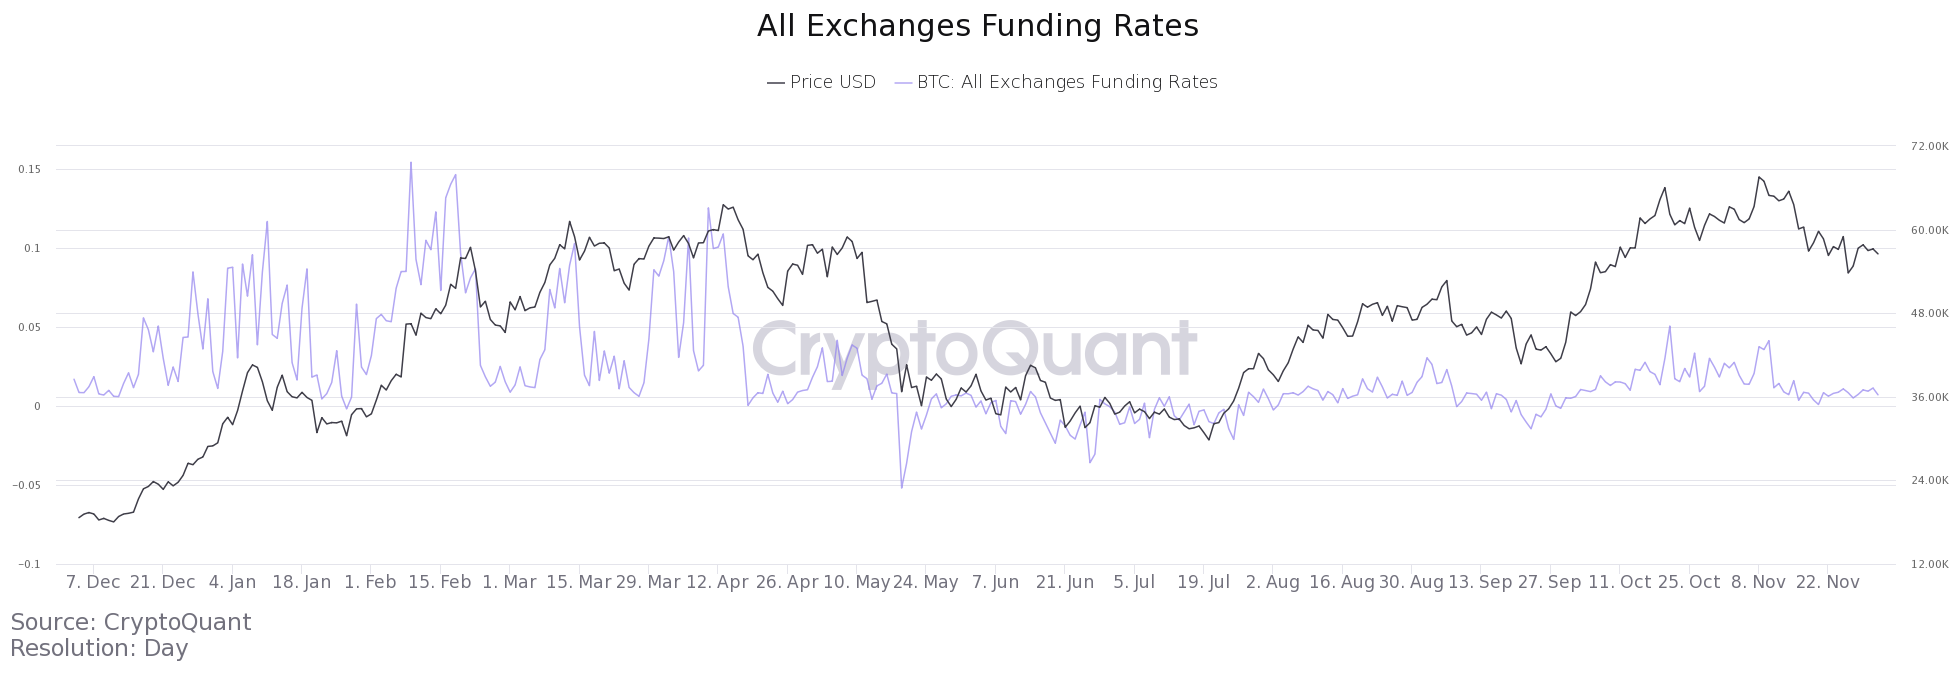
Further cautioning this potential drop is the funding rate of BTC on all exchanges. This metric has largely stayed positive since early September, indicating that a majority of the investors are bullish.
The funding rate across derivative trading platforms currently stands at 0.007%, which is often indicative that the market will overheat and eventually lead to a flash crash.
BTC funding rate chart
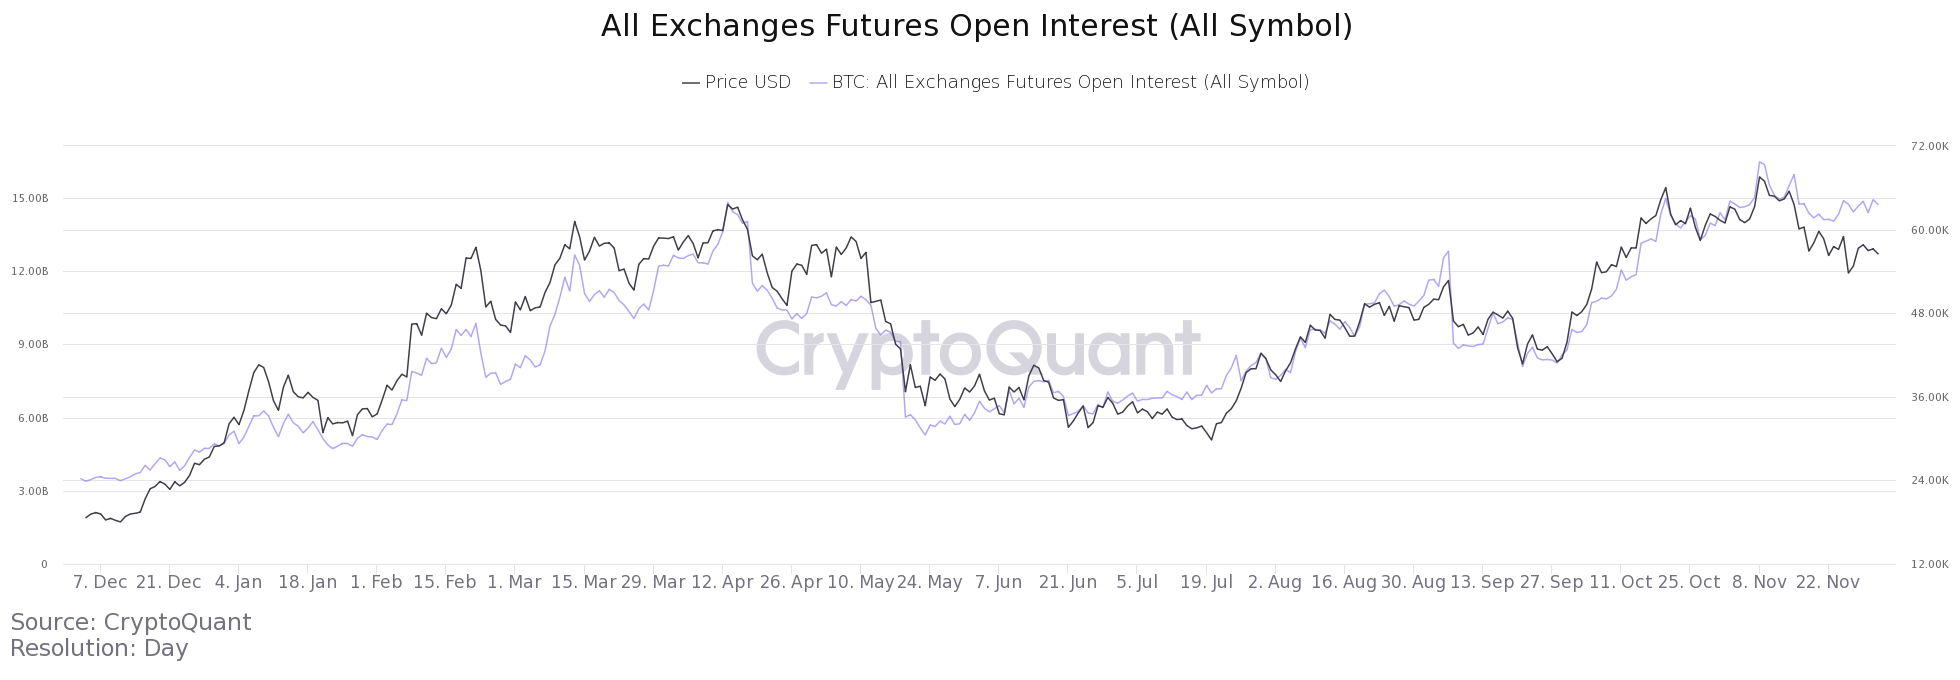
The open interest (OI) for BTC is another on-chain metric that suggests that Bitcoin is overbought. Roughly $14.73 billion in OI can be seen on all exchanges in the crypto space. This number is currently hovering around the same value that Bitcoin saw during its first all-time high at $64,000 in mid-April, suggesting a potential market top.
BTC open interest chart
A correction appears to be necessary to reset some of these vital on-chain metrics and give Bitcoin price a fresh start to an upswing. Still, there is a good chance that BTC could preemptively start an uptrend to new highs if it shatters critical resistance barriers.
Due to the ambiguity, market participants need to pay close attention to Bitcoin and how it revolves around two crucial levels — $65,000 and $53,000. A daily close above this price pocket can have the strength to kick off a new uptrend while breaking below it will validate the bearish outlook and present a unique opportunity for sidelined investors to get back in the market.
Author

Akash Girimath
FXStreet
Akash Girimath is a Mechanical Engineer interested in the chaos of the financial markets. Trying to make sense of this convoluted yet fascinating space, he switched his engineering job to become a crypto reporter and analyst.


