Bitcoin Weekly Forecast: More BTC liquidations than during FTX fallout, what’s next?
- Bitcoin price decline on Thursday caused more crypto positions to get liquidated than during the FTX collapse in November 2022.
- The sharp move after weeks of stagnation has caught many investors off guard.
- The drop comes before Grayscale’s ETF decision, scheduled to take place on August 18 at 15:00 GMT.

Bitcoin price crashed 15.70% from Monday’s open to the weekly low. But Thursday’s daily candlestick hit a low of 14% from its open, which is what caught many investors off-guard. As a result of this sudden shock, $855 million in long positions and $194 million in short positions were wiped out.
As seen in the Velo Data chart below, total BTC liquidations numbers are far greater than when the FTX exchange collapsed in November 2022. Nearly $2 billion in open interest evaporated in the last 24 hours.
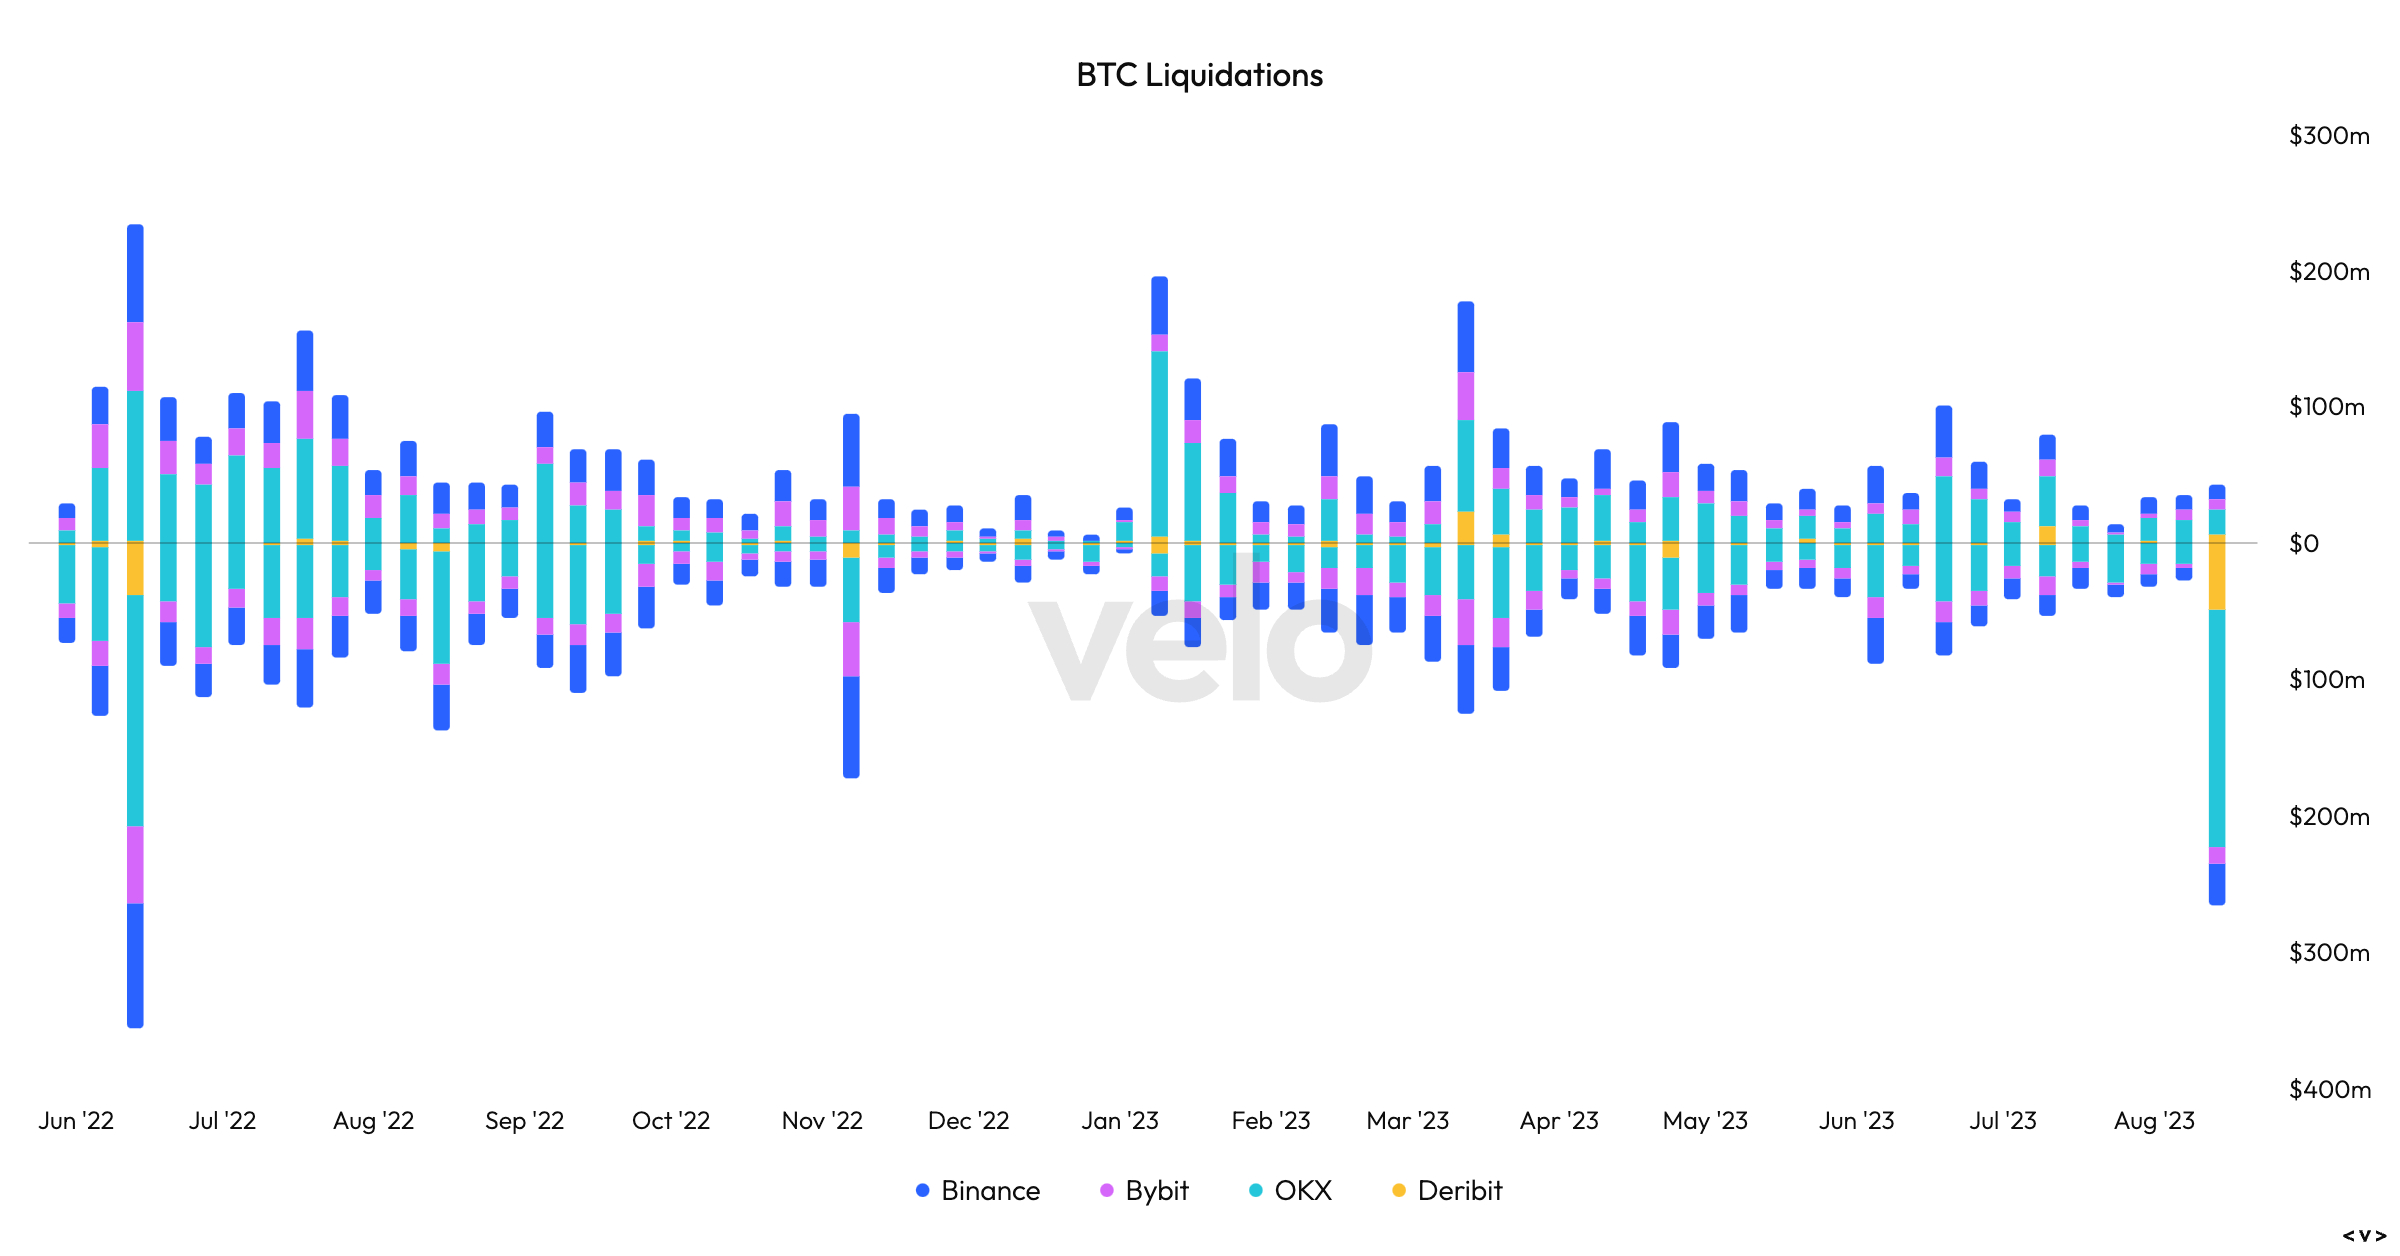
BTC liquidations chart
Due to the consolidation, this downtick was not a surprise to a few traders, but the majority of crypto market participants seem to have been blindsided by the crash. Regardless, investors need to be cautious as the US Securities and Exchange Commission (SEC) is set to provide its decision over Grayscale’s Exchange Traded Fund (ETF) application on August 18 at 15:00 GMT. A positive response from the SEC will likely spur crypto markets to retrace their steps and recover losses. Due to an already largely negative outlook, a rejection or delay from the regulator might not have much effect on Bitcoin price.
Read more: SEC delays decision on Grayscale's GBTC to ETF conversion after Ark Invest remission
Bitcoin price breaches key support levels
Bitcoin price has finally rid itself of bulls expecting BTC to clear $30,000 as it crashed nearly 14% on August 18. This move has the pioneer crypto trading around the $26,000 level, resting below two critical support levels – $25,205 and $24,300. The former was tagged in the recent crash, which was followed by a quick 7.29% upside retracement.
In the coming days, these levels are likely going to be tagged, especially if the Grayscale ETF is rejected. From a technical perspective, however, the midpoint of the 2023 rally at $23,666 is a key level for accumulation. But considering the bearish outlook of the market and the breakdown of the 2023 bull rally’s market structure, a recovery that contests the bears is highly unlikely.
The Relative Strength Index (RSI) and the Awesome Oscillator (AO) on the three-day chart show a grim outlook. The RSI has already slipped below the 50 level, signaling a takeover from bears amid declining bullish momentum. Additionally, the AO indicator has consistently produced reducing red histogram bars, suggesting an increase in bearish momentum as the possibility of a flip below the zero line grows higher.
In such a case, BTC could drop down to the $21,313 support level.
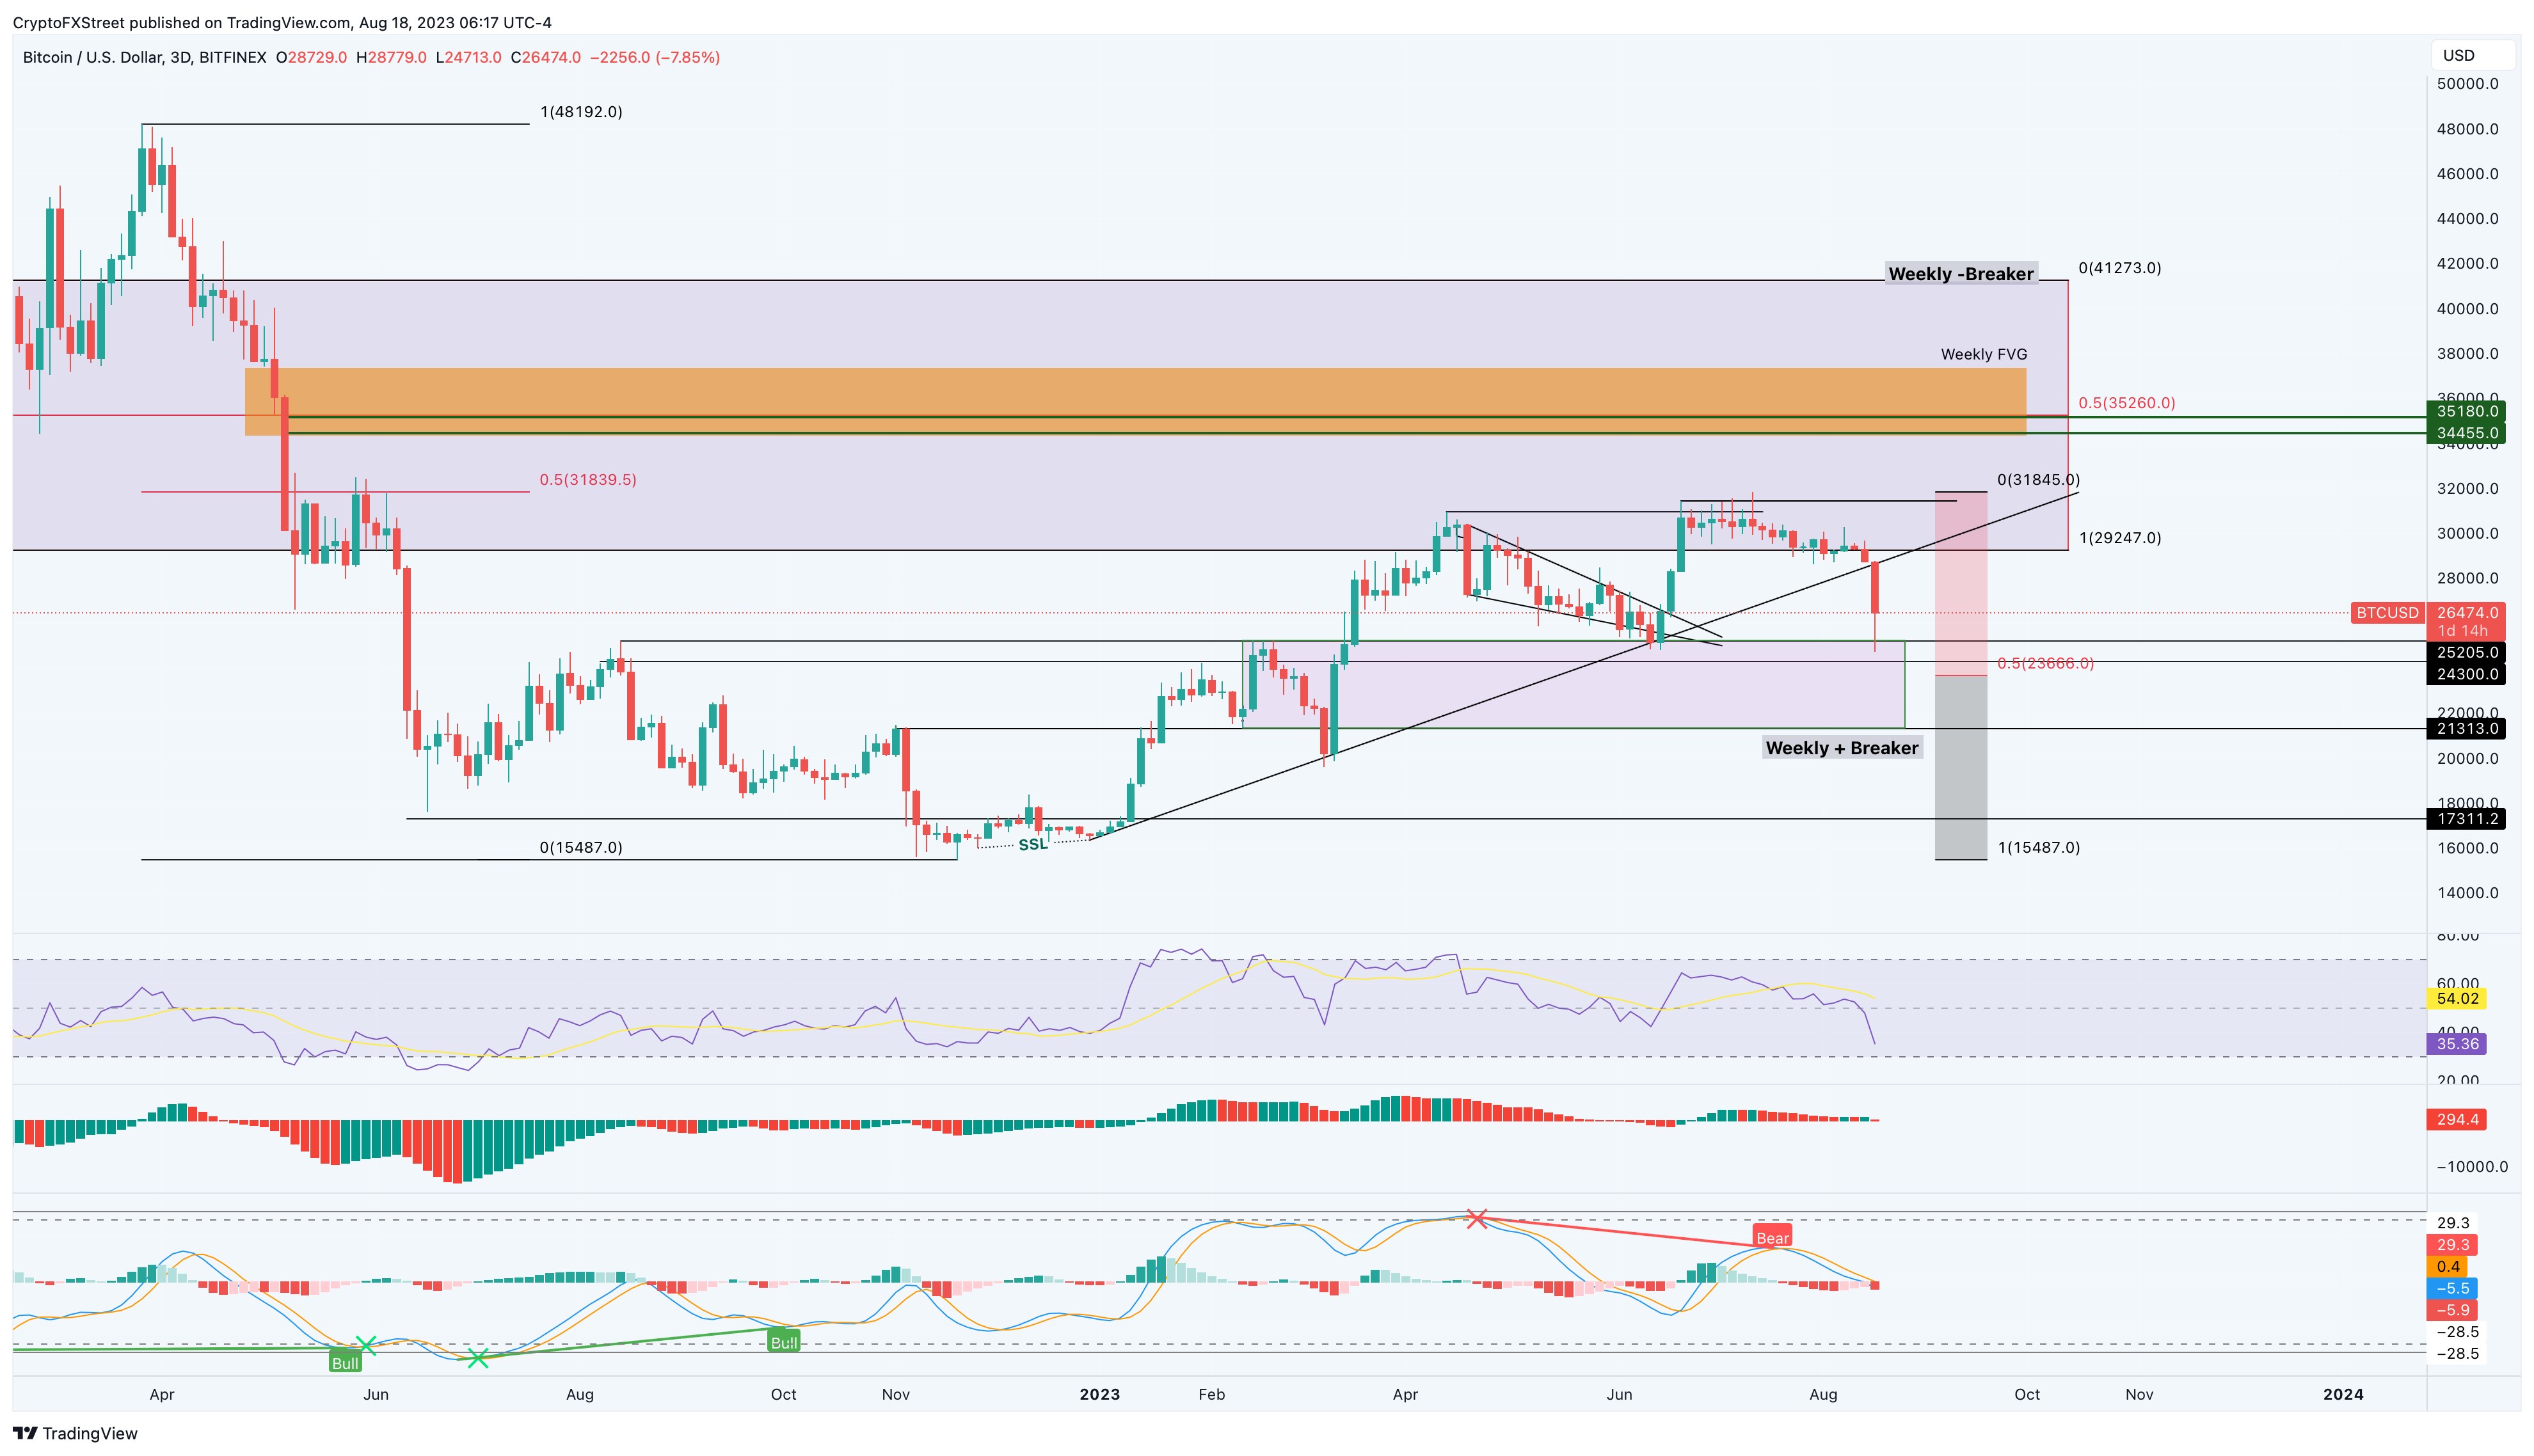
BTC/USDT 3-day chart
On the other hand, if Bitcoin price recovers above the $29,247 hurdle and flips it into a support floor, it will signal that the crash was a flush to quell early bulls and to trap short-sellers. In such a case, BTC needs to follow up and flip the $31,845 hurdle into a support floor to invalidate the bearish thesis.
This move could further propel Bitcoin price to the next resistance level at $35,260, which is a confluence of key hurdles.
Also read: Bitcoin likely to remain in red through the next quarter if history is any indication
Like this article? Help us with some feedback by answering this survey:
Author

Akash Girimath
FXStreet
Akash Girimath is a Mechanical Engineer interested in the chaos of the financial markets. Trying to make sense of this convoluted yet fascinating space, he switched his engineering job to become a crypto reporter and analyst.


