Bitcoin Weekly Forecast: Institutional wave of BTC adoption follows new all-time highs
- Coinbase becomes the first cryptocurrency exchange to have a public listing.
- AXA Switzerland joins Tesla in accepting BTC as a form of payment, while MicroStrategy pays its board using this crypto.
- Bitcoin price remains bullish from a technical and on-chain perspective.

Bitcoin price hitting a new all-time high and Coinbase’s direct listing are perhaps two of the most important developments surrounding the pioneer cryptocurrency over the past week. As the hype fades, BTC price retraces, creating a base for the next leg up.
Coinbase, the poster child of crypto
US-based cryptocurrency exchange Coinbase went public on Wednesday under the ticker COIN. Such a historic moment was recorded on the Bitcoin blockchain as mining pool company F2Pool coded a headline from The New York Times at block height 679,187.
NYTimes 10/Mar/21 House Gives Final Approval to Biden's $1.9T Pandemic Relief Bill.
The message resembles the one Bitcoin’s creator, Satoshi Nakamoto, left in the genesis block to express disdain at the traditional finance system.
Since the direct listing in Nasdaq, COIN has retraced 24.05%, going from a high of $429.94 to trade at $326.55 at the time of writing. Despite the significant price slump, institutional investors are already taking advantage of the downswing to buy the shares at a discount.
Cathie Wood, portfolio manager and CEO of ARK Investment Management, dumped $178 million worth of Tesla (TSLA) to scoop up nearly 750,000 COIN shares worth $246 million.
Now, it would be interesting to observe how Bitcoin price action will affect Coinbase’s stock performance and whether those institutions that have stayed away from cryptocurrencies will gain exposure to COIN.
Institutional adoption wave hits the shore
Institutions have gone from criticizing Bitcoin to scooping up almost 1.00% of BTC’s total supply. MicroStrategy, Tesla and Galaxy Digital Holdings lead the pack with over 155,981 BTC in their portfolios.
Moreover, insurance giant AXA Switzerland revealed on Thursday that it would follow Tesla’s steps and allow its customers to pay premiums in BTC. The firm’s Head of Open Innovation, Claudia Bienentreu, affirmed:
This is AXA's response to growing demand from its customers for alternative payment solutions, with new technologies playing an ever greater role
On the same note, enterprise software company MicroStrategy announced on Monday that it will pay its board of directors using Bitcoin.
On April 11, 2021, the Board of Directors (the “Board”) of MicroStrategy Incorporated (the “Company”) modified the compensation arrangements for non-employee directors. Going forward, non-employee directors will receive all fees for their service on the Company’s Board in bitcoin instead of cash.
Even though these positive developments are helping push forward Bitcoin’s mainstream adoption, its price took a hit recently after recording new all-time highs.
Bitcoin price performance in April could go down in history books
Bitcoin price is currently pulling back, which may result in the fifth higher low since January 27. As the latest downswing is under formation, perpetual swap funding rates have also declined over the past week.
The sudden 63% drop in funding rates indicates that there is not a large crowd trying to long Bitcoin at the current price levels. The most significant demand zone ranging from $58,960 to $61,780 is where investors can expect Bitcoin price to consolidate.
Volatility has also decreased significantly, reaching levels last seen in November 2020. Such a dramatic collapse does not fall in line with the historic volatility explicitly observed for the month of April over the past few years.
Indeed, BTC price data from 2011 reveals that April witnessed an average monthly annualized volatility of 99% and generated an average monthly return of 51%, without taking into consideration April 2014 and 2015.
If history repeats itself, Bitcoin could see a u-turn in volatility and returns and close a seventh consecutive green monthly candlestick.
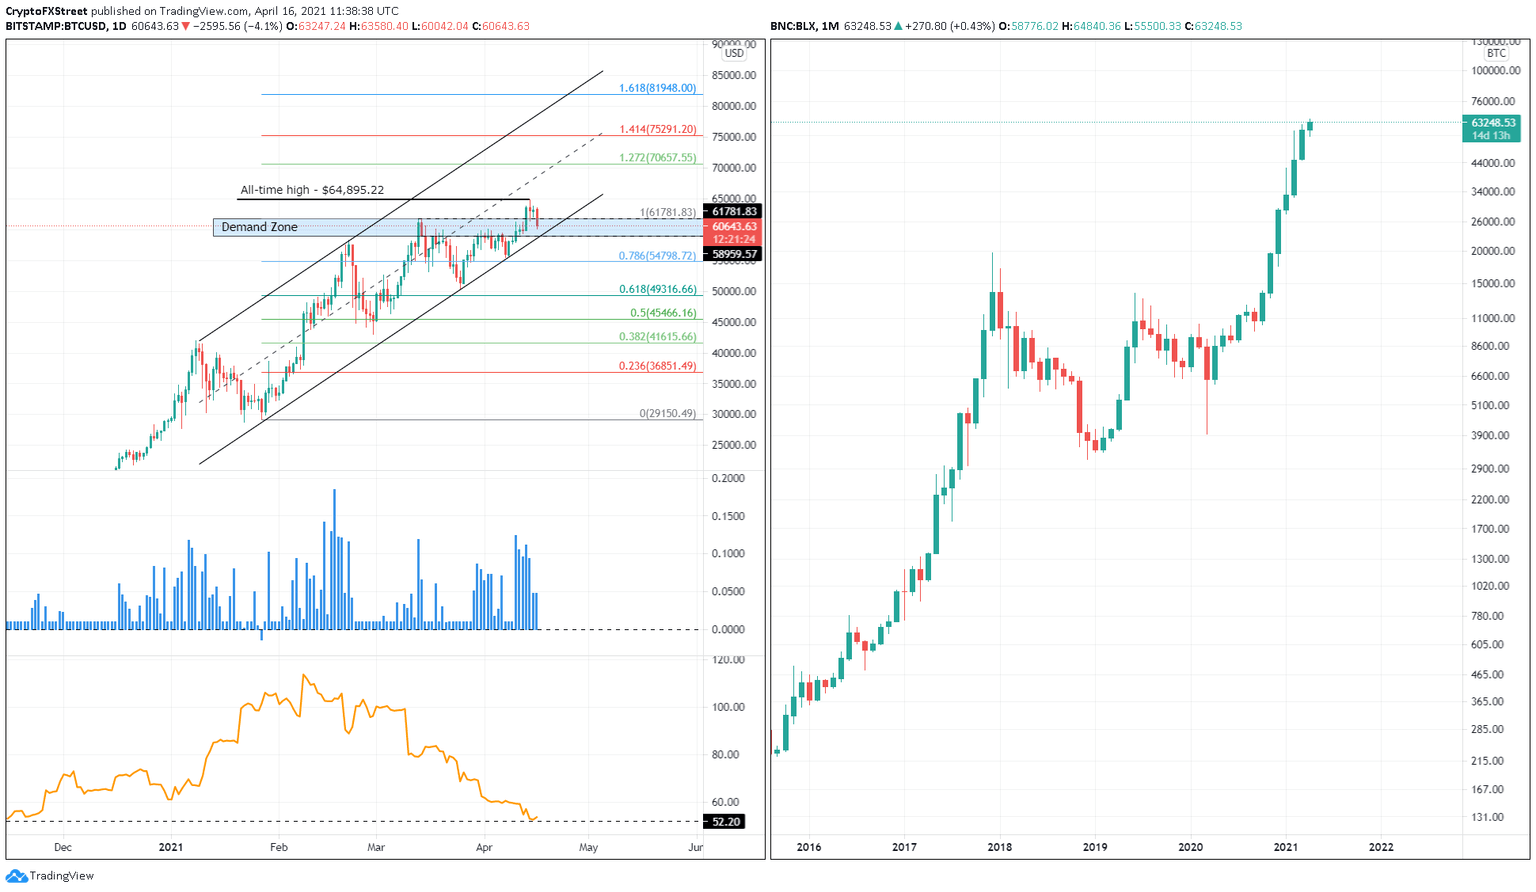
BTC/USD 1-day, 1-month chart
The optimistic outlook is supported by the reduction of spot exchange reserves. The significant exodus of BTC token from trading platforms might indicate that investors are bullish on Bitcoin and are not planning to book profits anytime soon.
Roughly $19 million worth of BTC have left known crypto exchange wallets since the beginning of 2021.
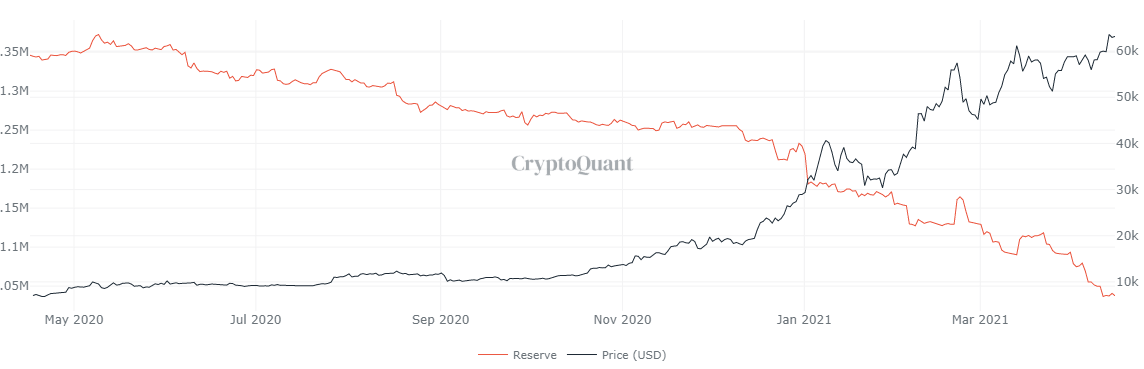
BTC spot exchange reserves chart
Adding tailwind to the cocktail of low funding rates and reduced supply on exchanges is the stablecoins exchange reserve.
Approximately $1.65 billion worth of stablecoins have flown onto known exchange wallets since April 7, suggesting that investors are, in general, bullish.
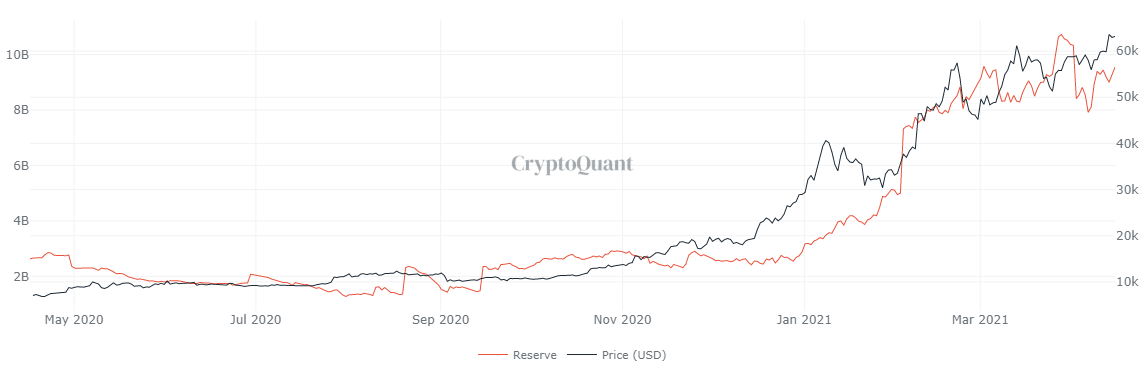
Stablecoin exchange reserve chart
As noted in the chart below, the current miner revenue cycle has faced resistance around the previous cycle’s peak, thus acting as a pitstop during the bull runs. Hence, if history were to rhyme, then the current bitcoin price and miner revenue positions indicate that this is a halfway point.
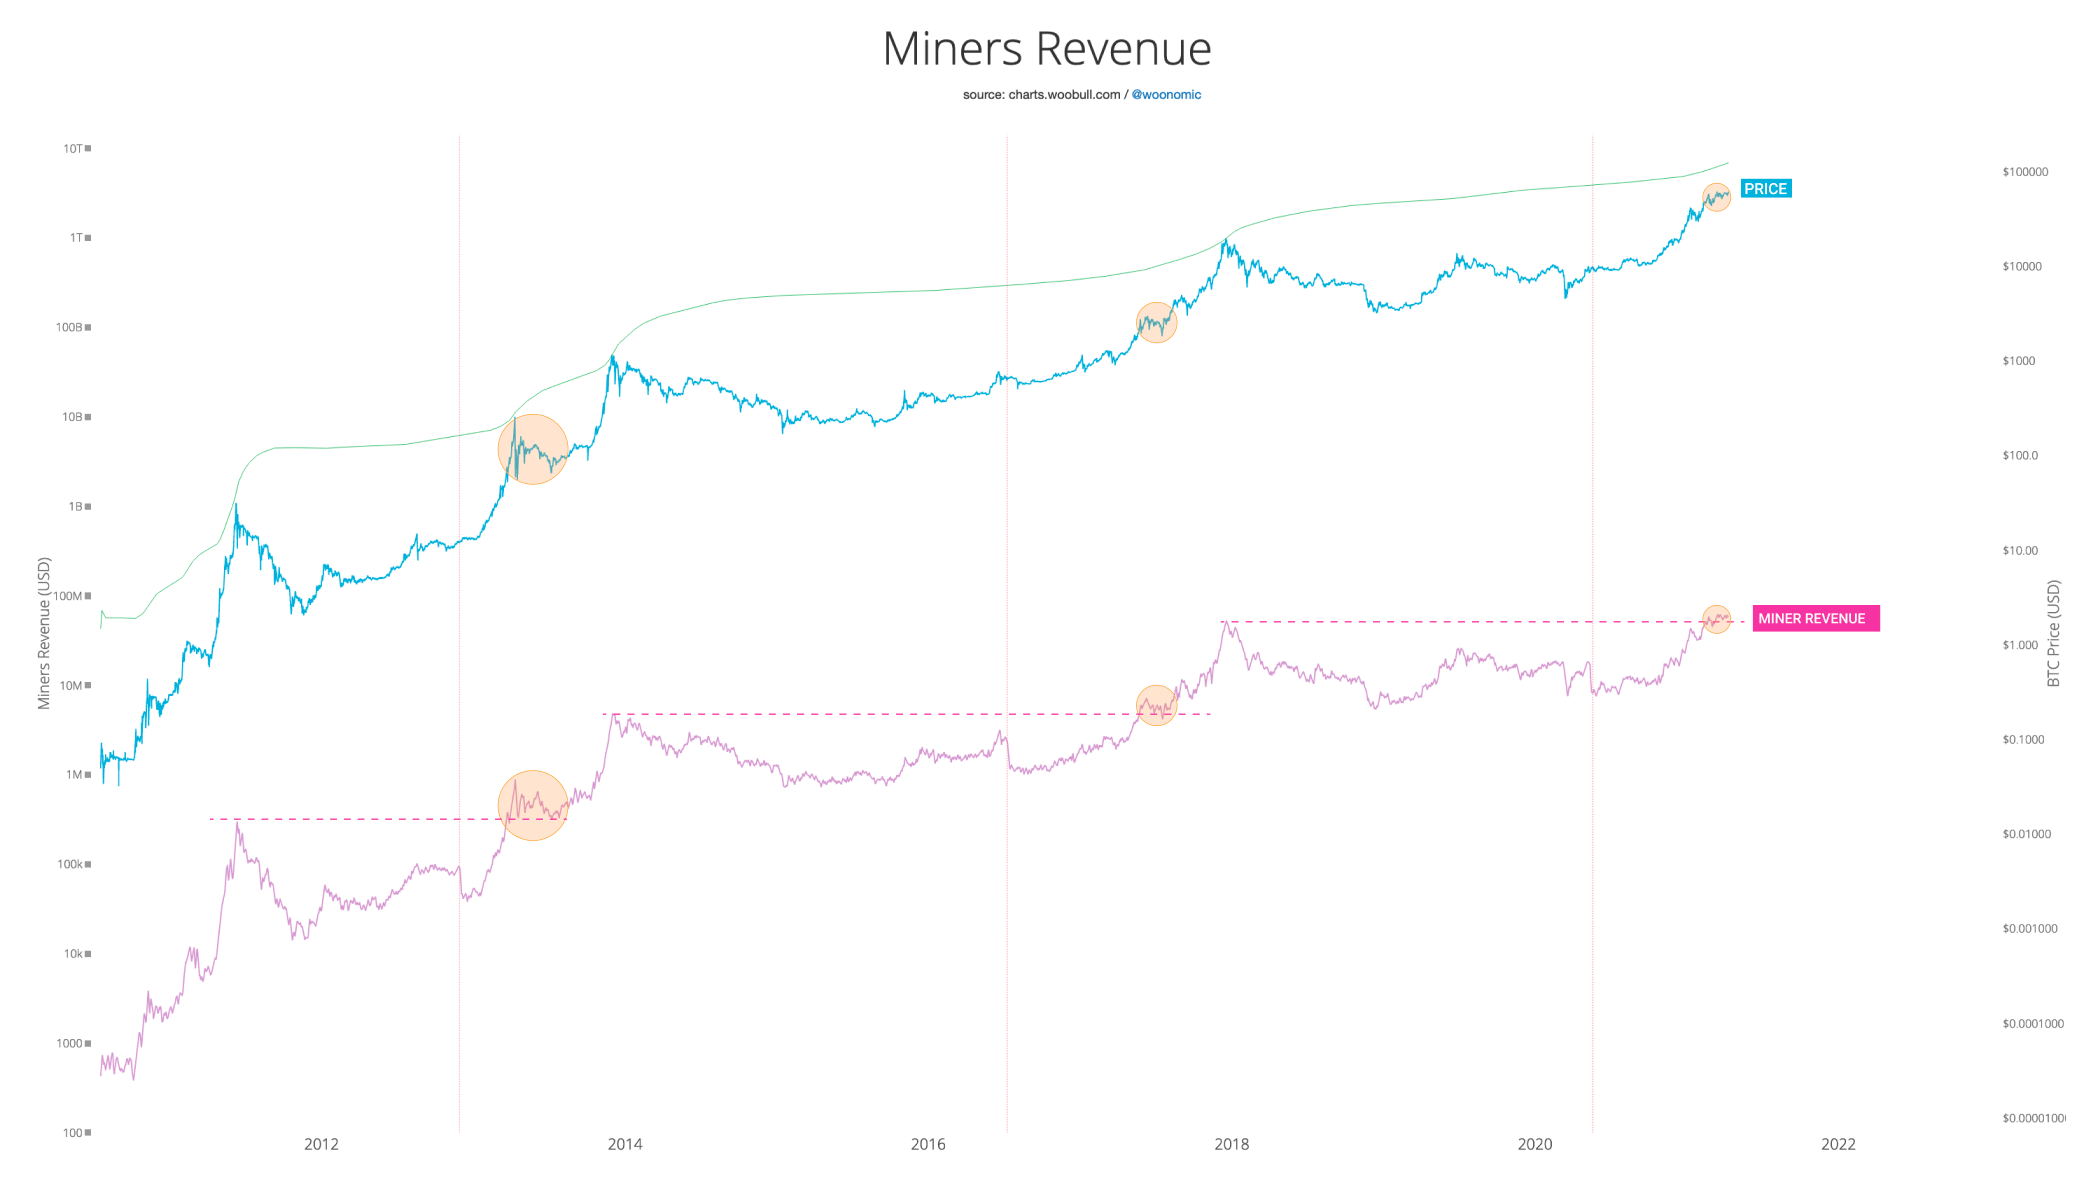
Bitcoin miner revenue chart
Bitcoin’s adoption, fundamentals, technicals, and on-chain metrics indicate that prices have more room to go up. The 127.2% and 141.4% Fibonacci extension levels would be the interest areas to watch out upon the resumption of the uptrend. These potential resistance barriers sit at $70,657 and $75,291, respectively.
Despite the bullish outlook, the Pi Cycle Top indicator has finally presented a bearish crossover.
A death cross occurs when the 111-day Simple Moving Average (SMA) moves above the 350-day SMA with two standard deviations. The last three times such a crossover occurred, it marked the beginning of a bear market.
The first signal produced on April 6, 2013, saw a 68% retracement. Likewise, the second and the third crossovers, seen on December 5, 2013 and December 16, 2017, were soon followed by 66% and 83% pullbacks, in that order.
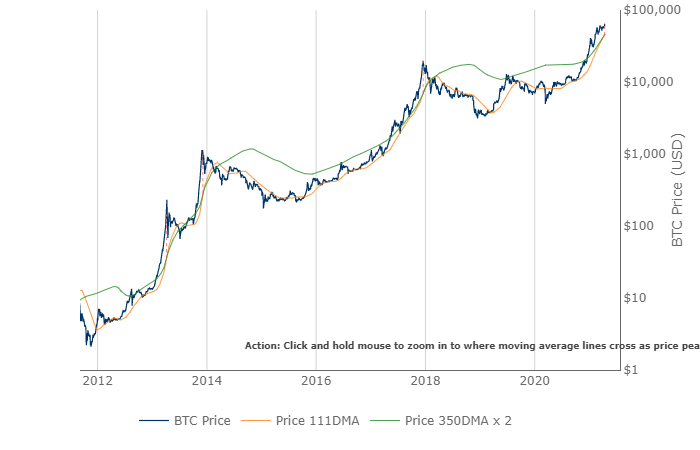
Bitcoin Pi Cycle Top indicator chart
If BTC price produces a daily candlestick close below the lower range of the demand zone at $58,959, it would indicate the formation of a lower low. Such a downswing would add credence to the Pi Cycle Top indicator’s bearish outlook.
A spike in selling pressure that pushes BTC below the aforementioned support level could result in a 7.50% correction toward the 78.6% Fibonacci retracement level at $54,798.
Author

Akash Girimath
FXStreet
Akash Girimath is a Mechanical Engineer interested in the chaos of the financial markets. Trying to make sense of this convoluted yet fascinating space, he switched his engineering job to become a crypto reporter and analyst.


