- Bitcoin price shows signs of embarking on a bull run, but it needs to fulfill a few conditions.
- BTC’s CME chart shows unfilled gaps at $35,180, making it one of the bull rally's targets.
- The ongoing bullish trend will face invalidation if the big crypto fails to defend the $21,867.
Bitcoin price shows a clean bounce off a stable support level that paused its retracement and restarted its 2023 bull rally. While the recovery was impressive, it faced massive selling pressure as it approached the 200-day Simple Moving Average (SMA). Regardless, the big crypto’s position looks strong and optimistic as it consolidates.
Also read: US CPI data above expectations at 6.4% – Is the crypto market about to turn bearish?
Bitcoin price ready to cover more ground
Bitcoin price bounced off the $21,867 support level, ending the short-lived correction. The weekly chart currently shows two critical levels - the 200-day SMA at $25,009, roughly coinciding with the Momentum Reversal Indicator’s resistance level at $25,207 and the aforementioned support level.
If neither of the camps fails to take control of the Bitcoin price, a consolidation similar to the second half of December 22 is likely to ensue.
Further inspecting the Relative Strength Index (RSI) shows that it has bounced off the 50-level, indicating a potential replenishment of bullish momentum.
Therefore, the 2023 bull rally, which has yielded a 43% upswing, could continue, pushing Bitcoin price higher. In a case where BTC overcomes the resistance confluence at roughly $25,200, the next stop would be $43,000, as indicated by the MRI.
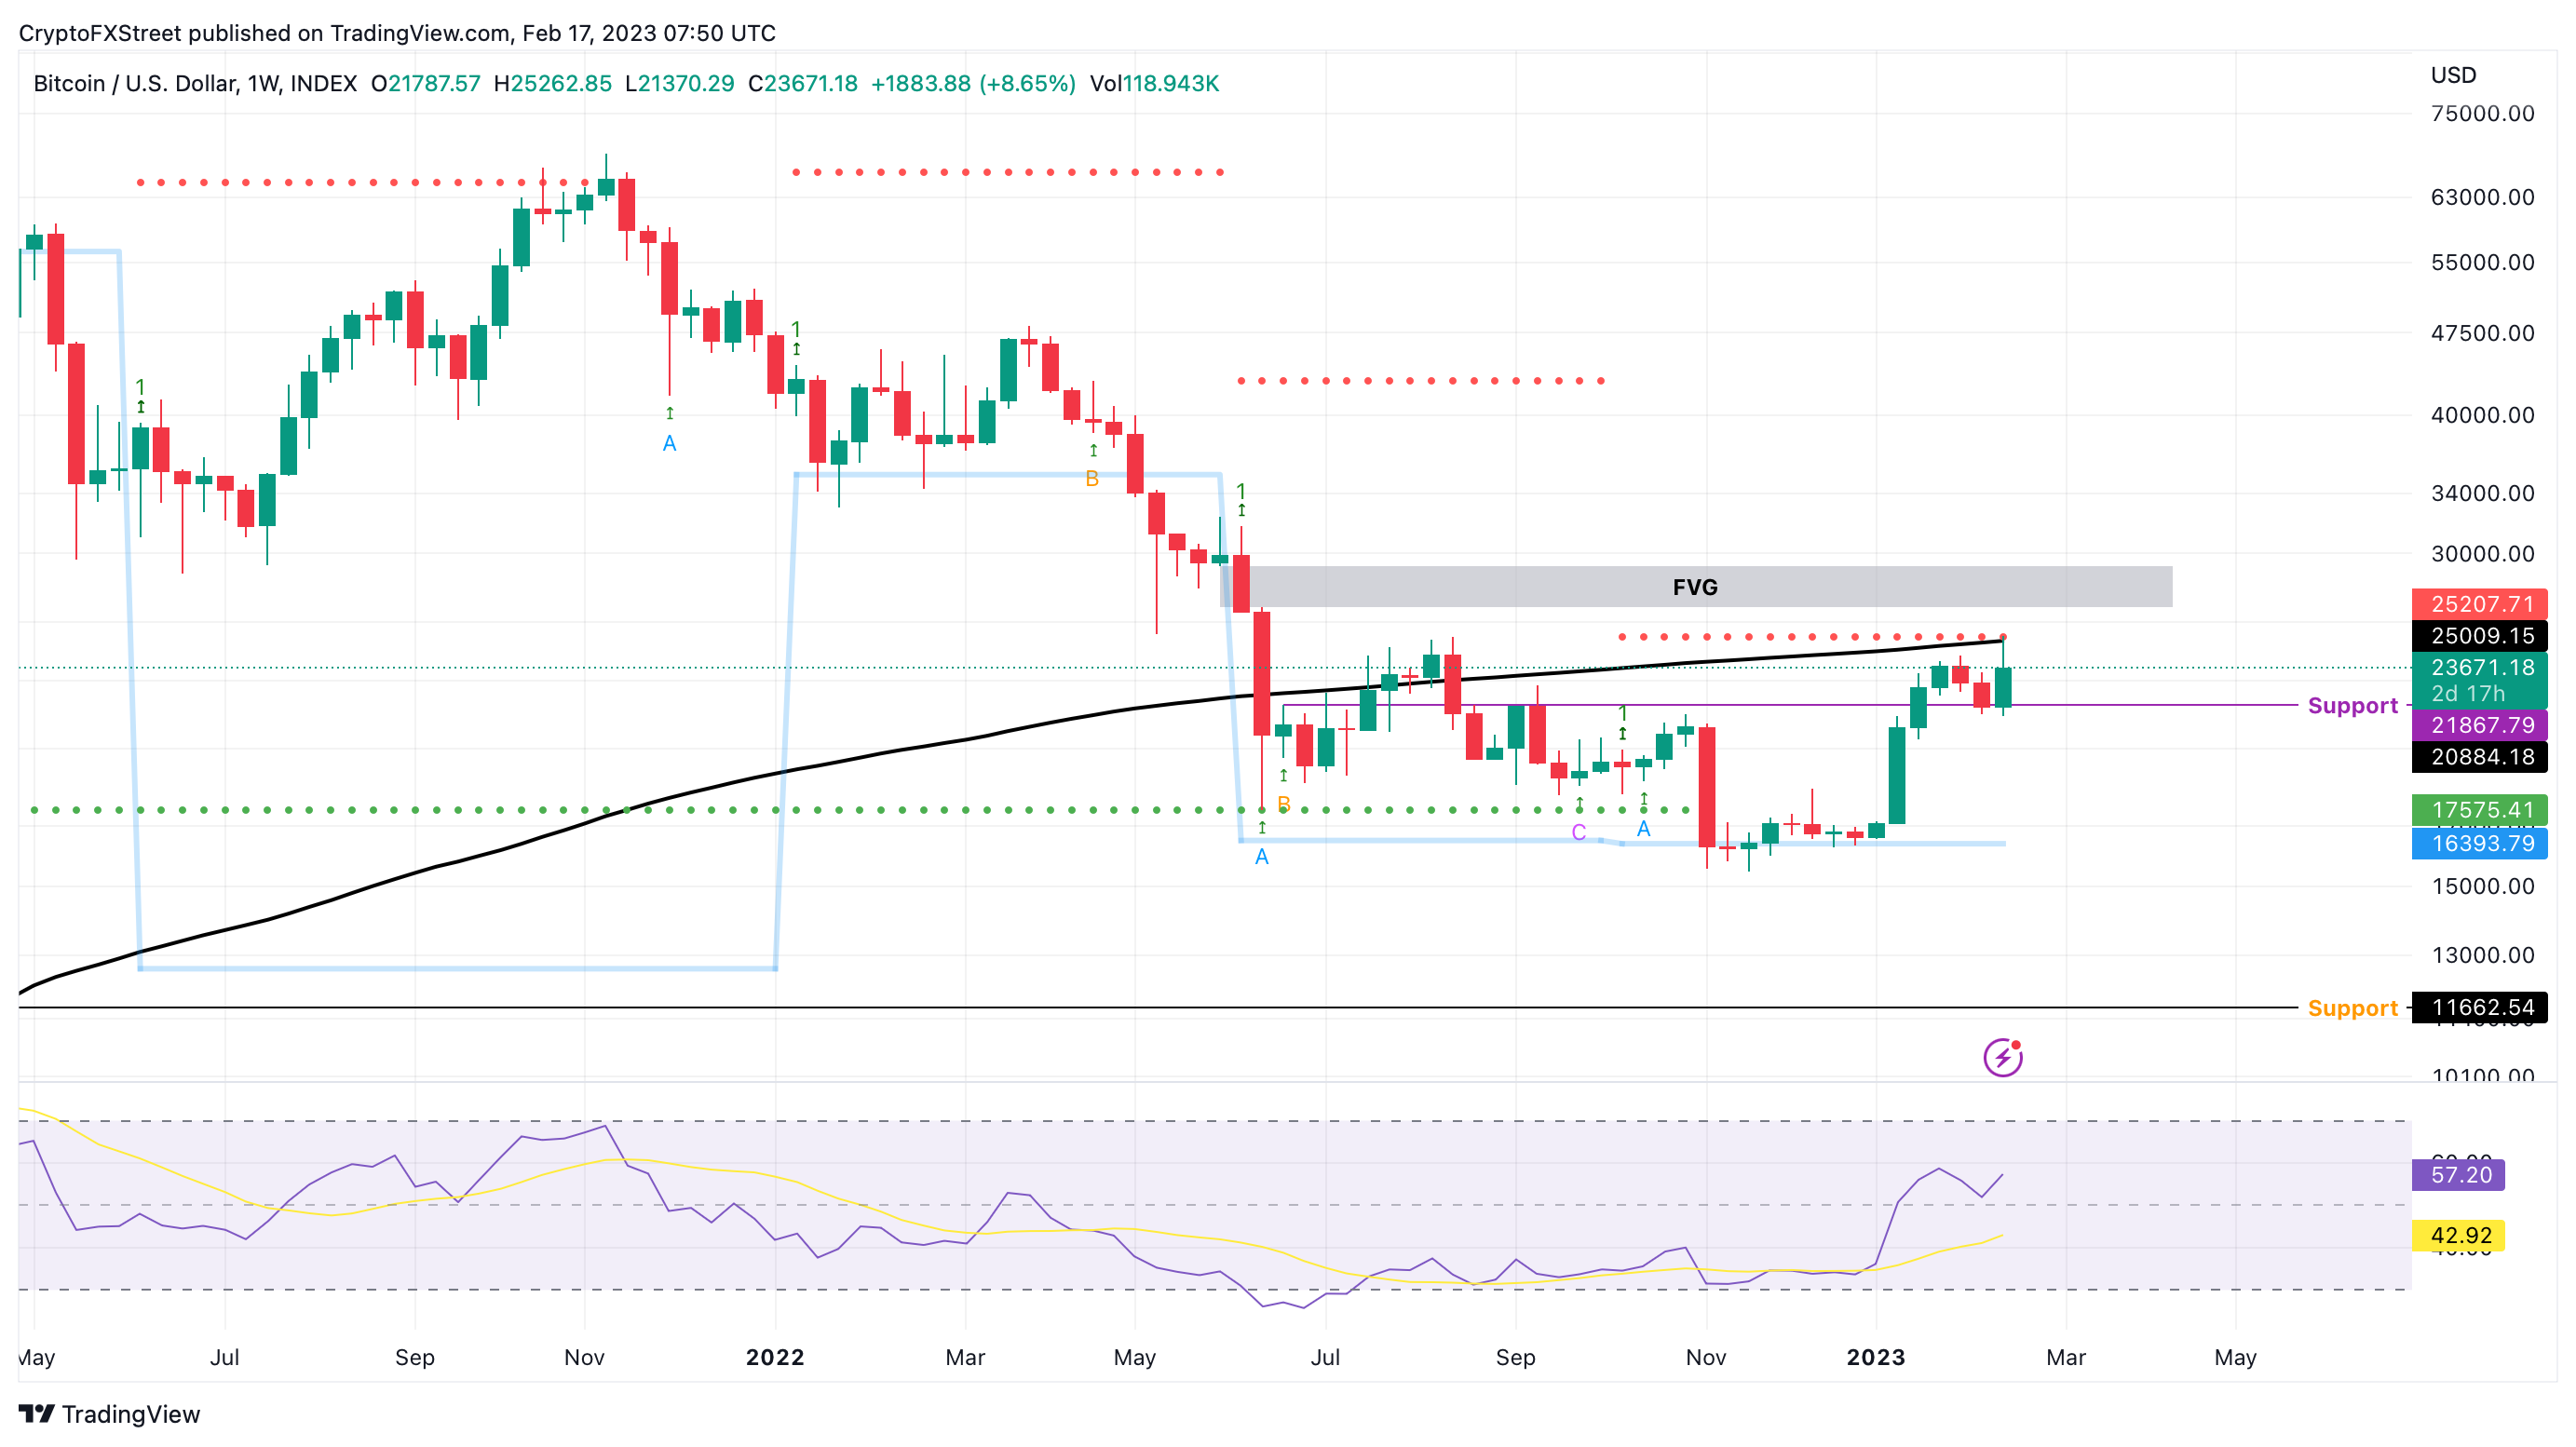
BTC/USDT 1-week chart
The three-day chart for Bitcoin price shows the same picture but with a slightly different view. The 2023 bull rally propelled the largest crypto by 48%, from $16,358 to $24,267. BTC attempted to breach this level after bouncing off the bullish breaker, as seen in the chart below. However, the momentum waned after sweeping the range high at $24,267 and tagging the $25,234 hurdle.
As noted in a previous article, a bullish breaker formation is formed after a supply zone formed between two key lower lows in a downtrend is flipped after a swift impulsive up move. If the above conditions are met, a retest of this newly formed bullish breaker usually results in a spike in buying pressure.
BTC’s downtrend around the US CPI announcement on February 5 tagged this bullish breaker’s upper limit at $21,470, which led to a surge in buying pressure. As a result, BTC climbed 18% in under 72 hours.
Unlike the weekly chart, which forecasts a bullish target of $43,000, the MRI indicator on the three-day chart predicts a much more palpable target of $30,700.
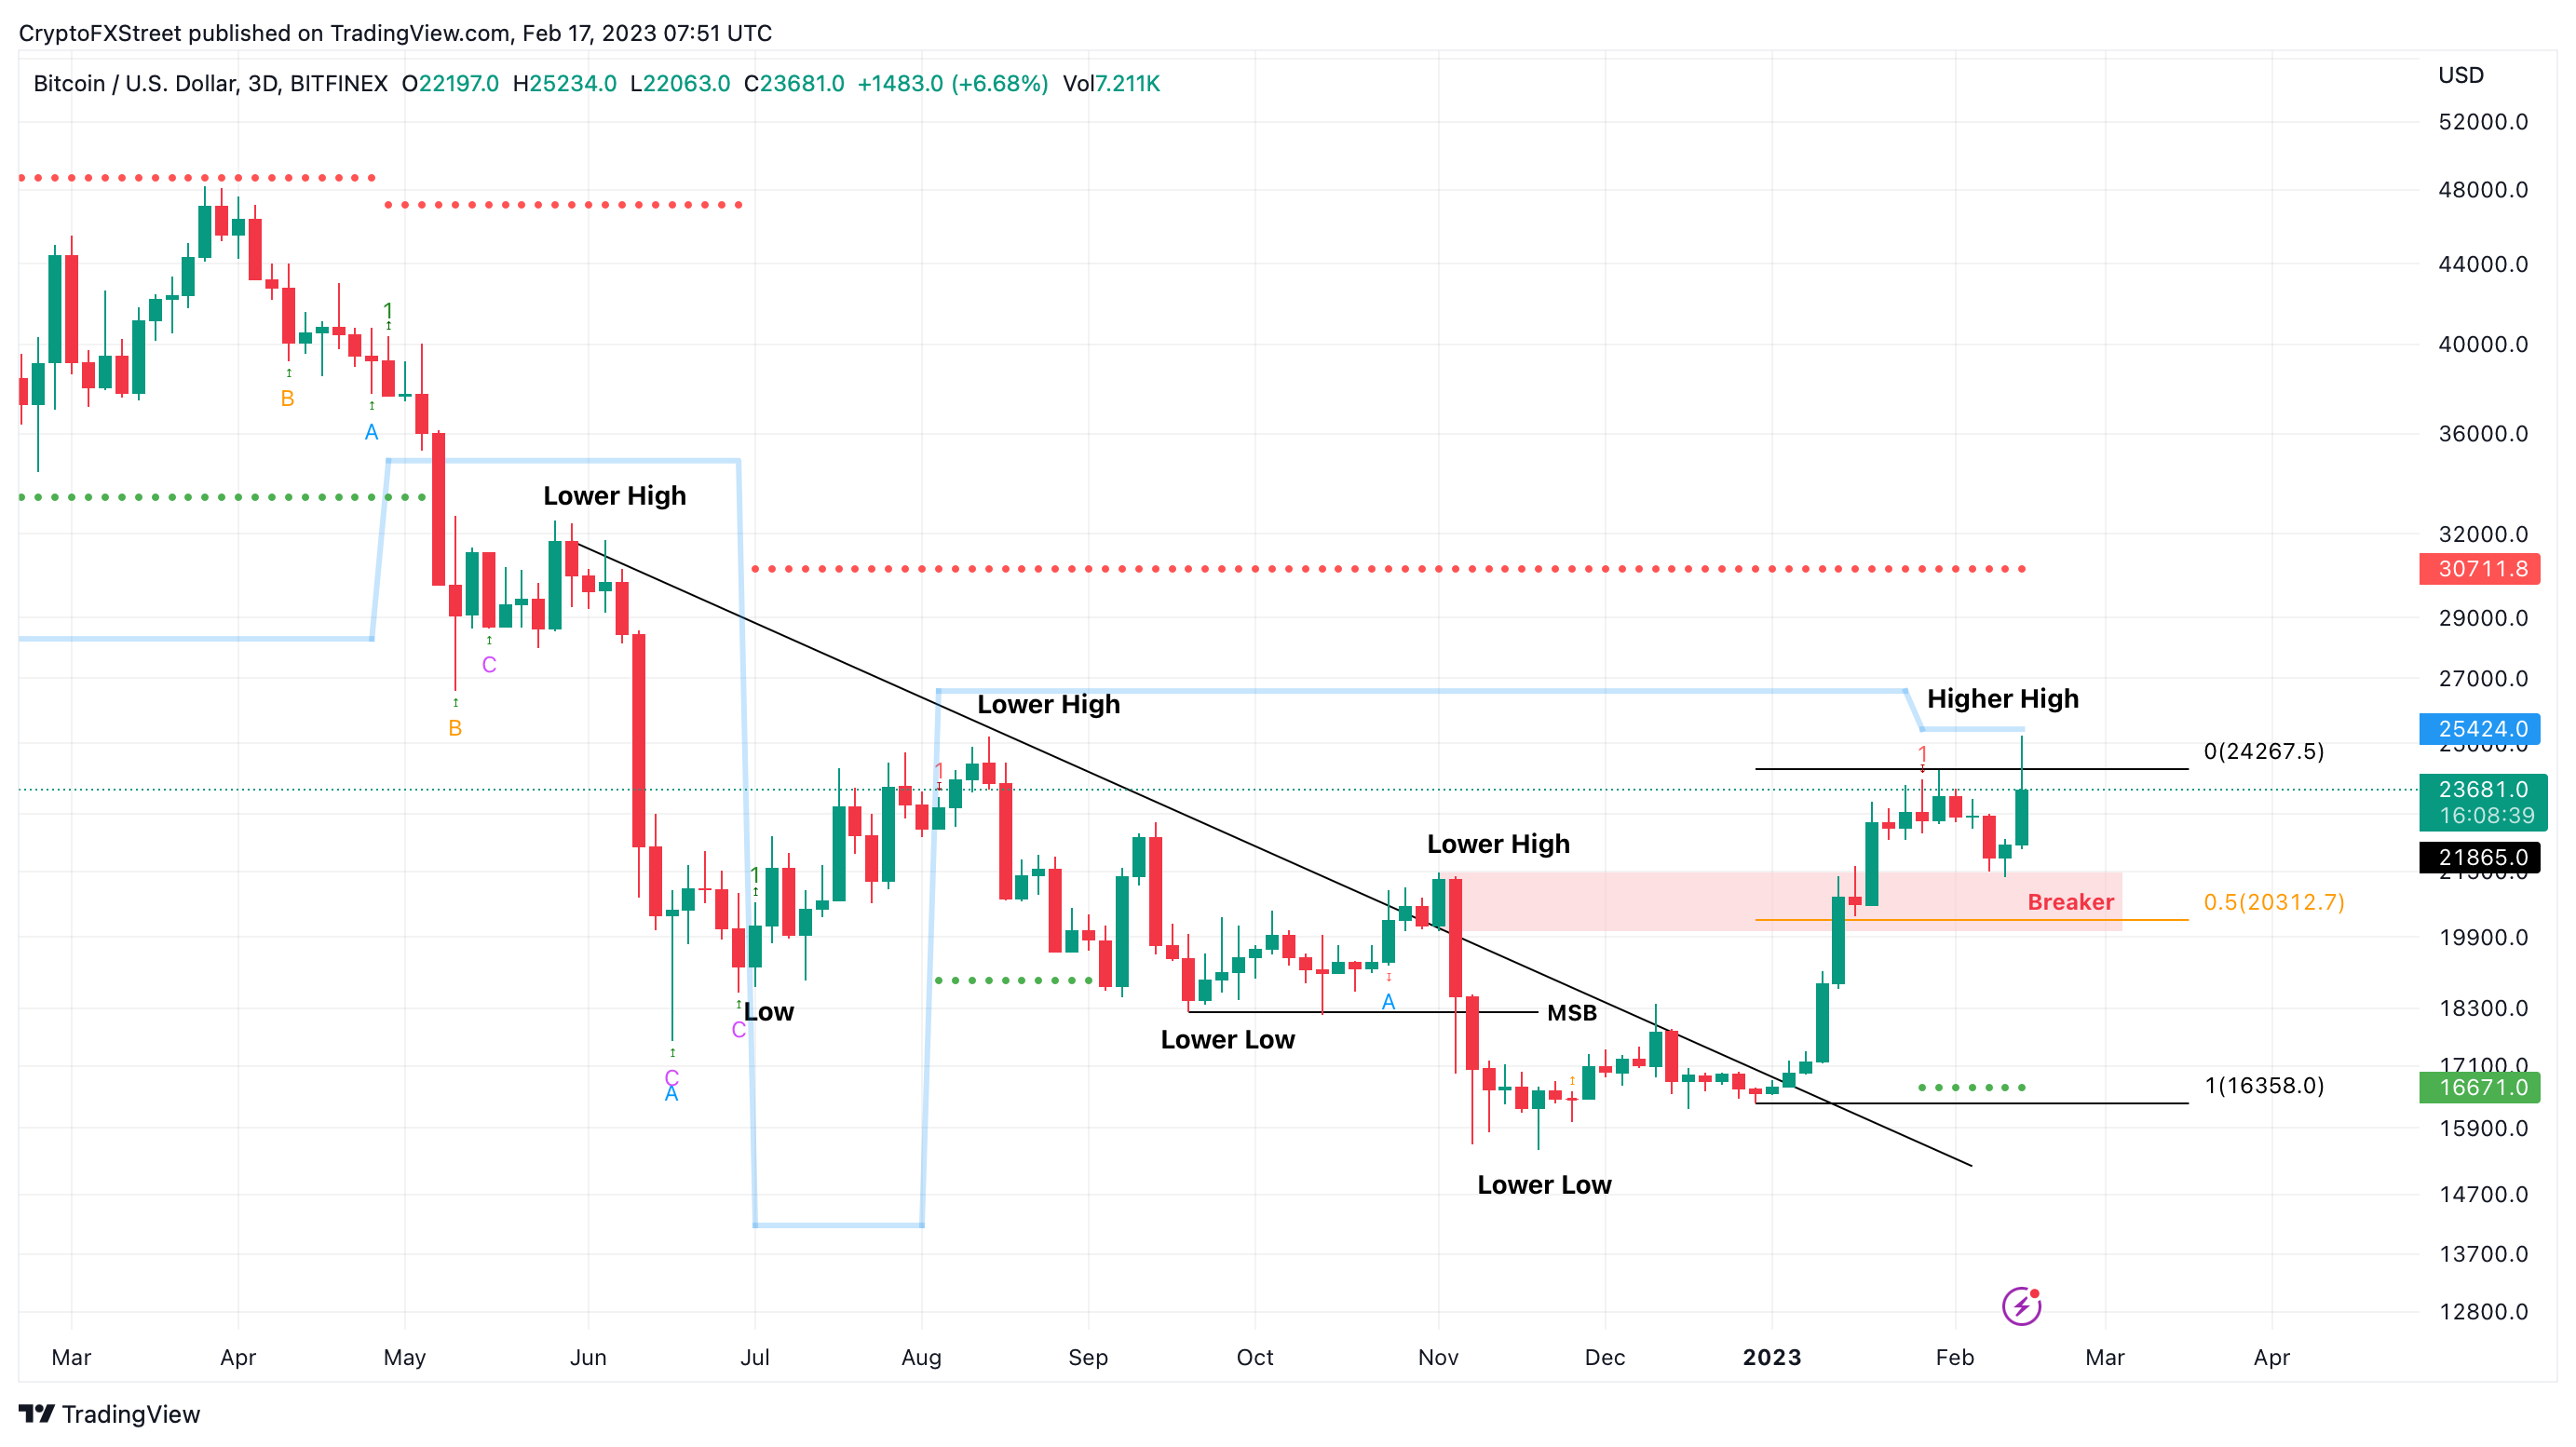
BTC/USDT 3-day chart
IntoTheBlock’s Global In/Out of the Money (GIOM) model shows that the immediate resistance cluster of underwater investors is thin. The next significant hurdle comes in at $30,766, which coincides with the targets seen on the three-day chart.
Here, 1.95 million addresses that purchased nearly 995,000 BTC are currently “Out of the Money.” Therefore, a move into this area could cause these holders to offload their holdings to break even, resisting the uptrend.
Hence, the possibility of a local top formation at $30,000 is high. The next cluster, as seen in the chart below, is around $40,000, where roughly 4.7 million addresses that bought nearly 2.1 million BTC are also underwater.
In case BTC overcomes the $30,000 psychological level, the next critical hurdle to book profits would be $40,000.
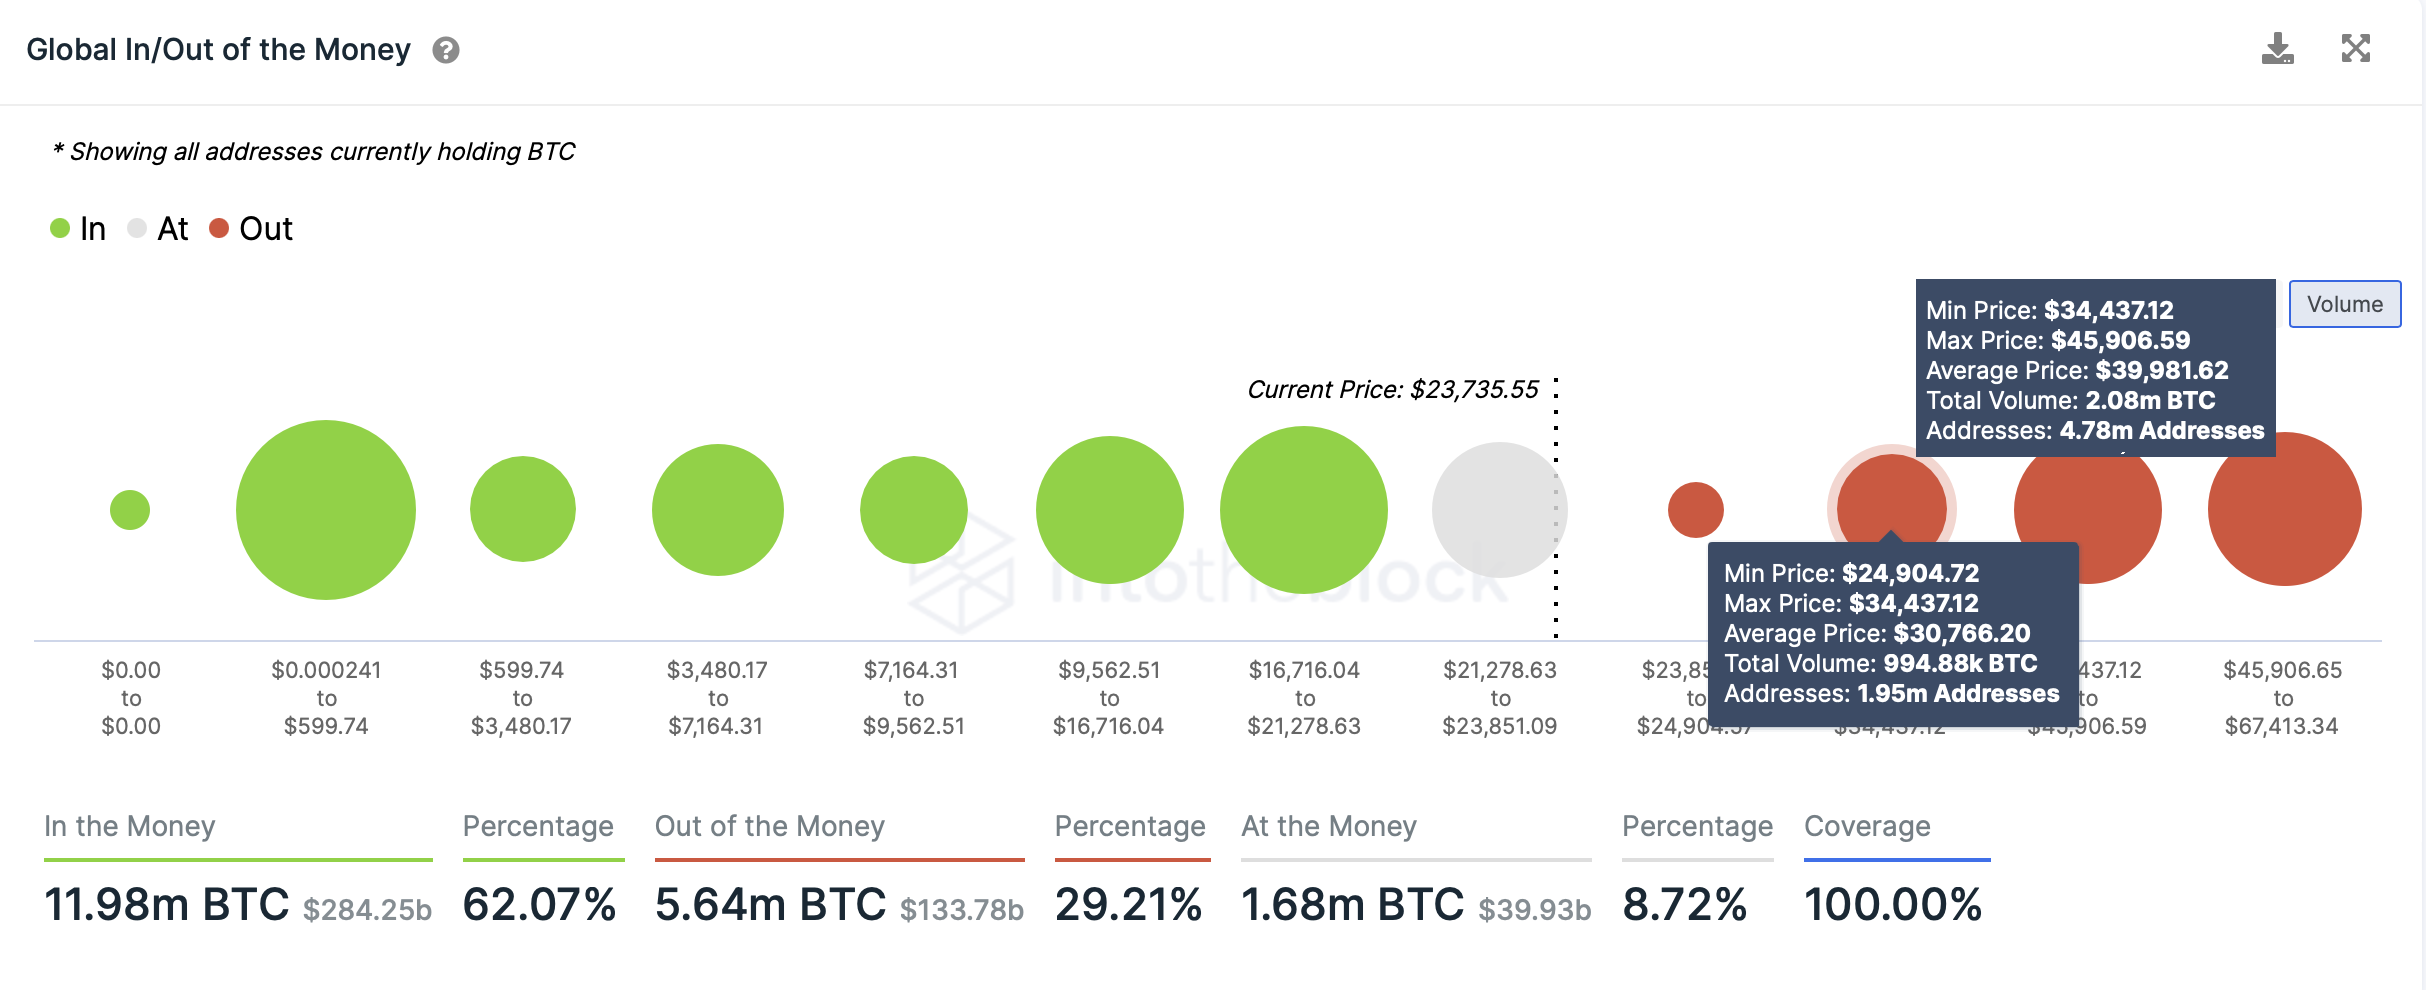
BTC GIOM
Network data sheds cautiously bullish signs
While the long-term outlook of Bitcoin price looks relatively safe, in the short-term, market participants, especially whales, seem to be booking profits after a retest of the $25,000 psychological level.
The Whale Transaction metric, which tracks transactions of investors worth $1 million or more, showed a spike after BTC rallied on February 16.
This uptick serves as a proxy for these high-net-worth individuals likely moving their holdings to book profits. Hence, such moves in the on-chain metrics are often used to identify local top formations.
 [15.01.17, 17 Feb, 2023]-638122285117197067.png)
Whale transactions
If this outlook persists and investors continue to realize gains, the selling pressure could cause a trend reversal.
The ensuing snowball effect could push Bitcoin price to produce a daily candlestick close below $21,867, thus creating a lower low and invalidating the bullish thesis.
Such a move would be fatal for bulls and trigger panic selling, driving the pioneer crypto down to $17,575, which is the next stable support level. A breakdown of this barrier could send BTC to test the $16,393 floor.
Information on these pages contains forward-looking statements that involve risks and uncertainties. Markets and instruments profiled on this page are for informational purposes only and should not in any way come across as a recommendation to buy or sell in these assets. You should do your own thorough research before making any investment decisions. FXStreet does not in any way guarantee that this information is free from mistakes, errors, or material misstatements. It also does not guarantee that this information is of a timely nature. Investing in Open Markets involves a great deal of risk, including the loss of all or a portion of your investment, as well as emotional distress. All risks, losses and costs associated with investing, including total loss of principal, are your responsibility. The views and opinions expressed in this article are those of the authors and do not necessarily reflect the official policy or position of FXStreet nor its advertisers. The author will not be held responsible for information that is found at the end of links posted on this page.
If not otherwise explicitly mentioned in the body of the article, at the time of writing, the author has no position in any stock mentioned in this article and no business relationship with any company mentioned. The author has not received compensation for writing this article, other than from FXStreet.
FXStreet and the author do not provide personalized recommendations. The author makes no representations as to the accuracy, completeness, or suitability of this information. FXStreet and the author will not be liable for any errors, omissions or any losses, injuries or damages arising from this information and its display or use. Errors and omissions excepted.
The author and FXStreet are not registered investment advisors and nothing in this article is intended to be investment advice.
Recommended Content
Editors’ Picks

Bitcoin, Ethereum and XRP steady as China slaps 125% tariff on US, weekend sell-off looming?
The Cryptocurrency market shows stability at the time of writing on Friday, with Bitcoin (BTC) holding steady at $82,584, Ethereum (ETH) at $1,569, and Ripple (XRP) maintaining its position above $2.00.

Bitcoin Weekly Forecast: Market uncertainty lingers, Trump’s 90-day tariff pause sparks modest recovery
Bitcoin price extends recovery to around $82,500 on Friday after dumping to a new year-to-date low of $74,508 to start the week. Market uncertainty remains high, leading to a massive shakeout, with total liquidations hitting $2.18 billion across crypto markets.

Bitcoin, Ethereum, Dogecoin and Cardano stabilze – Why crypto is in limbo
Bitcoin, Ethereum, Dogecoin and Cardano stabilize on Friday as crypto market capitalization steadies around $2.69 trillion. Crypto traders are recovering from the swing in token prices and the Monday bloodbath.

Can FTX’s 186,000 unstaked SOL dampen Solana price breakout hopes?
Solana price edges higher and trades at $117.31 at the time of writing on Friday, marking a 3.4% increase from the $112.80 open. The smart contracts token corrected lower the previous day, following a sharp recovery to $120 induced by US President Donald Trump’s 90-day tariff pause on Wednesday.
Bitcoin Weekly Forecast: Market uncertainty lingers, Trump’s 90-day tariff pause sparks modest recovery
Bitcoin (BTC) price extends recovery to around $82,500 on Friday after dumping to a new year-to-date low of $74,508 to start the week. Market uncertainty remains high, leading to a massive shakeout, with total liquidations hitting $2.18 billion across crypto markets.

The Best brokers to trade EUR/USD
SPONSORED Discover the top brokers for trading EUR/USD in 2025. Our list features brokers with competitive spreads, fast execution, and powerful platforms. Whether you're a beginner or an expert, find the right partner to navigate the dynamic Forex market.