Bitcoin Weekly Forecast: Fear seeps in as crypto market crashes for second time
- Bitcoin price plummets for the second time, sending the cryptocurrency market into a nosedive.
- Today’s drop comes hot on the heels of President Biden’s expected increase in capital gains tax for investors who earn more than $1 million.
- On-chain metrics portray an overall bullish outlook, while technicals suggest a potential top might be in.

Bitcoin price rally seems to be facing massive headwinds that have resulted in two egregious drops in under five days. Market participants are panic selling their holdings, sending the market into a tailspin.
Alleged crimes, tax proposals and mass hysteria
Bitcoin price witnesses two crashes in less than a week, causing panic among market participants. While the first seemed to be triggered by unfounded rumors, today’s sell-off comes as US President Biden is allegedly planning to increase the capital gains tax.
According to a Bloomberg report, the federal capital gains tax rate would be as high as 43.40%, which is nearly a 100% bump from what investors currently pay, 23.80%.
This news sent shockwaves across the financial and cryptocurrency markets alike. While the popular US indexes fell roughly 1%, Bitcoin, Ethereum and others have plummeted more than 10% on average.
Although the proposal is yet to be announced next week, investors have already started hitting the sell button, crashing the markets.
Bitcoin price slid through $50,000 for the first time since March 8 and dropped below the 100-daily Simple Moving Average after roughly 200 days, portraying the depth of investor panic.
The flagship cryptocurrency saw a similar turn of events last week when unfounded sources stated that the U.S. Treasures would go after financial institutions for money laundering using cryptocurrencies. As market participants quickly realized this was a fluke, the market-wide sell-off was attributed to the power outage in Xinjiang.
According to Willy Woo, this shutdown and other events occurring in tandem caused a massive collapse in Bitcoin price.
Regardless of what caused the drop, the last crash caused nearly $1 billion in liquidations, while the previous 12 hours have seen a whopping $3.23 billion worth of positions turned to dust.
Bitcoin price at wits’ end
Bitcoin price rose nearly 260% since December 1, 2020 to an all-time high at $64,986. While not everybody was ready or expecting this bull run, many hopped on the cryptocurrency bandwagon.
A trader who goes by the screen name “Dave the wave” has warned that Bitcoin price might be due for a correction. Based on his analysis, the pullback could extend down to mid-$20,000 levels. He also noted that BTC’s “multi-year cycles are breaking up as the market matures.”
Dave added that increasing irregularities in Bitcoin cycles shouldn’t “surprise” investors and suggested that,
... the single major volatile spike [and correction] may be broken up into a series of more minor volatile spikes [and corrections].
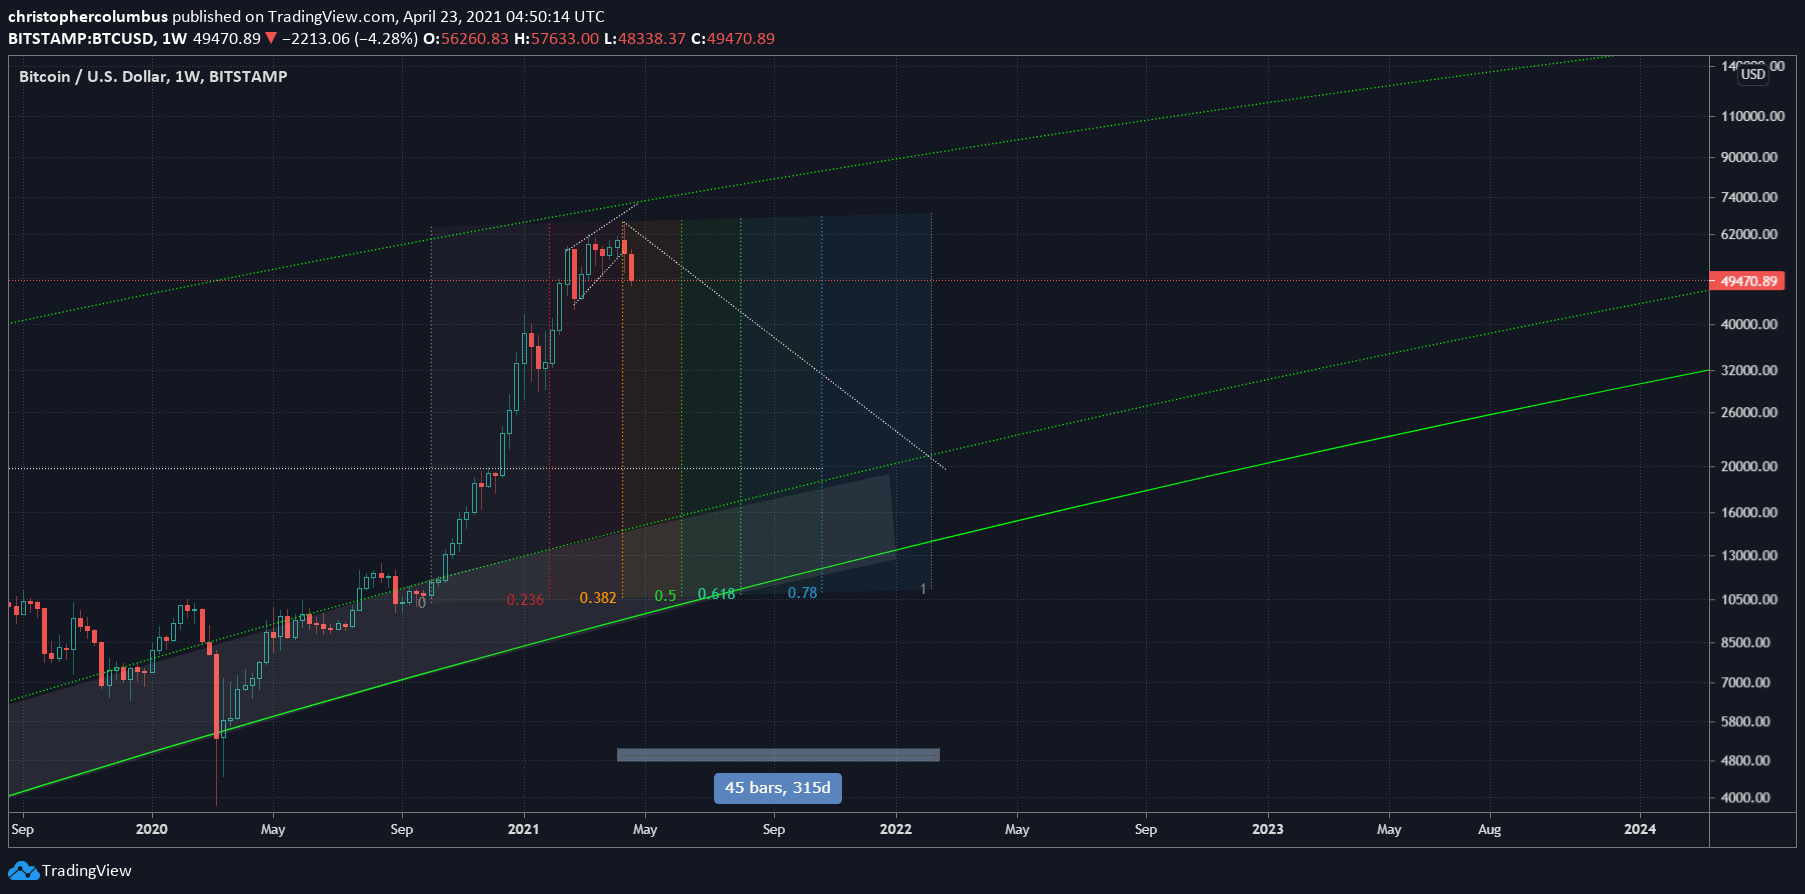
BTC/USD 1-week chart
According to Dave, a correction was due as Bitcoin price approached the curve connecting all previous cycle tops.
Additionally, the Moving Average Convergence Divergence (MACD) indicator had a bearish crossover on the weekly chart that had coincided with previous bull run tops, adding credence to the bearish thesis.
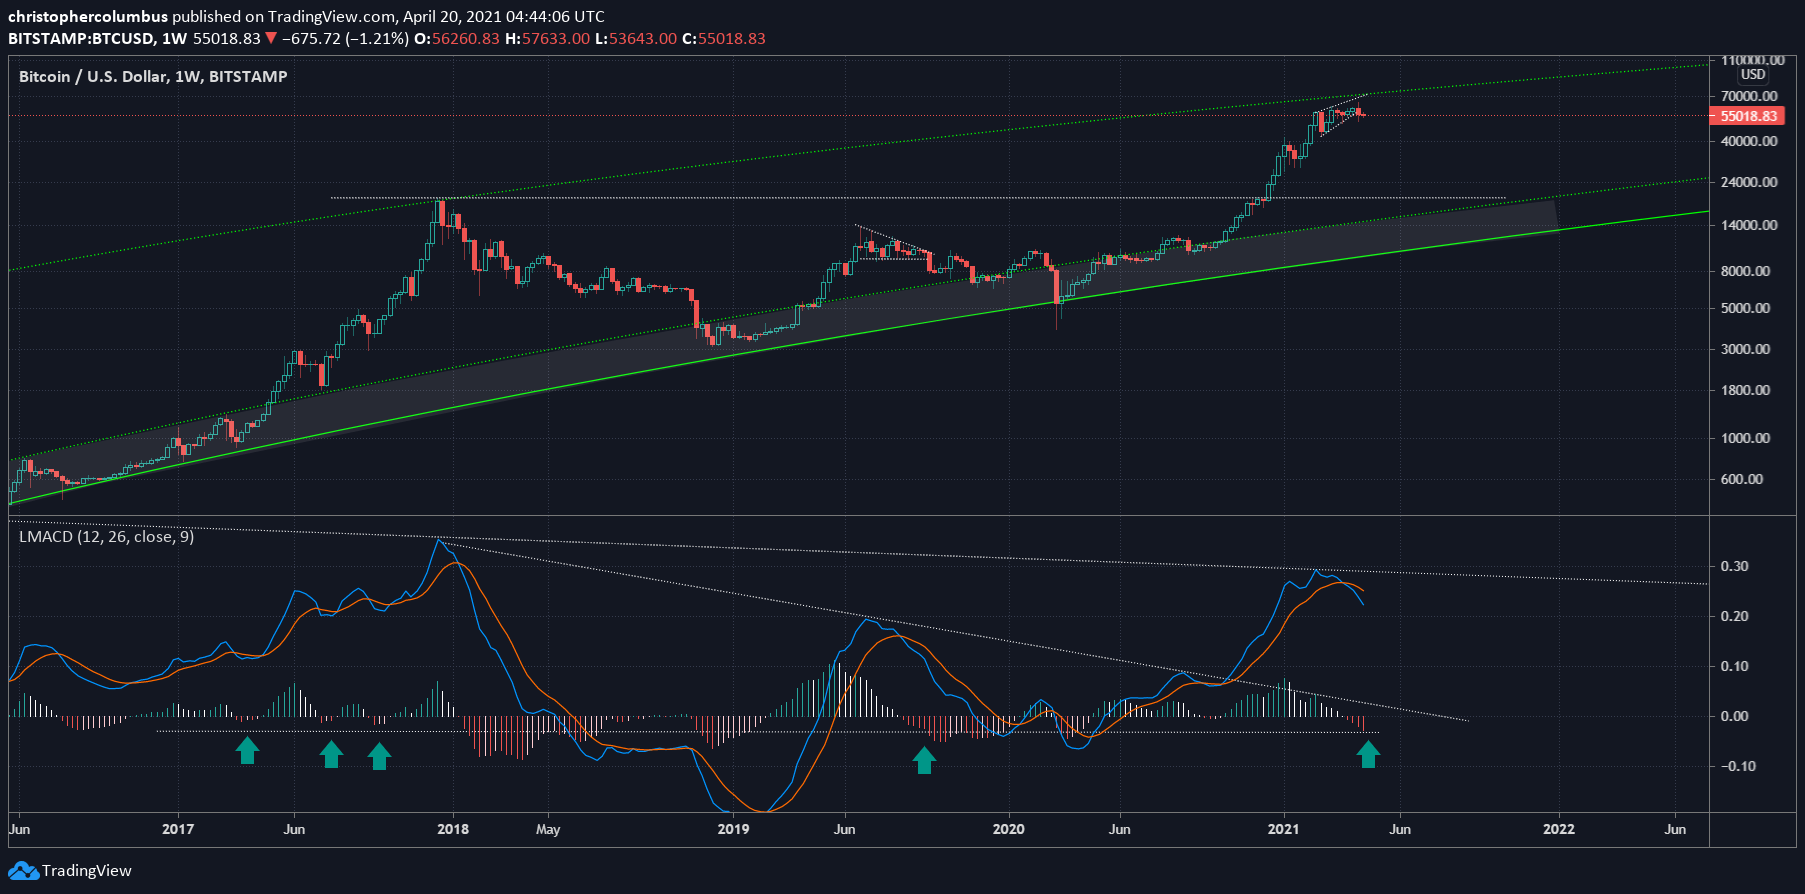
BTC/USD 1-week chart
While things seem grim from Dave’s point of view, there is a possibility that the Bitcoin cycles are shifting to a new paradigm, especially considering increased capital inflow and institutional adoption.
On-chain metrics remain unwavering
Funding rates are crucial in determining when a market is overheated. A high funding rate suggests that the crowd is optimistic about a particular asset and expects the market value to increase. Hence, going with the consensus can be an expensive trade.
Of late, Bitcoin’s funding rates were unsustainably high, reaching 0.3171% on several crypto exchanges. A volatile move that pushed BTC against the general agreement caused mass liquidations of long positions, resetting the funding rate back to zero.
Despite the weekend crash, this metric started to gain traction as prices recovered to $54,000. However, today’s sell-off has pushed the OKEx exchange’s perpetual funding rates into negative territory, while others follow suit, at least until Bitcoin price continues to freefall.
Hence, this reset provides an excellent opportunity for Bitcoin price to make a comeback.
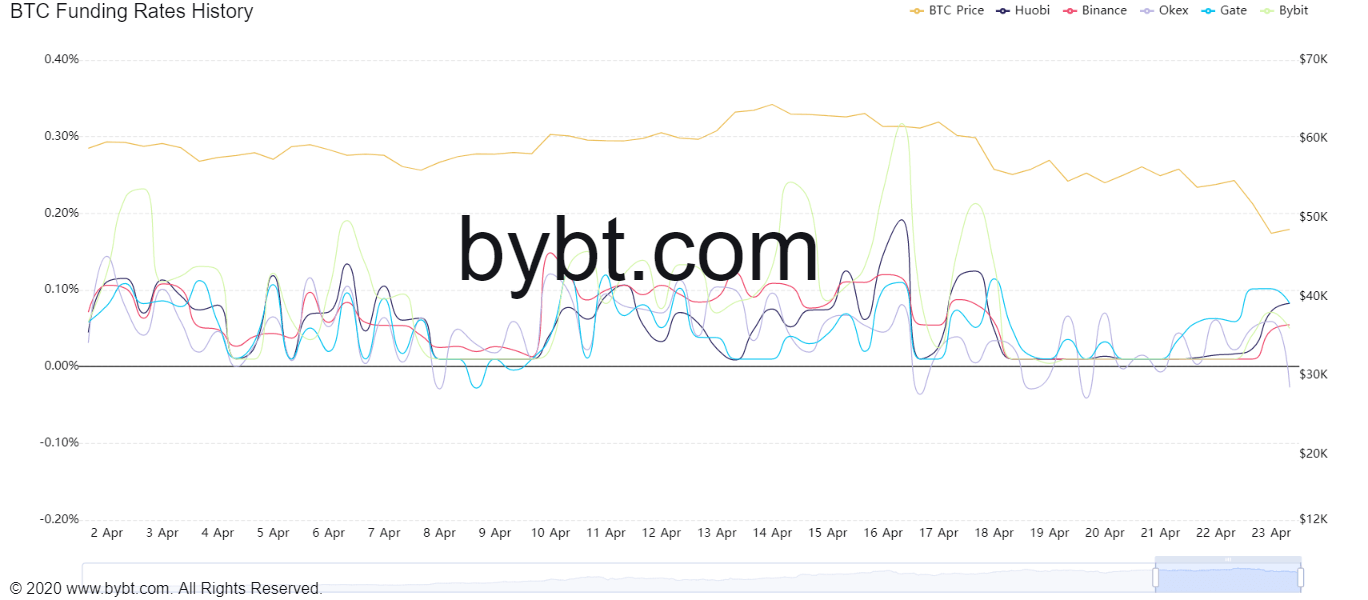
Bitcoin funding rate chart
Tracking the number of users in profit based on Unspent Transaction Outputs (UTXO) provides a clear picture of the percentage of investors in profit. Santiment’s MVRV model, which tracks this, is currently at -15.85%, suggesting that a large portion of BTC investors would incur a loss if they were to sell today.
Such low levels in the 30-day MVRV were last seen during the pandemic-induced crash of March 2020, when Bitcoin price plunged to roughly $4,000.
The 30-day MVRV adds a semblance of hope when the entire market is red, suggesting that BTC is undervalued at the current levels.
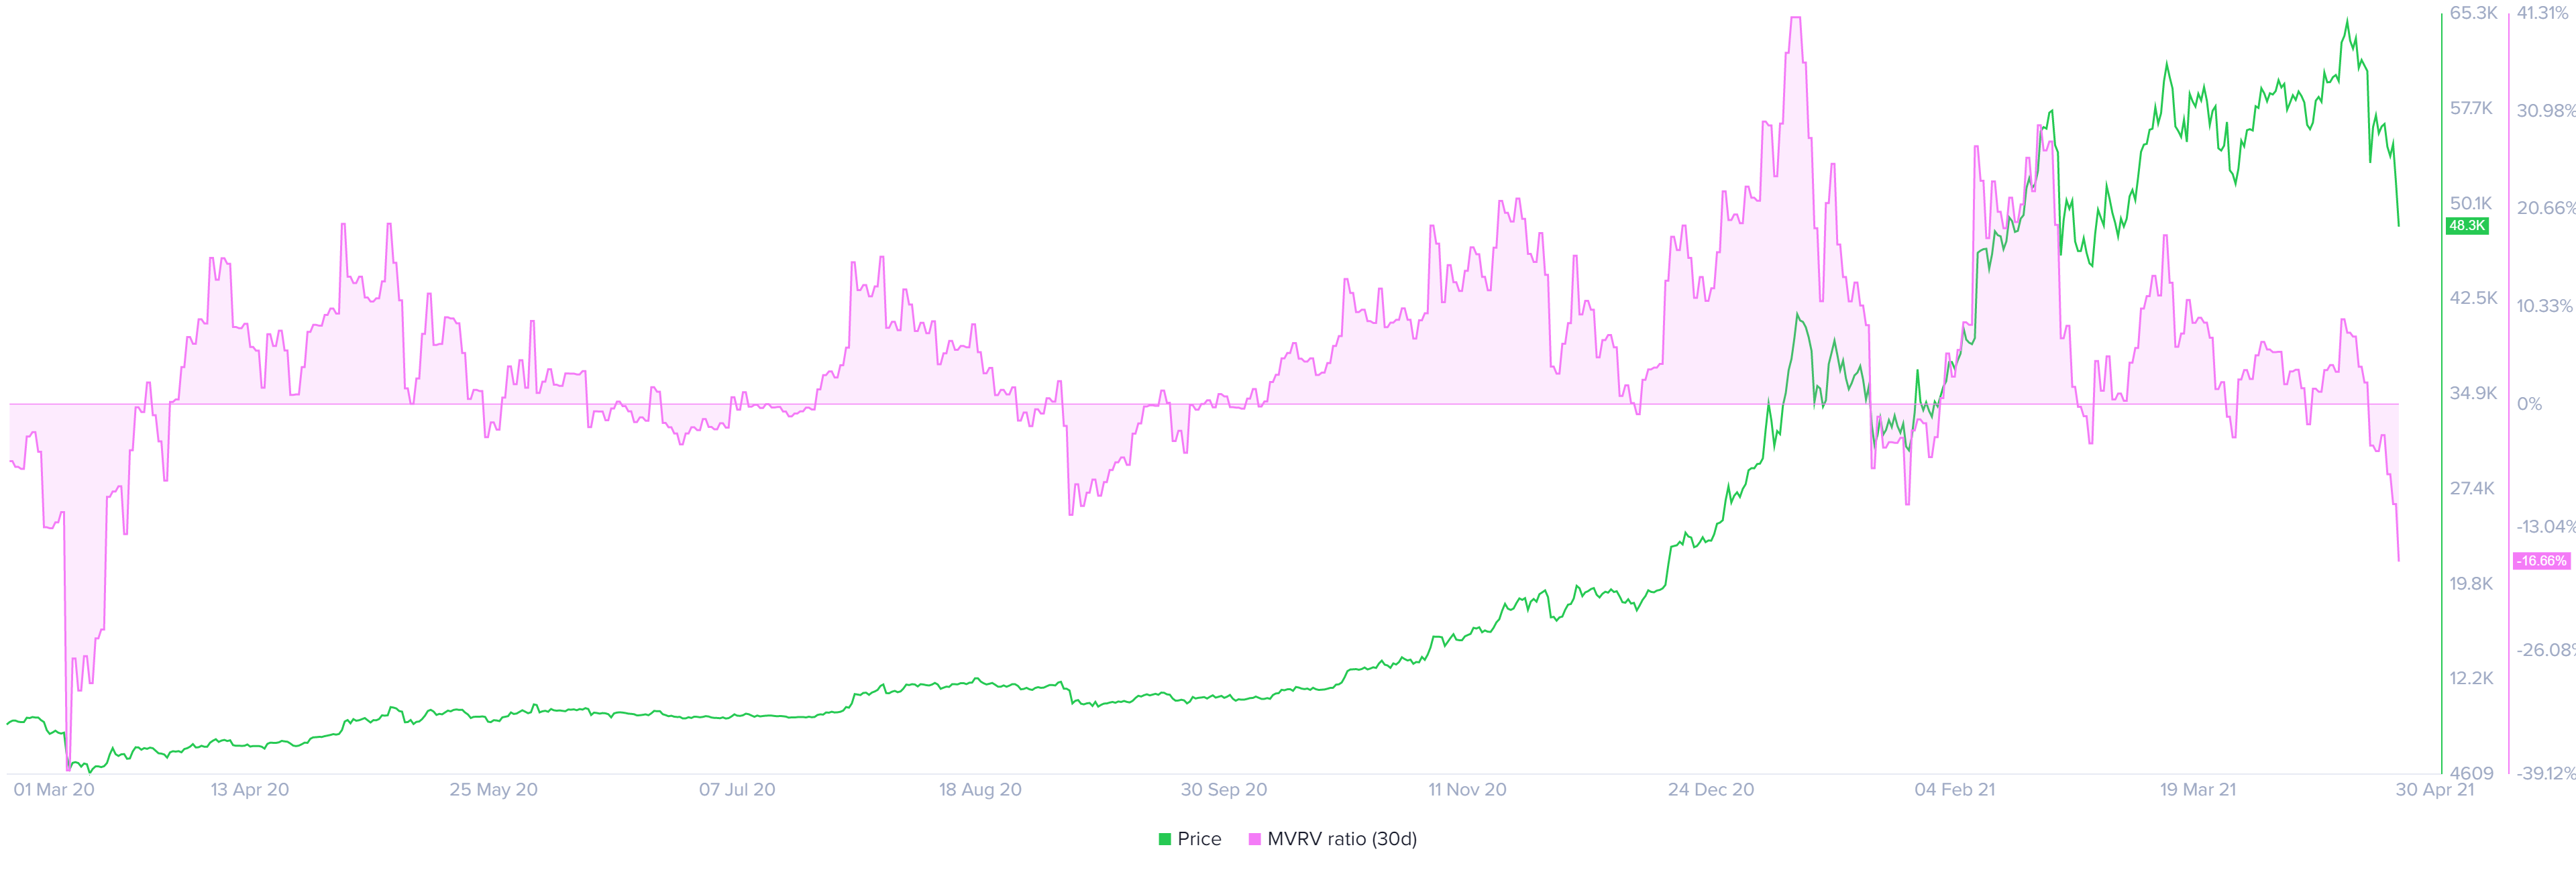
Bitcoin MVRV 30-day chart
Over the past two months, the number of BTC tokens held on exchanges dropped from 3.02 to 2.41 million. The 20% reduction indicates that users are storing their holdings off centralized entities. This market behavior suggests that investors are bullish on Bitcoin price and do not care about the short-term volatility.
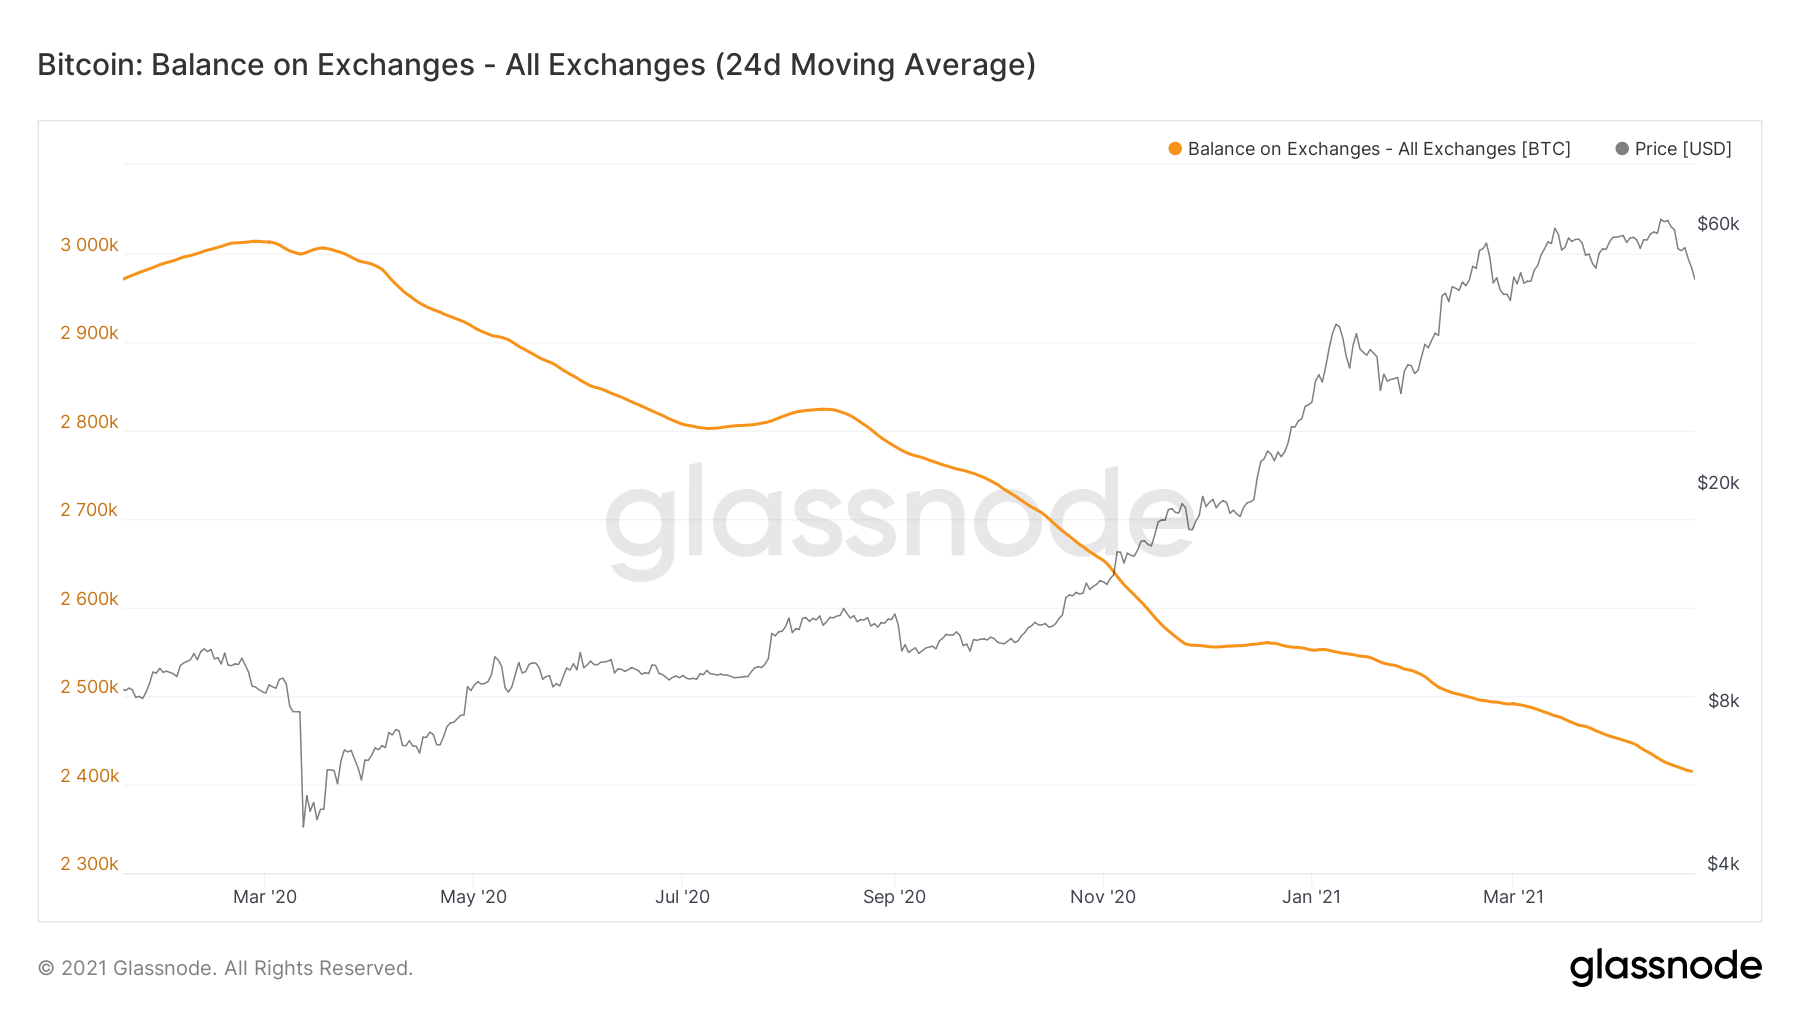
Bitcoin supply on exchanges chart
All in all, the current Bitcoin price drop is concerning, no doubt. However, the massive inflow of institutional capital into the space combined with a large number of publicly traded companies adding BTC into their treasuries proves that the long-term narrative remains bullish.
Author

Akash Girimath
FXStreet
Akash Girimath is a Mechanical Engineer interested in the chaos of the financial markets. Trying to make sense of this convoluted yet fascinating space, he switched his engineering job to become a crypto reporter and analyst.


