Bitcoin Weekly Forecast: Everything you need to know about BTC 200-week MA
- Bitcoin price is trading below the 200-week SMA again as the week nears an end.
- A breakdown of this historically significant support could lead to another 50% crash.
- If history is any indicator, a bounce here that produces a higher high above $52,000 could trigger a new bull run for BTC.

Bitcoin price has gone through turbulent times over the last few months. From reaching a new all-time high to hitting yearly lows and revisiting levels since 2020, the crypto markets have been extremely volatile.
With its current position, BTC could be preparing to wreak havoc by triggering another brutal leg down or a surprising run-up. The market participants are in shock and will get trampled on regardless of the direction the big crypto takes.
Bitcoin price and historic significance
Bitcoin price, in its 12-year history, has tagged the 200-week Simple Moving Average (SMA) five times. Out of these five times, only six weekly candlesticks have closed below this barrier and have resulted in quick recoveries above it.
Interestingly, every retest was followed by the end of the bear market and the start of a new cycle. Another noteworthy observation is that any deviations below the 200-week SMA have not exceeded 30% and have been bought up quickly.
For the situation to flip bullish three things should happen in the order given below:
- Bitcoin price needs to recover above the 200-week SMA.
- Produce a higher high above the last swing high at $52,000 on a weekly time frame.
- Sustain this bullish outlook by producing a higher low relative to the previous swing low.
If these steps occur in the right order, things will definitely flip bullish for Bitcoin. However, this run-up could be unsustainable due to two reasons.
- Bitcoin price is highly correlated with the stock market, which is in turmoil.
- The geopolitical and macroeconomic outlook is worsening and is on the brink of a recession.
Hence, even a recovery on BTC’s part could still come undone if the world slips into a recession.
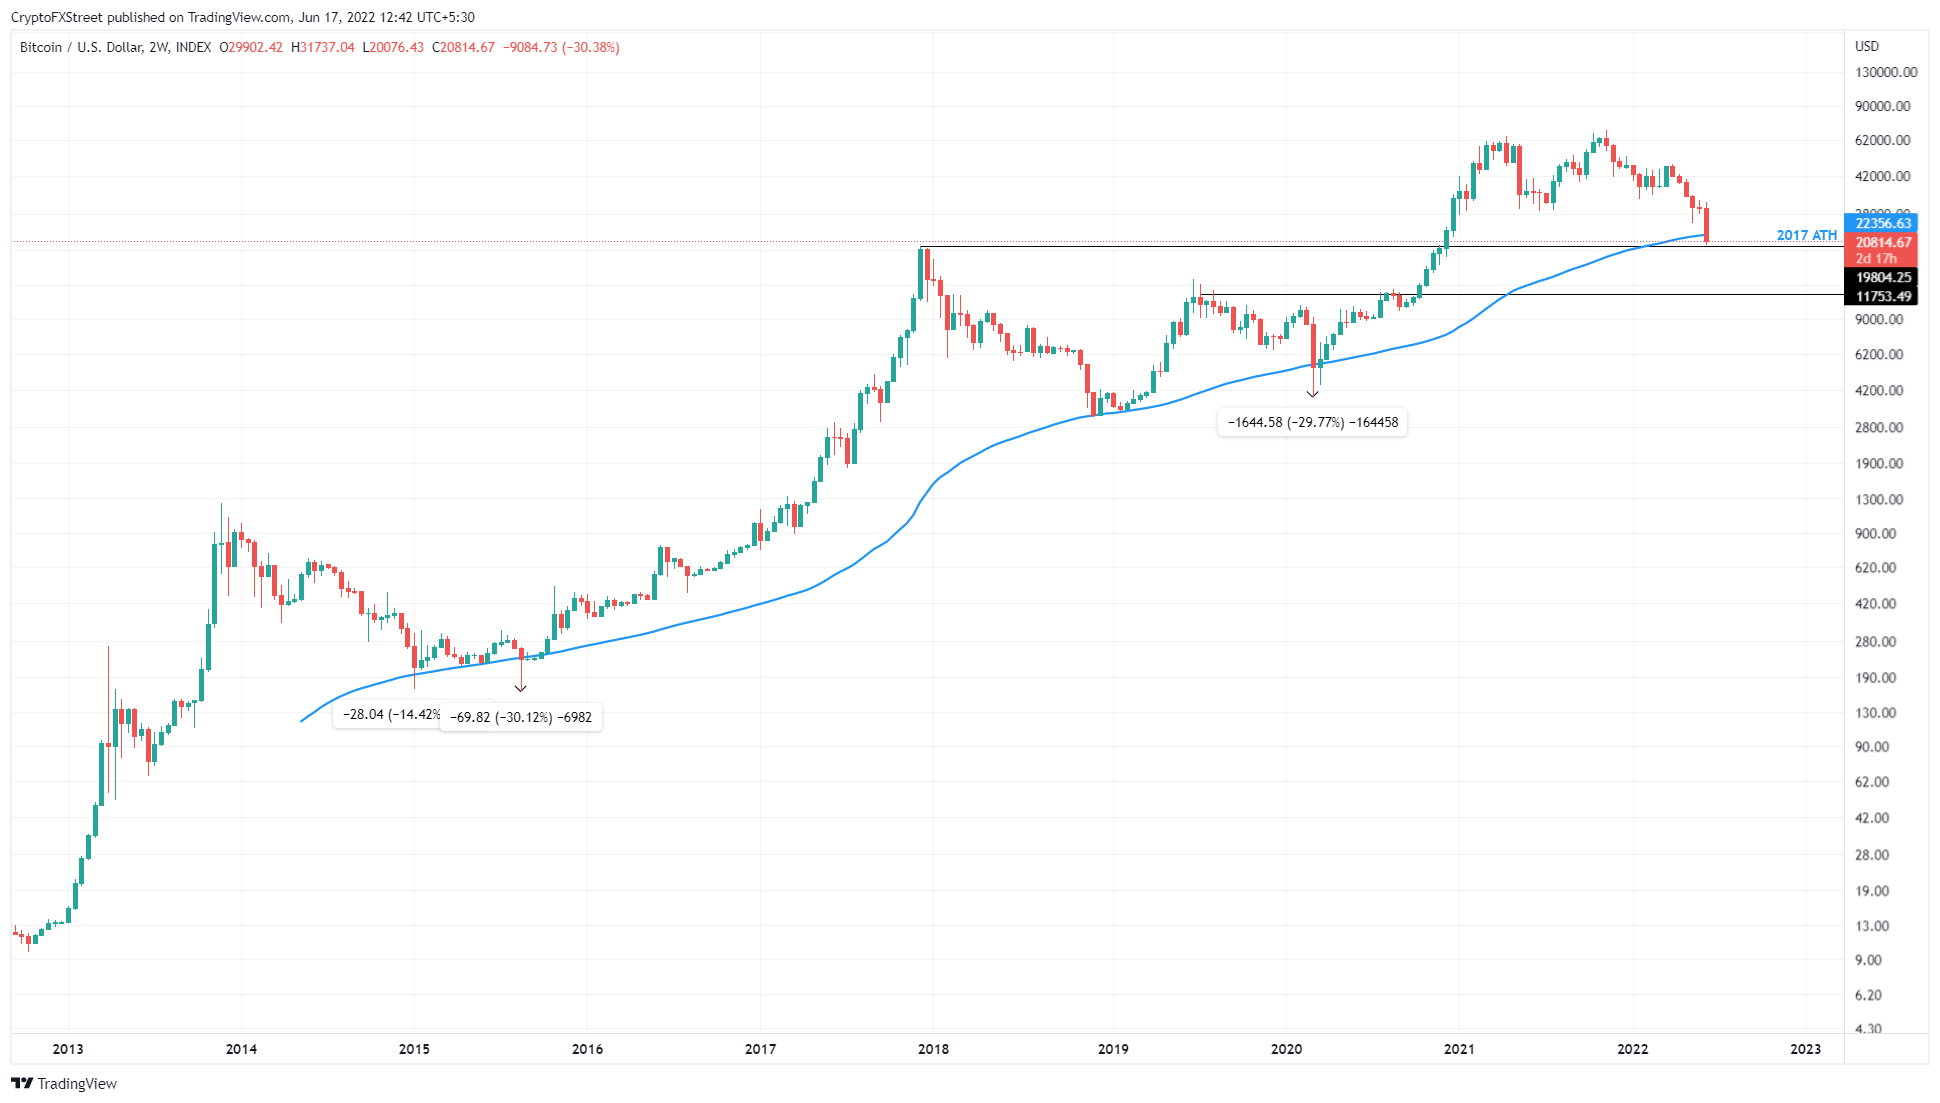
BTC/USD 2-week chart
The dark side of 200-week SMA
Painting a picture of the worst-case scenario is Arthur Hayes, the founder of BitMEX. He explained that the option flows data from Deribit showed that the open interest is at $20,000 for BTC and $1,000 for ETH.
He also adds that “there are massive otc structured products centered around those strikes as well.”
Hayes detailed that a breakdown of these levels could trigger a catastrophic crash for the crypto ecosystem.
5/
— Arthur Hayes (@CryptoHayes) June 14, 2022
As far as the charts go, you better get out your Lord Satoshi prayer book, and hope the lord shows kindness on the soul of the #crypto markets. Bc if these levels break, you might as well shut down your computer bc your charts will be useless for a while.
While history serves as an example and provides insight, things do not necessarily have to repeat. At the time of writing, the Bitcoin price is trading well below the 200-week SMA and is showing no immediate signs of recovery so far.
The weekly chart for Bitcoin price shows that the last line of defense is around $19,804, which is the 2017 all-time high. Interestingly, this level coincides with the high volume node seen in the volume profile, extending between March 2020 and June 2022.
Hence, a breakdown of the $19,804 level combined with the worsening macroeconomic situations, could catalyze another leg down that will lead to a 50% drop to $12,383. The support level present here extends from $12,383 to $11,753.
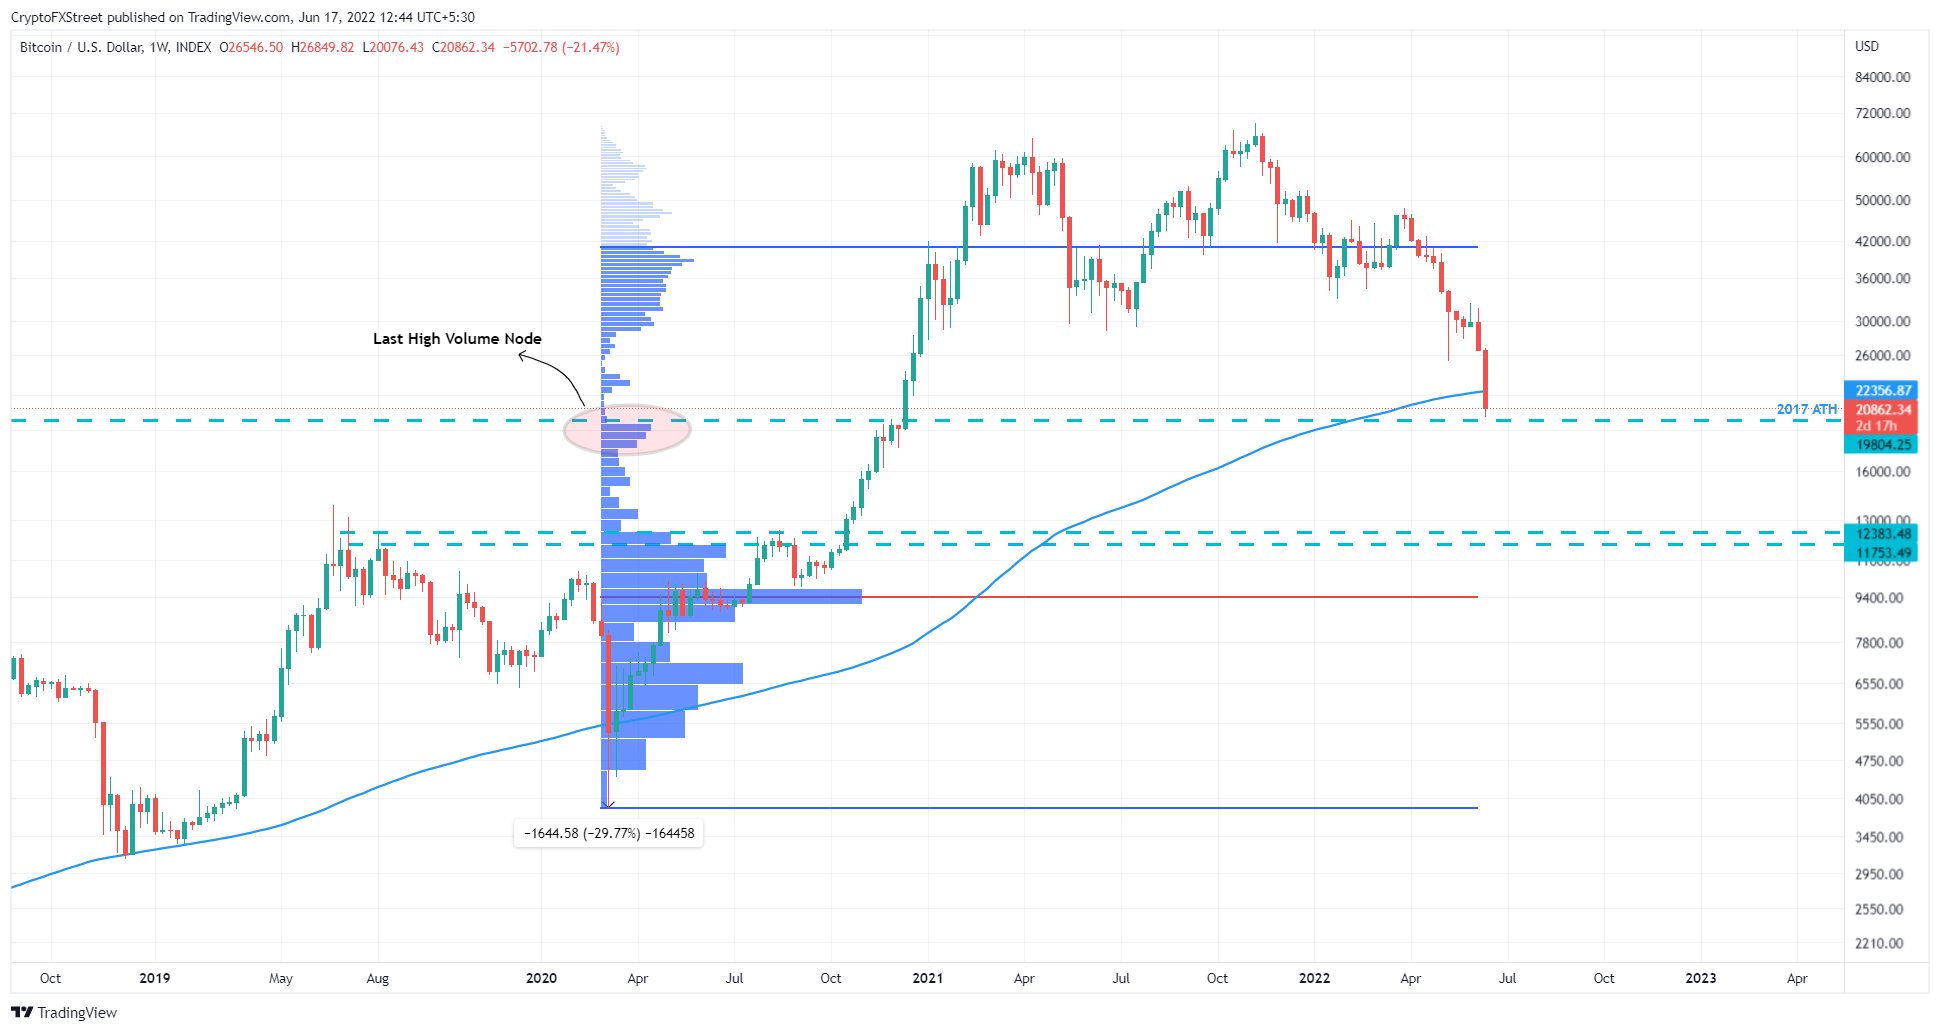
BTC/USD 1-week chart
Hence, investors should be careful in buying the dips despite the allure of Bitcoin price dropping 58% in the last two and a half months. Furthermore, the volume profile for BTC extending from March 2020 to June 2022, shows that the Point of Control (POC) or the highest traded point is at $9,467.
Therefore, in an extremely bearish case, if things continue to cascade, the Bitcoin price could venture below the $11,753 support level and tag the POC.
Author

Akash Girimath
FXStreet
Akash Girimath is a Mechanical Engineer interested in the chaos of the financial markets. Trying to make sense of this convoluted yet fascinating space, he switched his engineering job to become a crypto reporter and analyst.


