Bitcoin Weekly Forecast: Crypto markets bullish no more?
- Bitcoin price slips 5% lower, reacting to multiple bearish signals developed over the week.
- This profit-taking phase has pushed holders to break even, alleviating the sell-side pressure for the time being.
- While the short-term outlook is pessimistic, a decisive flip of the $25,000 hurdle into a support floor could invalidate the bearish thesis.

Bitcoin price is trying its best to break free from the macro bearish regime, and the 2023 rally is a testament to this. Although the 48% upswing has slowed, it is still too early to say whether this is just a minor pullback or a resumption of the longer-term bear trend.
On-chain metrics reveal that the built-up pressure due to this explosive rally has now been released, which creates a leveled playing field for bears and bulls.
Bitcoin price gets a fresh start
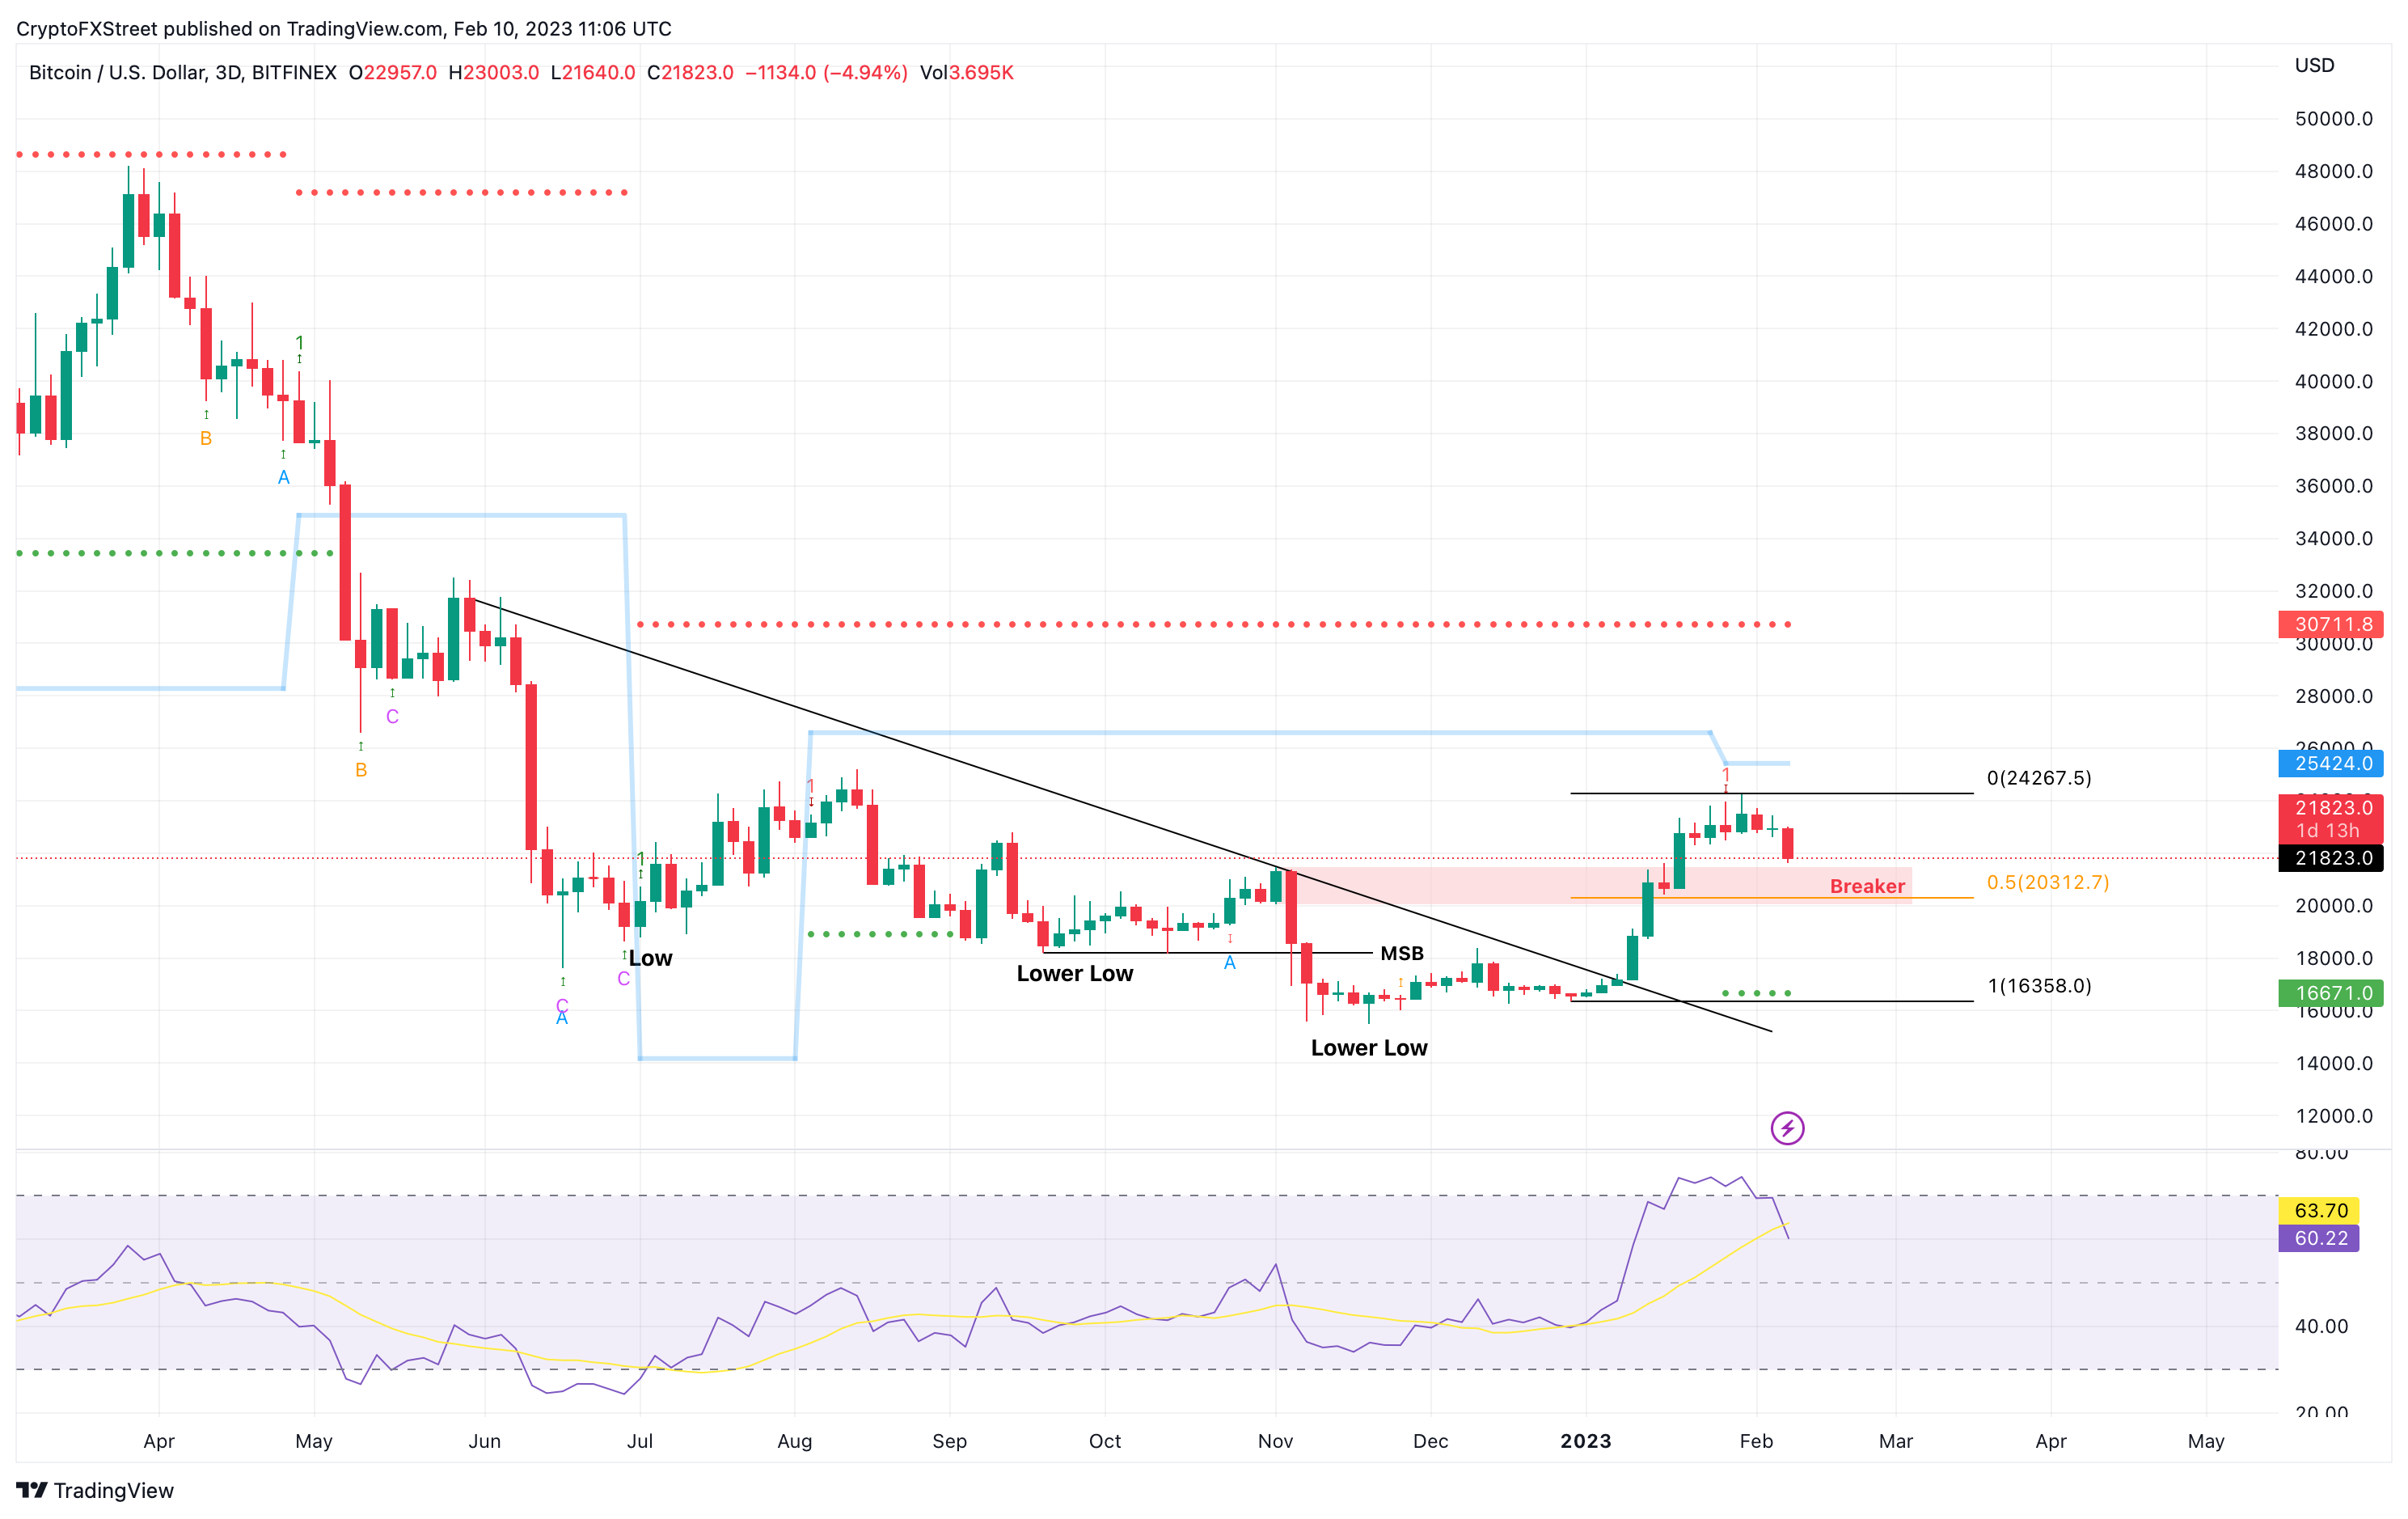
The three-day chart for Bitcoin price is favored since it combines both the short-term and long-term outlooks clearly. The Momentum Reversal Indicator’s (MRI) red ‘one’ sell signal formed on January 28 seems to have marked a local top. Since then, BTC has shed 9.69%.
The $20,312 level is the midpoint of the 48% run-up Bitcoin price experienced between December 30, 2022, and January 31, 2023. This support level is pivotal in determining what happens to BTC.
Additionally, Bitcoin price is approaching a bullish breaker, extending from $20,052 to $21,470, formed on November 3, 2022. A bullish breaker formation has two key requirements - firstly, that a supply zone forms between two key lower lows in a downtend, and that this supply zone is then breached in a swift impulsive move, as happened during January's strong rally.
If the above conditions are met, a retest of this newly formed bullish breaker usually results in a spike in buying pressure. Currently, Bitcoin price has not tagged this level yet, but if it does, a retest could see BTC bounce to $22,600.
For the bearish outlook, both short-term and long-term, to continue, Bitcoin price needs to flip the $20,312 level into a resistance barrier. Such a move would invalidate the bullish breaker and confirm the presence of sellers. In such a case, the pioneer crypto could retest the $18,210 support level.
BTC/USDT 1-day chart
On-chain metrics suggest the worst could be behind us
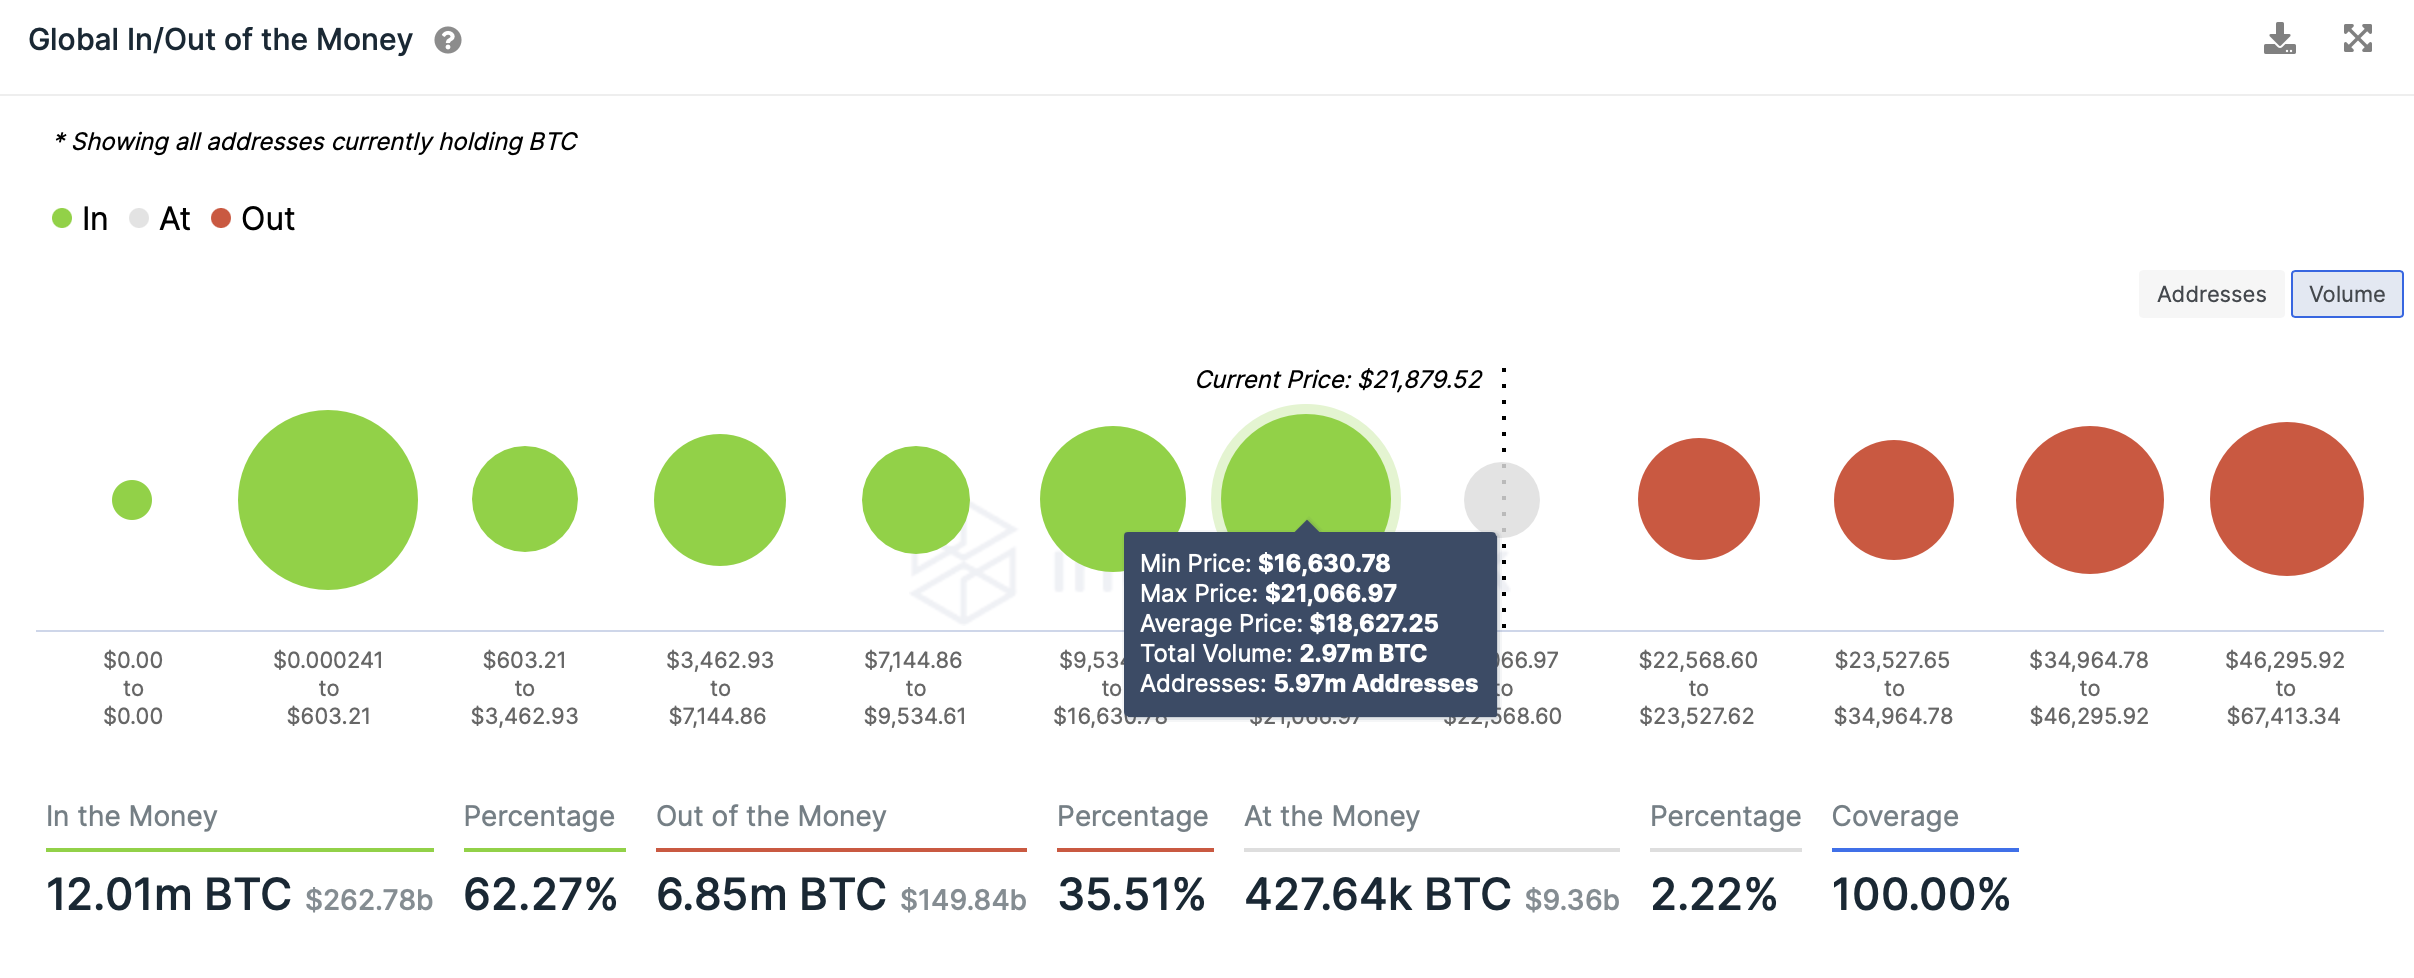
IntoTheBlock’s Global In/Out of the Money shows that the immediate support level for Bitcoin price and sidelined buyers are present between the $16,630 to $21,066 zone. Here, roughly 6 million addresses purchased 3 million BTC at an average price of $18,627.
So if Bitcoin price does experience an overwhelming spike in selling pressure, it could find stable grounds at the aforementioned level.
BTC GIOM
There were two instances in the last week where Whale Transactions worth $100,000 or more spiked above 1,500. This uptick deviated 55% above the 30-day average of 966, which coincided with the exhaustion, sell signals, and bearish divergence spotted in Bitcoin price.
A spike in whale transactions after an uptrend is usually considered a proxy of local top formation, as these investors could be moving their holdings to book profits. Hence, this uptick denotes that high-net-worth individuals’ selling activity caused the recent shift in momentum favoring bears.
 [16.37.52, 10 Feb, 2023]-638116259589304269.png)
Whale Transactions
Due to this profit-taking event, the investors that were ‘in-the-money’ and purchased BTC over the last month have now hit breakeven levels as seen in the Market Value to Realized Value (MVRV) model.
This on-chain metric read 22% on January 20, when BTC formed a local top at $23,770. Such a reading was last seen in February 2021, when BTC started its bull run and indicated that 23% of addresses that purchased BTC over the past month were in massive profits.
Typically a surge like this often indicates a local top formation, as these investors could book profits and trigger a sell-off. But presently, the 30-day MVRV is hovering at -2.0%, revealing that the investors that purchased BTC in the last month are slightly below breakeven.
Concluding thoughts
All in all, Bitcoin price seems to have cooled off, or at least, that the pressure that built up due to the 2023 bull rally seems to be partially relieved. Whether BTC continues its descent or bounces and kick-starts another run-up is indecisive as of yet.
However, investors can look at key levels or zones and how Bitcoin price reacts to these areas to estimate the direction. Some pivotal levels for sidelined buyers to step in include the bullish breaker, extending from $20,052 to $21,470 and the midpoint of the 48% rally at $20,312.
A breakdown of the latter support structure will spell disaster for Bitcoin bulls and could potentially trigger a 20% price crash to $16,358 or lower.
A bounce off the $20,312 level will not save Bitcoin price but a flip of the $25,000 psychological level will. This move will invalidate the bearish thesis and shift the narrative favoring the bulls. Additionally, it could cause a buying spree, propelling BTC to revisit the $30,000 hurdle after more than eight months.
Author

Akash Girimath
FXStreet
Akash Girimath is a Mechanical Engineer interested in the chaos of the financial markets. Trying to make sense of this convoluted yet fascinating space, he switched his engineering job to become a crypto reporter and analyst.


