- Bitcoin price shows a distribution on a lower time frame that supports the idea of a correction.
- Investors should look for the $21,155 level as the short-term target for bears.
- A flip of the $24,989 resistance level into a support floor on a daily time frame will invalidate the bearish thesis for BTC.
Bitcoin price is undergoing a massive rejection at a crucial hurdle for the second time, suggesting the possibility of a reversal. A further look into a lower time frame reveals that this bearish outlook could be possible under certain conditions.
However, the crypto markets seem to be enjoying the bullish narrative painted due to the upcoming Merge upgrade to the Ethereum blockchain. As a result, many altcoins have more than doubled over the last month and show signs that more is on its way.
If Bitcoin price does undergo a sell-off, this could potentially ruin the party for many of such altcoins, including Ethereum.
Bitcoin price holds steady, but for how long?
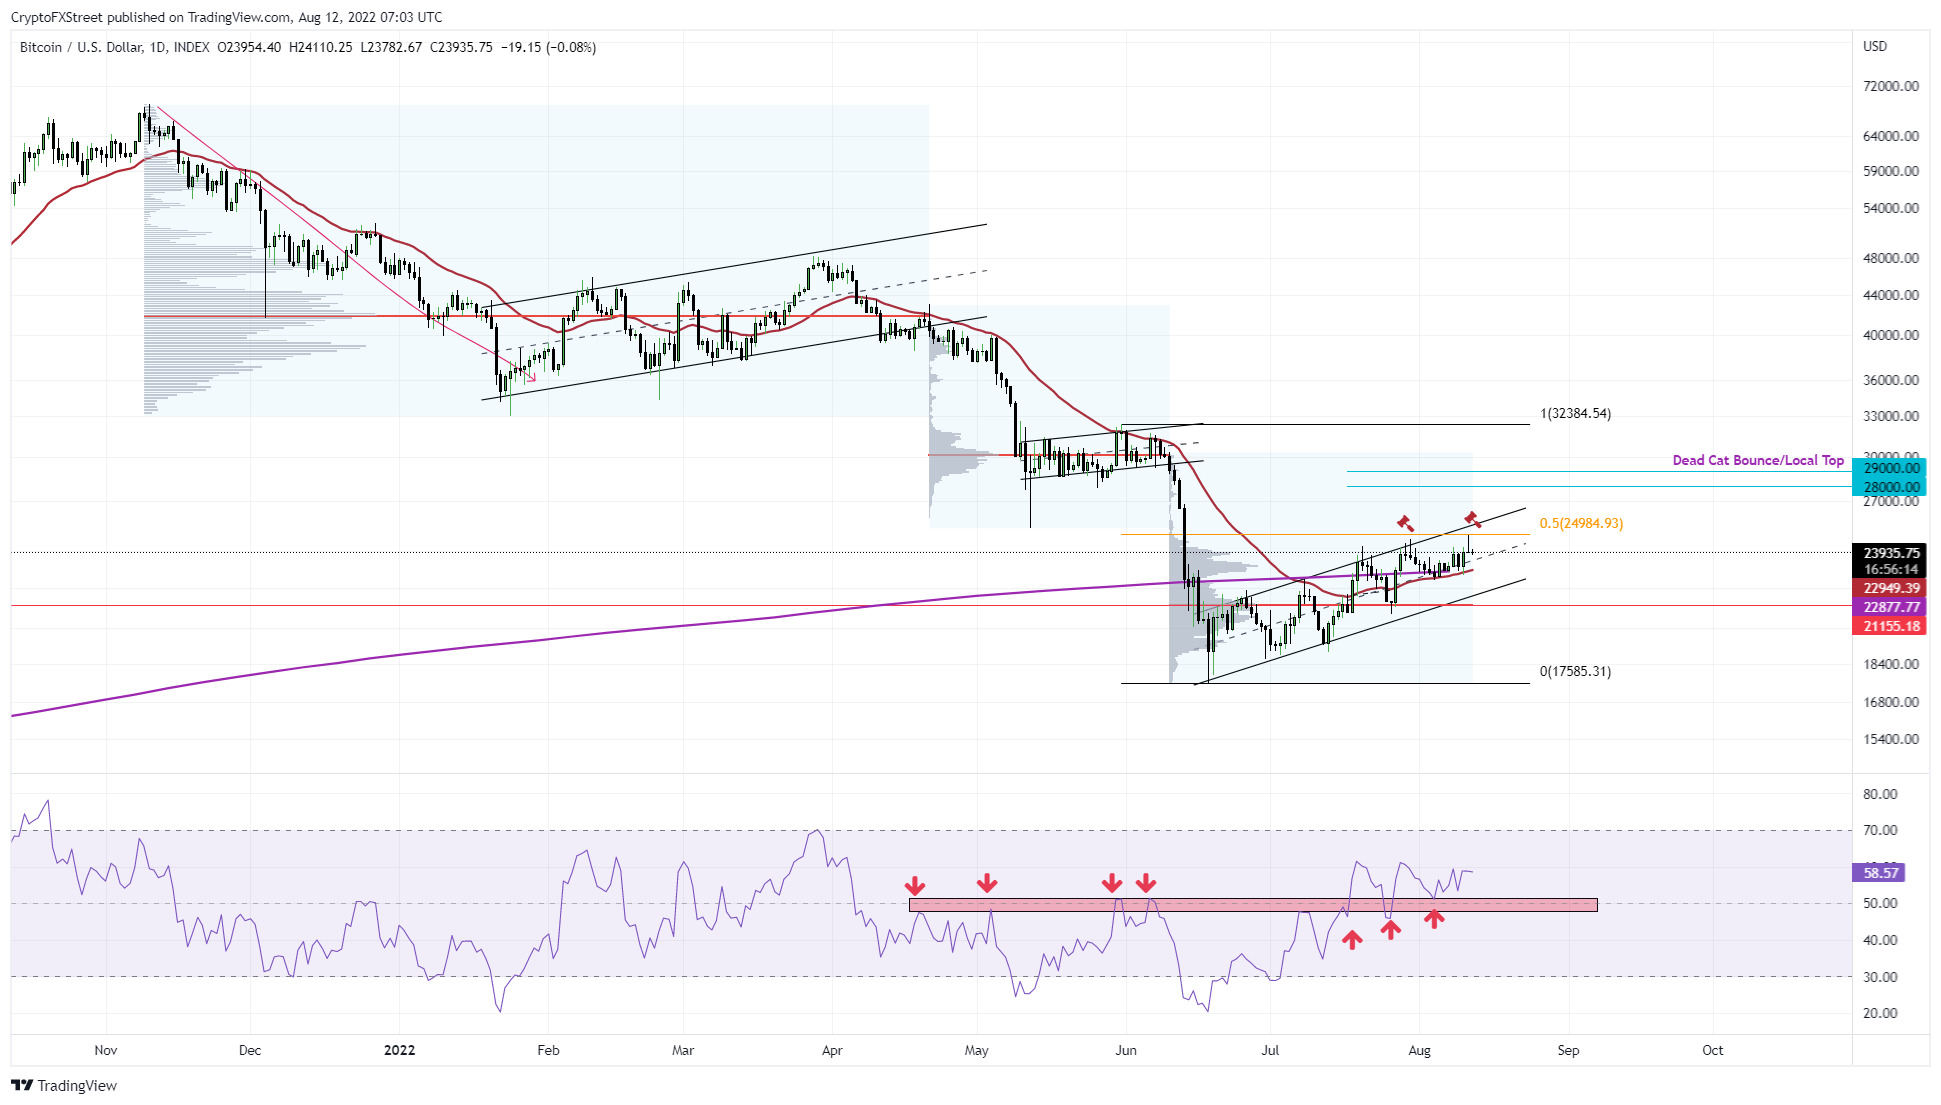
Bitcoin price has stuck to consolidating inside the ascending parallel channel fractal with no signs of a breakout. Things have remained more or less the same since the last weekly forecast but with one key addition - BTC tried shattering the 50% retracement level at $24,948 but failed.
The big crypto seems to be getting an overwhelming amount of buying pressure due to the 200-week Simple Moving Average (SMA) and the 30-day Exponential Moving Average (EMA) support cluster at $22,900.
Moreover, the Relative Strength Index (RSI) also shows a massive support area between 47 and 51, which explains why BTC price experienced a sudden spike in buying pressure on August 4.
This is the second failed attempt to flip the $25,000 hurdle into a support floor. Further adding credence to the increase in bears’ dominance is the August 12 daily candlestick close, which suggests that the buyers were overwhelmed by the sellers.
To make things worse, Bitcoin price produced a higher high on July 28 and August 11, while the RSI produced a lower low, suggesting the development of a bearish divergence.
In conclusion, the bigger picture for BTC shows us two potential scenarios that could evolve
- A rally to $29,000 - this narrative gels well with the recent bullish outlook due to Ethereum’s Merge. However, to be fruitful, Bitcoin price needs to convert the $25,000 level – a major thorn in the bulls’ side – into a support floor.
- The second scenario includes a breakdown of the support cluster consisting of the 200-week SMA and the 30-day EMA at roughly $22,900. In such a case, BTC is more than likely to retest the highest traded volume level at $21,155. This barrier is called the point of control and is obtained from the price data that spans from the last breakdown of the ascending channel on June 10 to date.
BTC/USDT 1-day chart
Let’s take a closer look at Bitcoin price from a lower time frame and discuss if we can get a clue for one of the aforementioned narratives.
BTC distribution hints at things to come
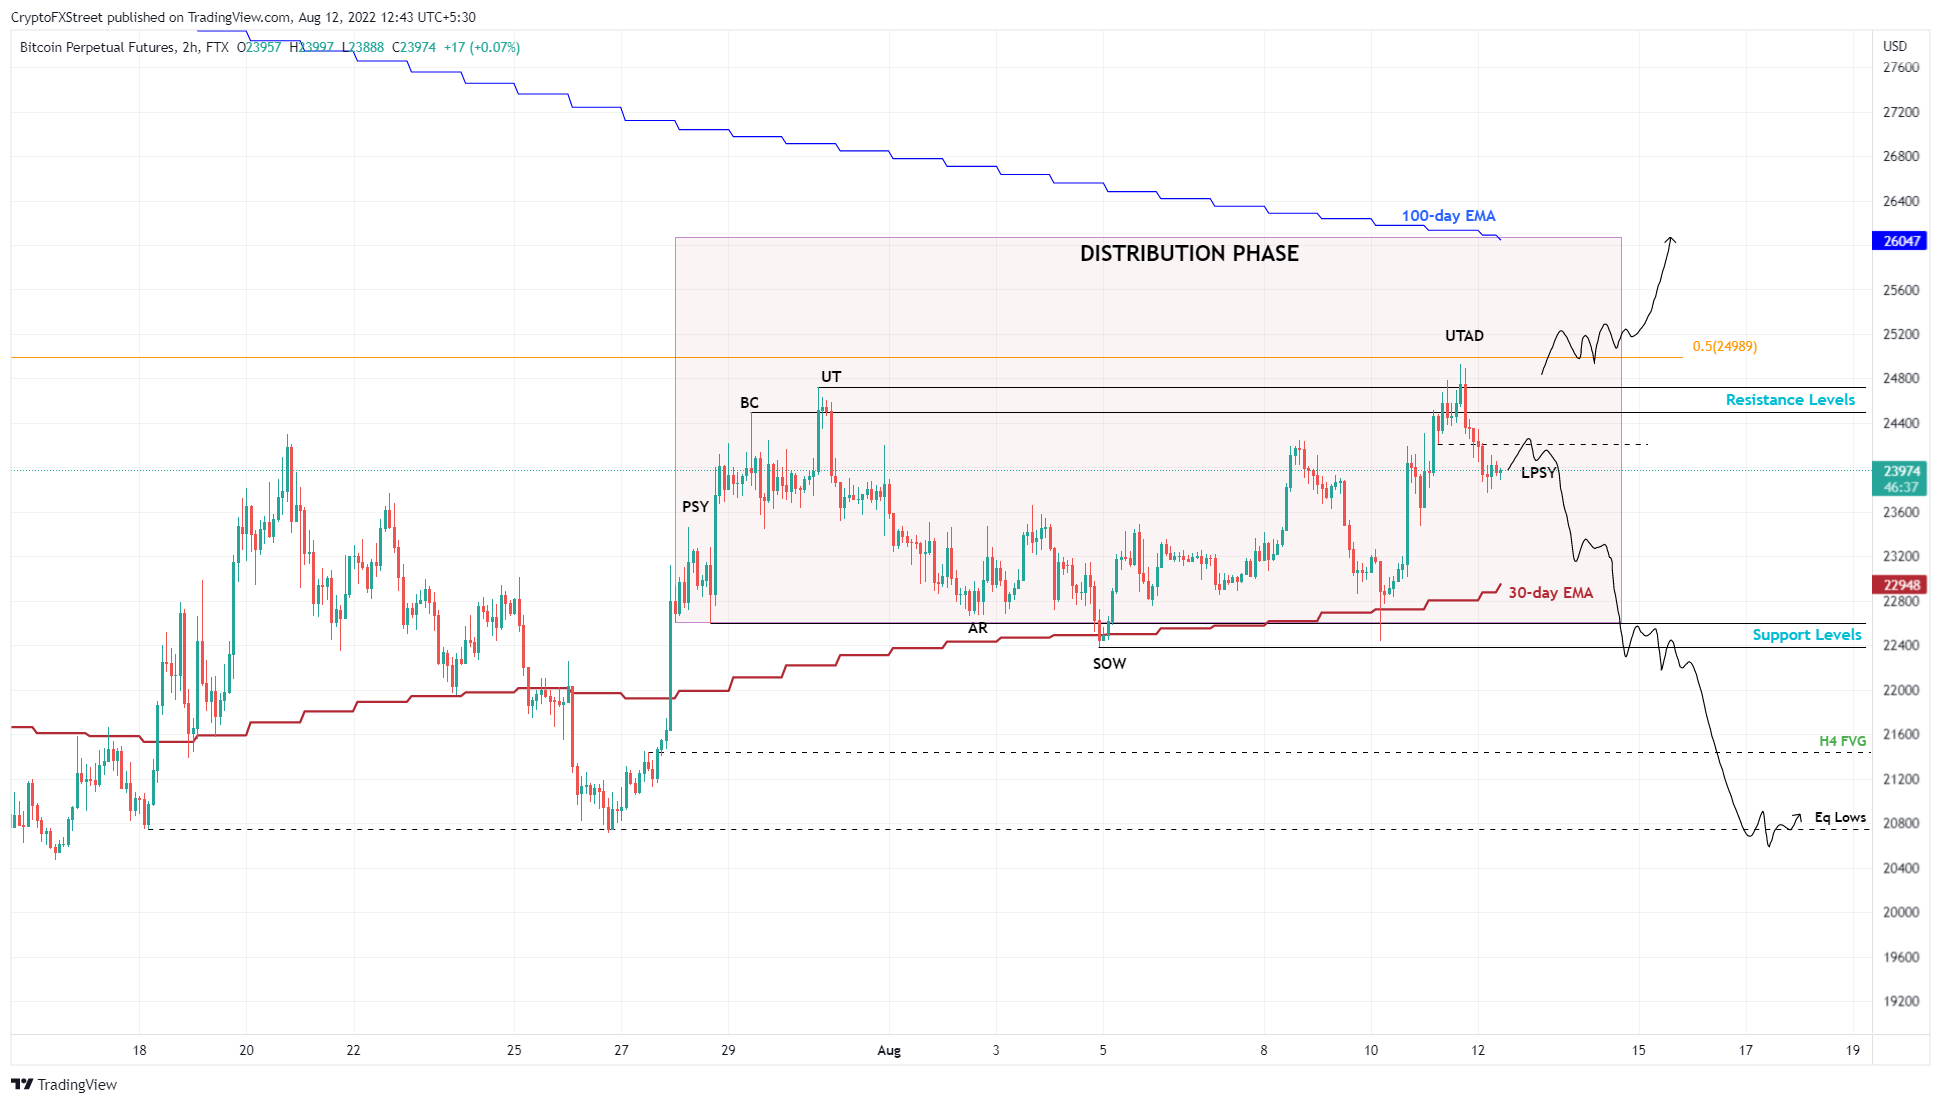
Bitcoin price shows an interesting development on the one-hour chart that indicates a potential distribution phase. The Wyckoff distribution phase consists of particular identifiers that will indicate if the underlying asset is in the accumulation or distribution phase.
BTC/USDT 1-hour chart
After a massive rally, the asset, aka BTC, forms a primary supply level (PSY), which in the chart above is seen occuring on July 28. There then follows a minor uptrend that indicates the climax of buying pressure (BC). As the bullish momentum ceases, Bitcoin price slides lower, which is termed an automatic reaction (AR), which in the chart above ends around August 2.
This downswing is followed by an upthrust (UT) and a sweep of the AR, giving rise to the first sign of weakness (SOW). However, the distribution’s last leg, where traders could enter a long position, would be a sweep of the UT that produces upthrust after distribution (UTAD).
After this move, the asset starts to slowly decline and the sell-off increases as it fails to hold above the AR.
Bitcoin price is currently at an opportune moment for sellers and is likely to start its leg down after producing UTAD at $24,722. Interestingly, the 50% retracement level mentioned in the above section at $24,989 is a major hurdle, hence a rejection here makes perfect sense and adds credence to the distribution thesis.
- Market participants can enter a short position if the Bitcoin price provides a retest of $24,211.
- The take profit levels include the 30-day EMA at $22,947, which is roughly $300 above the AR at $22,598.
- Other take-profit levels to consider include the four-hour fair value gap, aka price inefficiency, at $21,440 and the liquidity pool resting below $20,750.
- The invalidation would occur if Bitcoin price flips the $24,989 hurdle into a support floor on a daily time frame.
A further bearish outlook will evolve for Bitcoin price should close the weekly candlestick below the point of control at $21,155. In this case, a breakdown of the ascending parallel channel will have occurred, which would hint at a much more drastic sell-off for BTC.
However, investors should not get ahead of themselves and look for a sweep of the range low at $17,585 to stabilize the sell-off and reevaluate.
Information on these pages contains forward-looking statements that involve risks and uncertainties. Markets and instruments profiled on this page are for informational purposes only and should not in any way come across as a recommendation to buy or sell in these assets. You should do your own thorough research before making any investment decisions. FXStreet does not in any way guarantee that this information is free from mistakes, errors, or material misstatements. It also does not guarantee that this information is of a timely nature. Investing in Open Markets involves a great deal of risk, including the loss of all or a portion of your investment, as well as emotional distress. All risks, losses and costs associated with investing, including total loss of principal, are your responsibility. The views and opinions expressed in this article are those of the authors and do not necessarily reflect the official policy or position of FXStreet nor its advertisers. The author will not be held responsible for information that is found at the end of links posted on this page.
If not otherwise explicitly mentioned in the body of the article, at the time of writing, the author has no position in any stock mentioned in this article and no business relationship with any company mentioned. The author has not received compensation for writing this article, other than from FXStreet.
FXStreet and the author do not provide personalized recommendations. The author makes no representations as to the accuracy, completeness, or suitability of this information. FXStreet and the author will not be liable for any errors, omissions or any losses, injuries or damages arising from this information and its display or use. Errors and omissions excepted.
The author and FXStreet are not registered investment advisors and nothing in this article is intended to be investment advice.
Recommended Content
Editors’ Picks

Bitcoin Weekly Forecast: BTC nosedives below $95,000 as spot ETFs record highest daily outflow since launch
Bitcoin price continues to edge down, trading below $95,000 on Friday after declining more than 9% this week. Bitcoin US spot ETFs recorded the highest single-day outflow on Thursday since their launch in January.

Bitcoin crashes to $96,000, altcoins bleed: Top trades for sidelined buyers
Bitcoin (BTC) slipped under the $100,000 milestone and touched the $96,000 level briefly on Friday, a sharp decline that has also hit hard prices of other altcoins and particularly meme coins.

Solana Price Forecast: SOL’s technical outlook and on-chain metrics hint at a double-digit correction
Solana (SOL) price trades in red below $194 on Friday after declining more than 13% this week. The recent downturn has led to $38 million in total liquidations, with over $33 million coming from long positions.

SEC approves Hashdex and Franklin Templeton's combined Bitcoin and Ethereum crypto index ETFs
The SEC approved Hashdex's proposal for a crypto index ETF. The ETF currently features Bitcoin and Ethereum, with possible additions in the future. The agency also approved Franklin Templeton's amendment to its Cboe BZX for a crypto index ETF.

Bitcoin: 2025 outlook brightens on expectations of US pro-crypto policy
Bitcoin price has surged more than 140% in 2024, reaching the $100K milestone in early December. The rally was driven by the launch of Bitcoin Spot ETFs in January and the reduced supply following the fourth halving event in April.

Best Forex Brokers with Low Spreads
VERIFIED Low spreads are crucial for reducing trading costs. Explore top Forex brokers offering competitive spreads and high leverage. Compare options for EUR/USD, GBP/USD, USD/JPY, and Gold.