Bitcoin Weekly Forecast: BTC’s consolidation leaves holders questioning if $28,000 is still valid
- Bitcoin price pauses downtrend as it breaks out, but the lack of momentum suggests consolidation.
- On-chain data shows large transactions worth $100,000 or more have spiked over the last week, indicating that Bitcoin whales are returning.
- A daily candlestick close below $17,593 will invalidate the bullish thesis for the big crypto.

Bitcoin (BTC) price shows a consolidative structure despite the Federal Reserve’s hawkish tone on November 2. Regardless of the macroeconomic impact of this development, BTC continues to hover in a tight range.
Investors need to be careful as this rangebound movement could result in an explosive move. Since the technical and on-chain metrics point to different outlooks, the direction of this breakout is yet to be determined.
Bitcoin price continues to consolidate on low time frames
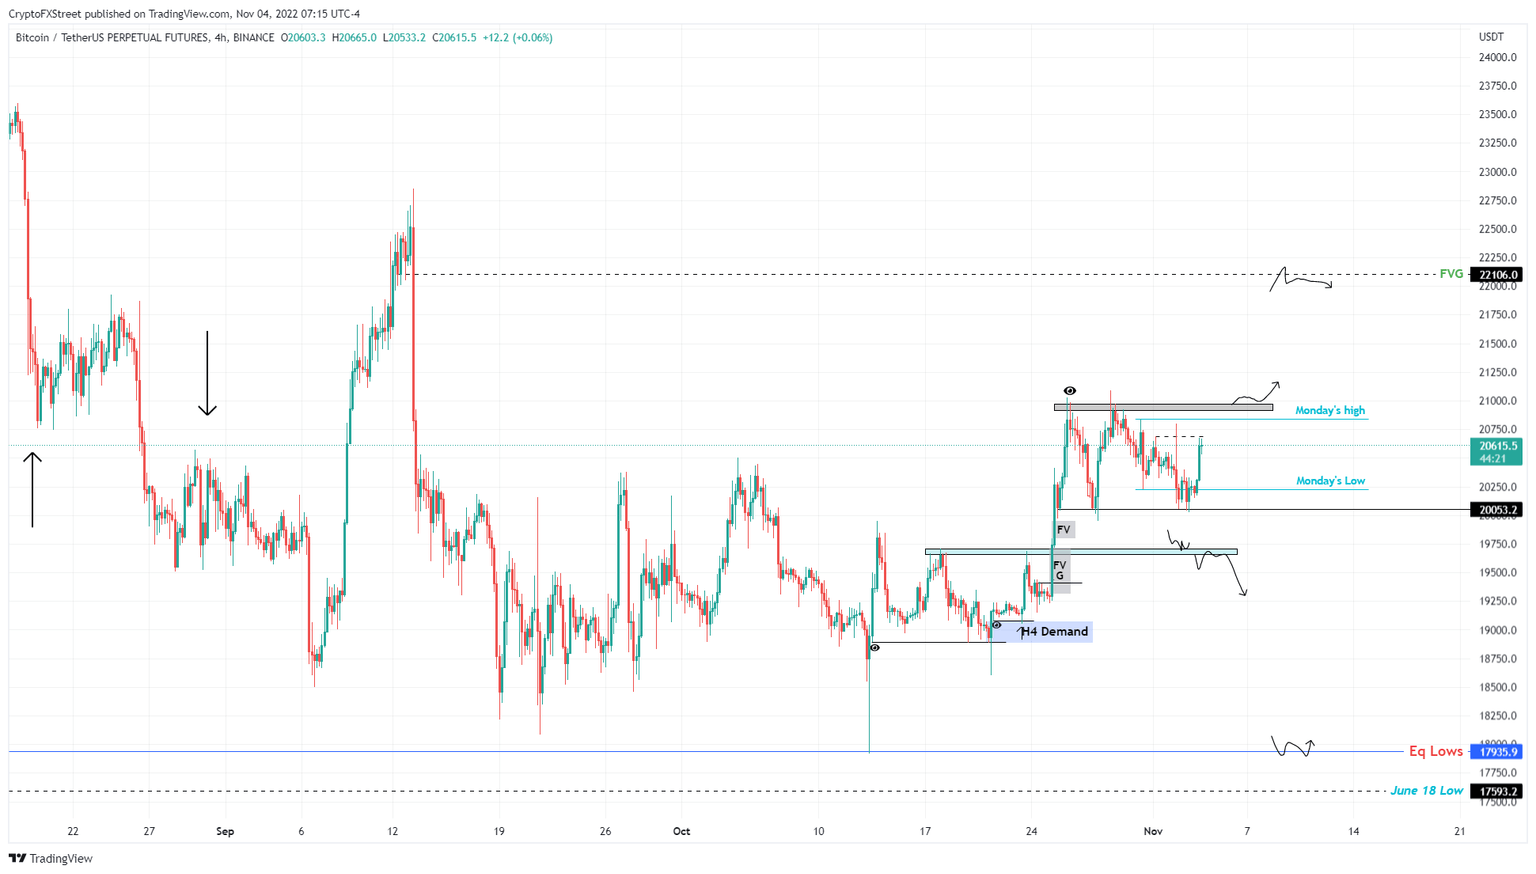
Bitcoin price has been stuck between the $20,053 and $20,910 barriers since October 25 and shows signs of consolidation. The latest development involved a sweep of the Monday’s low at $20,225, which was followed by a quick run-up toward Monday’s high at $20,838.
If the bullish momentum is strong, Bitcoin price could flip the $20,910 hurdle and use it as a foothold for its next move to $22,106. This move, in total, would amount to a 5.6% gain and is likely where the short-term upside is capped.
BTCUSDT 4-hour chart
While this bullish narrative sounds juicy and plausible, investors need to understand that a breakdown of the $20,053 support level, the range low, would knock BTC price lower to rebalance the inefficiencies, extending down to $19,315.
Therefore, an invalidation of the short-term bullish outlook will occur on the flip of the $20,053 support structure.
Over the next week, Bitcoin traders can closely monitor these levels for day and scalp trades.
No discernable changes on high time frames
Since last week's publication, Bitcoin price has had one major update – a break out from the downward-sloping trend line extending from May 28. While this move is a bullish one, market participants need to exercise patience as a move to $28,000 or $30,000 would be plausible if BTC price can produce a higher high above $21,000 and flip the $25,000 psychological level into a foothold.
In such a case, Bitcoin price could eye for and retest the $28,000 to $30,000 resistance area.
BTCUSDT 3-day chart
BTC on-chain metrics’ ambiguity
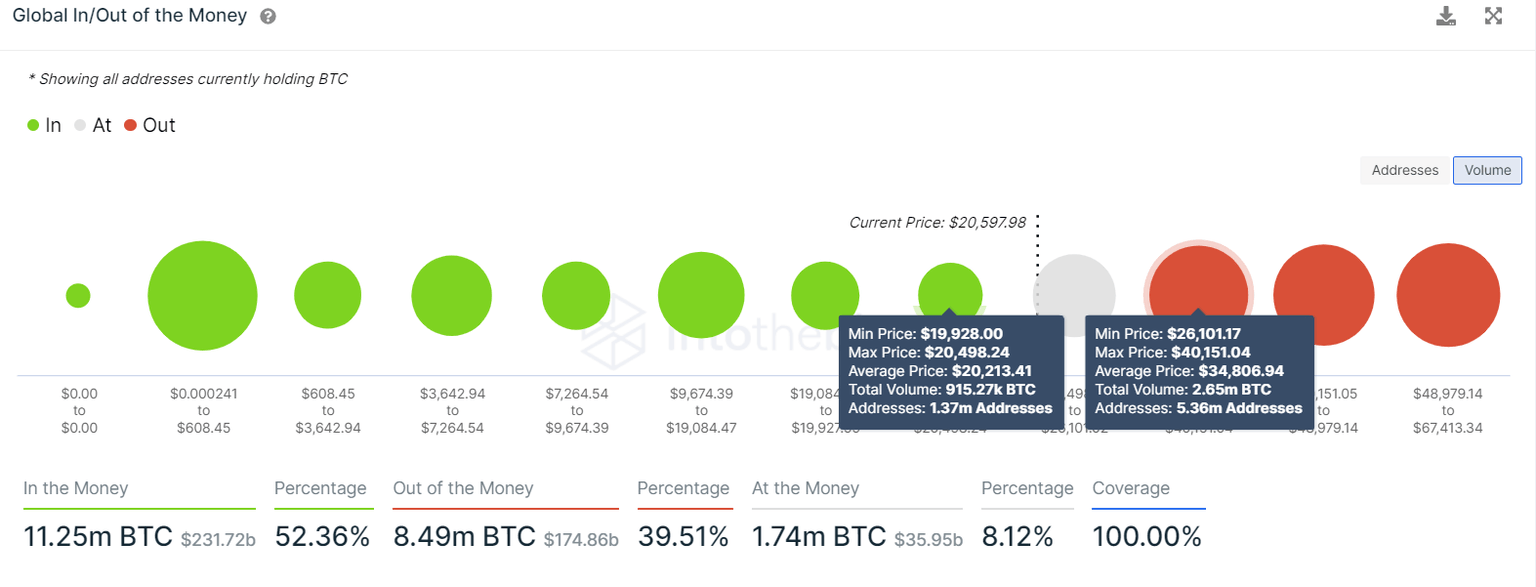
The most important metric in terms of Bitcoin price levels is the Global In/Out of the Money (GIOM) model. This transaction data reveals that the immediate hurdle for BTC extends from the $26,100 to $40,000 level. Here roughly 5.36 million addresses that purchased 2.65 million BTC at an average price of $34,806 are “Out of the Money.”
Therefore, a further push above $26,100 will lead to a spike in selling pressure reducing the bulls’ upward thrust. Therefore, investors need to be cautious opening swing long positions for Bitcoin at these levels.
Moreover, the immediate support level, extending from $19,928 to $20,498, contains 1.37 million addresses that purchased roughly 915,270 BTCs at an average price of $20,213. Therefore, a spike in selling pressure could see the big crypto return to the mentioned $20,213 level.
BTC GIOM
Investors should observe large transactions metric to add credence to a potential short outlook for Bitcoin price. This indicator tracks the number of transfers worth $100,000 or more and serves as a proxy of whales’ reentry into the market.
This development could hint at a bearish outlook for Bitcoin price if it occurs after a large rally, as it could mean investors are cashing out.
BTC large transactions chart
While the short-term and long-term outlooks for Bitcoin price are conservative and support a long-term bullish outlook, investors should consider $17,593 as the last line of defense. Beyond this hurdle, the bears will rum amok and trigger a correction to $15,500. Here, buyers could step up and purchase Bitcoin at a discounted price.
Author

Akash Girimath
FXStreet
Akash Girimath is a Mechanical Engineer interested in the chaos of the financial markets. Trying to make sense of this convoluted yet fascinating space, he switched his engineering job to become a crypto reporter and analyst.


