Bitcoin Weekly Forecast: BTC/USD needs to go down again before it goes up

- Bitcoin managed to settle above the upper line of the triangle.
- Bart Simpson undermines confidence of the retail traders.
- BTC/USD needs to regain $10,000 to extend the recovery.
After a head-spinning volatility at the beginning of the week, BTC/USD settled above $9,600 with minor gains on a week-on-week basis. A shall Doji candle on a weekly chart is an alarming signal that the bulls are exhausted by uncertainty and large price swings. At the time of writing, BTC/USD is changing hands at $9,650 mostly unchanged on a day-to-day basis. Bitcoin's market value settled at $180 billion, which is 64.9% from the total capitalization of all digital assets in circulation.
Meet Bart Simpson
An unmistakable Bart Simpson pattern on 1-hour chart triggered a lot of discussions within the community. The pattern resembles the hairstyle of a popular cartoon character as a sharp growth is followed by a range-bound trading and a subsequent swift drop, and it is often associated with price manipulations on the market.
Bart appears mostly on the cryptocurrency market notorious for their volatility and significant short-term changes in demand. The trend is amplified by derivatives. Notably, the digital assets are mostly uncorrelated to traditional markets and show no clear dependency from the fundamental events such as economic or geopolitical events. It makes them less predictable and vulnerable to price manipulations.
Marc Grens, co-founder and president of DigitalMint, believes that those factors will make Bart Simpson a frequent guest on Bitcoin charts.
As a result of substantial short-term shifts and increases in liquidity, this pattern will continue to rear its Bart Simpson head several more times during the current global recession and potential recovery following the lockdown orders.
Head of Three Arrows Capital Su Zhu shares the view that the growing popularity of cryptocurrency derivatives will result i price patterns similar to the hairstyle of the character from the popular animated series. He believes that the volatility similar to that seen on June 2-3 will be back due to the fluctuations in trading volumes and open interest on the crypto derivatives market.
Lack of trust
While the nature of the volatility remains unknown, such price movements undermine the confidence in the cryptocurrency industry. As FXStreet previously reported nearly $120 billion of both long and short positions were liquidated on BitMEX within 24 hours during the sharp market movements. It means that bulls and bears alike were hit due to cascading margin calls and a lot of retail traders were forced out of the market. This painful experience may restrict Bitcoin's movement to the North as traders will be wary of the potential sell-offs.
Vijay Ayyar, Head of Asia & Luno Exchange at Luno, alos believes that Bitcoin could retreat towards $8,500 - 8,600 before another growth attempt.
Bitcoin, having crossed the 10K line for the first time in a long time, proceeded to take a whopping downward plummet. As expected, there was a high level of liquidity when $10-10.5K level, which has now been tapped and driven back down. Arguably, the downward drive was engineered by big institutional players and whale traders. Bitcoin has not yet cleared 10.5K and hence the overall market structure remains not fully bullish, but I believe we could be headed towards $8.5 - 8.6K in the immediate term, he said in a email to FXStreet.
BTC/USD: Technical picture
On a daily chart, Bitcoin (BTC) moved outside the triangle pattern once again, but the further upside momentum seems to be limited now. The upper boundary of the broken triangle comes at $9,600, and this area serves as a vital local support for the coin. If it is broken, the sell-off may quickly gain traction with the next focus on $9,300 (weekly low) and $9,000, which is reinforced by the lower boundary of the above-said pattern.
Considering the downward-looking RSI on a daily chart, the bearish scenario looks highly likely. However, BTC bears might have a hard time pushing the price below $9,000 as it is protected by a thick layer of buy orders. According to Intotheblock data, 1.25 million BTC addresses have their break even price in the range from $9,300 to $9,00. Anyway, if it is broken, the downside may be extended towards daily SMA50 at $8,800.
BTC/USD daily chart
-637269634761178227.png)
On the upside, the local resistance is created by the upper boundary of the intraday channel at $9,800. However, the resistance is still psychological $10,000. Once it is cleared, BTC/USD may retest the weekly high at $10,414 and the highest level of $10,511.
On the long-term charts, BTC/USD continues recovering from March 2020 low. It means that the area of $10,400-$10,500 will be crucial for further Bitcoin momentum. A sustainable breakthrough higher will signal that the correction has turned into a bullish trend with the next focus on $12,500.
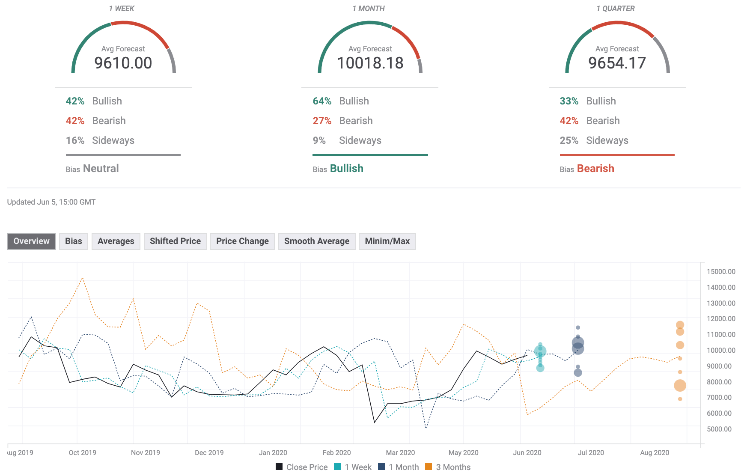
The Forecast Poll is a mixed picture as the market expectations on a weekly interval stayed neutral, monthly forecast is mostly bullish, while quarterly expectations shifted from neutral to bearish, which means that the experts do not expect a sustainable price increase on the long-term timeframes. Also, the forecasted price is below $10,000 on weekly and quarterly basis. It means that the market participants anticipate another growth attempt, but prefer to take a wait-and-see approach as the global situation and its outcomes for the cryptocurrency market are still uncertain.
Author

Tanya Abrosimova
Independent Analyst


