Bitcoin Weekly Forecast: BTC to go down before it goes up
- Bitcoin has been range-bound for most of the week.
- From the long-term perspective, BTC/USD stays bullish.
- The price may retreat further before the rebound.

Bitcoin has been suspiciously quiet this week. Even though some of the top cryptocurrency assets experienced sharp ups and downs, the pioneer digital asset stayed in a comparative serenity of a tight range limited by $10,000 on the downside and $10,500 on the upside.
Putting aside the wild DeFi segment, the week was uneventful from the fundamental point of view, resulting in traders' frustration and low trading activity. But, Bitcoin is like a compressed spring. The longer it stays trapped in a range, the more violent it will become once the range is broken. Let's have a closer look and the on-chain fundamentals and the technical indicators to see where BTC will move in the nearest future.
Someone is definitely buying the dip
Buy the dip is an old Wall Street maxima perfectly applicable to the cryptocurrency space. It means that experienced and professional investors tend to increase their market exposure when the asset price goes down, and its valuation becomes cheap. Usually, this buy-the-dip tactic results in the price rebound, provided that there are enough market participants who believe that the price has bottomed and the asset retains bullish potential.
According to the recent poll, launched by a popular crypto Twitter analyst Willy Woo, most traders usually regard the BTC drawdown as a possibility of getting more coins. Nearly 40% of the respondents answered that they preferred buying the dips rather than schedule regular purchases.
Do you stacksats?
— Willy Woo (@woonomic) September 9, 2020
The whales are up to something
Also, several on-chain and technical metrics imply that Bitcoin whales are ready to replenish their portfolios with more coins. If this theory is confirmed, BTC may experience a meteoric rise to $12,000 and new yearly highs. Let's dive deeper into the topic and see the picture in full.
The number of new addresses has been growing steadily since the price bottomed on September 5. These metrics usually correlate the price and can be regarded as a leading indicator of it. Basically, it means that more people are coming to the market. They have already opened wallets and now ready to put some coins in them. Notably, the number of active addresses has also been increasing, adding credibility to the bullish forecast.
Daily active addresses

Source: Intotheblock
At the time of writing, BTC/USD is changing hands at $10,257, down 1.3% on a week-on-week basis, and mostly unchanged since the beginning of Friday. However, average trading volumes have nearly doubled in the last 24 hours. The on-chain volume has been making higher highs despite the sidelined price action. Such divergence is a bullish signal as it means the holders are shifting coins preparing for a move.
BTC price and on-chain trading volume metrics

Source: Santiment
BTC/USD: The technical picture
From the long-term picture, BTC broke outside the descending triangle from 2017 high. The price may retest the upper boundary of the pattern that now serves as a support. If it holds, the upside momentum will gain traction quickly and bring $12,000 and $12,500 back into focus. Currently, this line is located on the approach to $9,000 and reinforced by the weekly SMA50, which adds credibility to this barrier and makes it incredibly hard for the bulls.
BTC/USD weekly chart (triable pattern)
-637354368164414156.png)
The on-chain data confirms that there is a substantial barrier in the range of $9,500-$8,400, with nearly 4 million addresses having their breakeven point within that area.
Bitcoin's In/Out of the money data
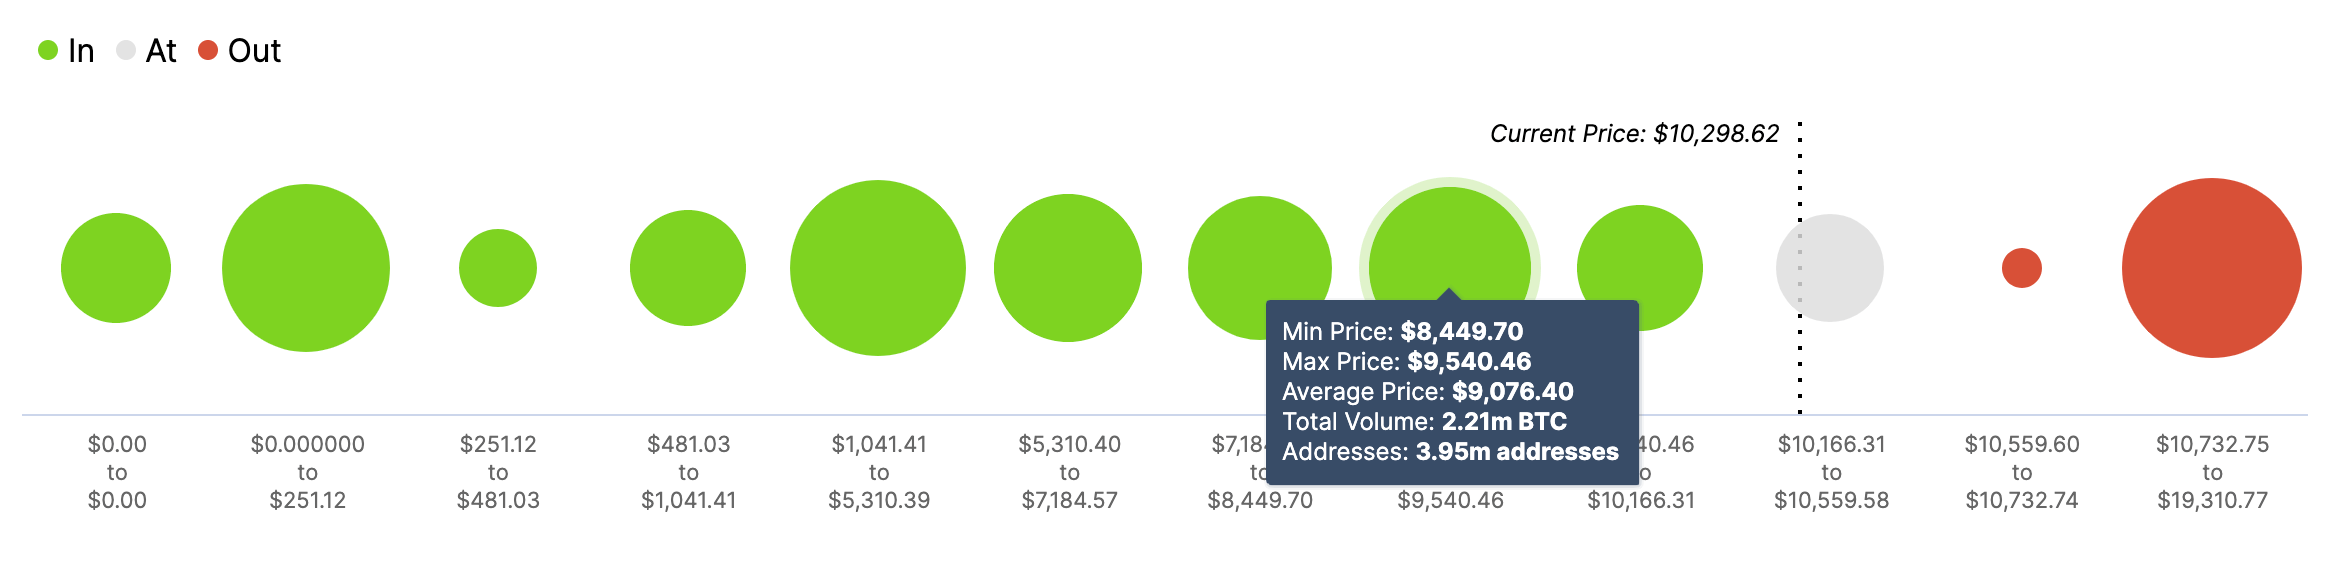
Source: Intotheblock
However, the bears will have to clear another strong barrier before setting their eyes at $9,000. The psychological $10,000 that served as a lower boundary of the consolidation channel this week may be a hard nut to crack. 61.8% Fib for the downside move from June 2019 high to March 2020 low adds significance to this support area. A movement below this area will open up the way to the above-said $9,000, coupled with 50% Fib. However, if the price rebounds from this barrier, the bullish momentum will start snowballing with the next focus on $12,000 and $12,500, the highest level of the year. Once above. BTC may reach $14,000 very quickly as there are no significant barriers in the area.
BTC/USD weekly chart (Fibo retracements)
-637354368555402699.png)
To conclude: On-chain data suggests that Bitcoin may be poised for significant gains. Several metrics indicate that the market participants are considering buying BTC on dip; However, BTC may extend the decline to $9,000 before the whales decide to jump into the game. A sustainable move below $10,000 will signal that the price will go down before it goes up. On the upside, the initial barrier is created by $10,500. Once it is out of the way, $12,000 and $14,000 will come into focus very quickly.
The Forecast Poll has barely changed since the previous week; however, the weekly timeframe expectations turned to positive. All the rest remained bearish. The experts believe that the price will stay in the range below $11,000, at least for another three months. It means that no one expects that Bitcoin either rises or falls significantly.

Author

Tanya Abrosimova
Independent Analyst


