Bitcoin Weekly Forecast: BTC struggles, but $80K is at striking distance
- Bitcoin price trades below the 2021 high of $69,139 after a market sell-off post the approval of the Ethereum spot ETF.
- Based on historical data, an AI tool forecasts BTC could nearly triple in a year after the fourth halving.
- Invalidation of the ongoing bullish outlook will occur if BTC fails to hold $60,000.

Bitcoin (BTC) price is in a good position to resume the bull rally despite the recent struggle. Optimism will restart if BTC overcomes a critical hurdle and flips it into a foothold. In such a case, the pioneer crypto will be slated to push to a new all-time high (ATH).
Also read: Ethereum ETFs launch next month ‘certainly possible' – Analyst
Bitcoin price performance post-halving
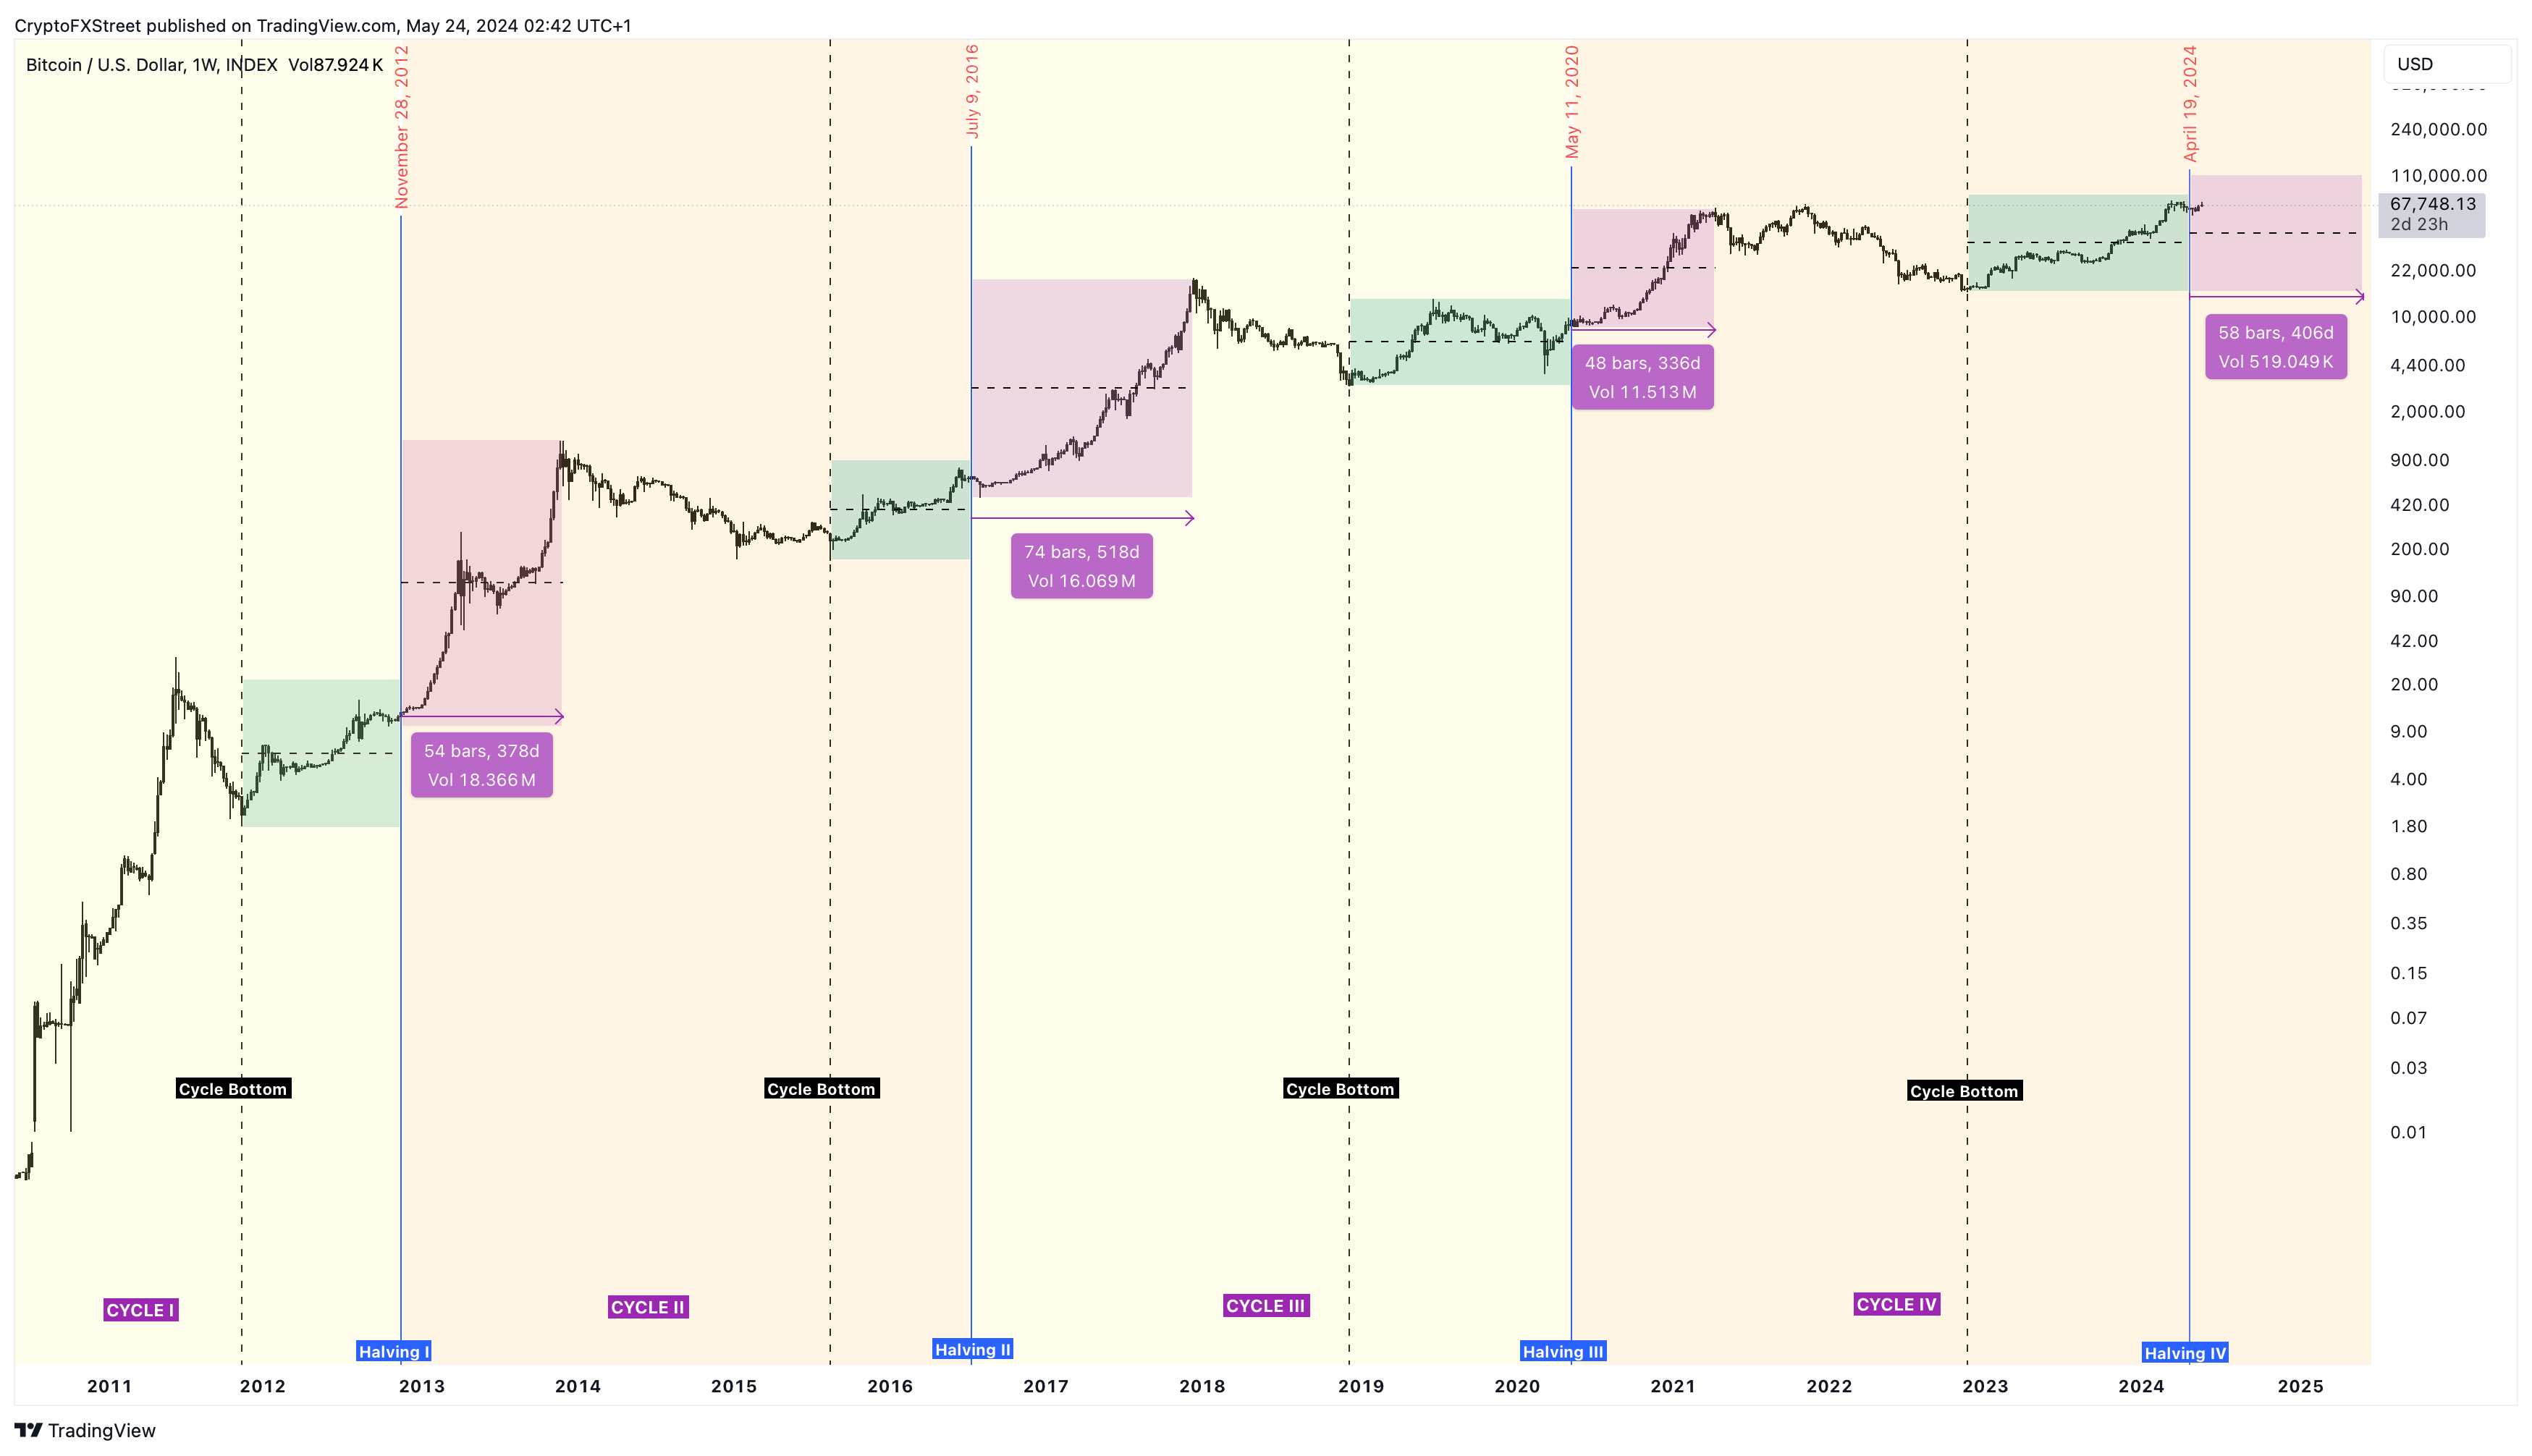
Bitcoin price has historically shown an incredible performance a year after the halving event. This time frame is the most bullish since BTC extends beyond expectations to set up an ATH. In 2012, a year after the Bitcoin halving event, the price went from $12 to $1,075, a whopping 8,858% growth. In 2016, this growth was 294%, but the pre-halving rally was equally mind-blowing. In 2020, despite the macroeconomic concerns, BTC soared 540% post-halving.
One conclusion is that the trend clearly shows diminishing returns, albeit not linear.

BTC post-halving performance
The fourth halving – the one that occurred in April – seems quite similar to the second halving in many ways. For example, the pre-halving rally in 2016 propelled Bitcoin price by 141%. In 2024, the BTC registered a 139% gain in exactly 365 days before the halving.

BTC pre-halving performance
If history repeats, the post-halving performance of 2016 and 2024 could look very similar. To confirm our hypothesis and to add a bit of fun to the equation, FXStreet asked Microsoft Co-Pilot to forecast Bitcoin price 365 days from the fourth halving. Here’s what we found.
Also read: SEC approves spot Ethereum ETFs after shocking U-turn
AI predicts Bitcoin price
We asked Co-Pilot to follow the diminishing returns trend to predict Bitcoin price a year from the fourth halving.
The Co-Pilot tried to forecast the post-halving performance by using simple extrapolation and assuming that the diminishing returns between the first, second and third halvings remained the same. But since that was not the case, Co-Pilot replied:
From the first to the second halving, the percentage increase diminished from 8,858% to 294%, which is a factor of approximately 30. From the second to the third halving, it spiked from 294% to 540%, which doesn’t follow the same factor due to external influences like the Federal Reserve’s monetary policy.”
Co-Pilot then found a turn-around. It calculated the average diminishing factor between the first and third halvings and used that to estimate the next performance. After a bit of crunching numbers, the AI answered,
With this simple extrapolation, we might expect around a 281% increase in Bitcoin’s price in the 12 months following the 2024 halving.”
Based on the above result, Bitcoin price a year from the fourth halving would be $187,876, or in the six-digit territory.
BTC/USD 1-week chart
BTC’s breakout point
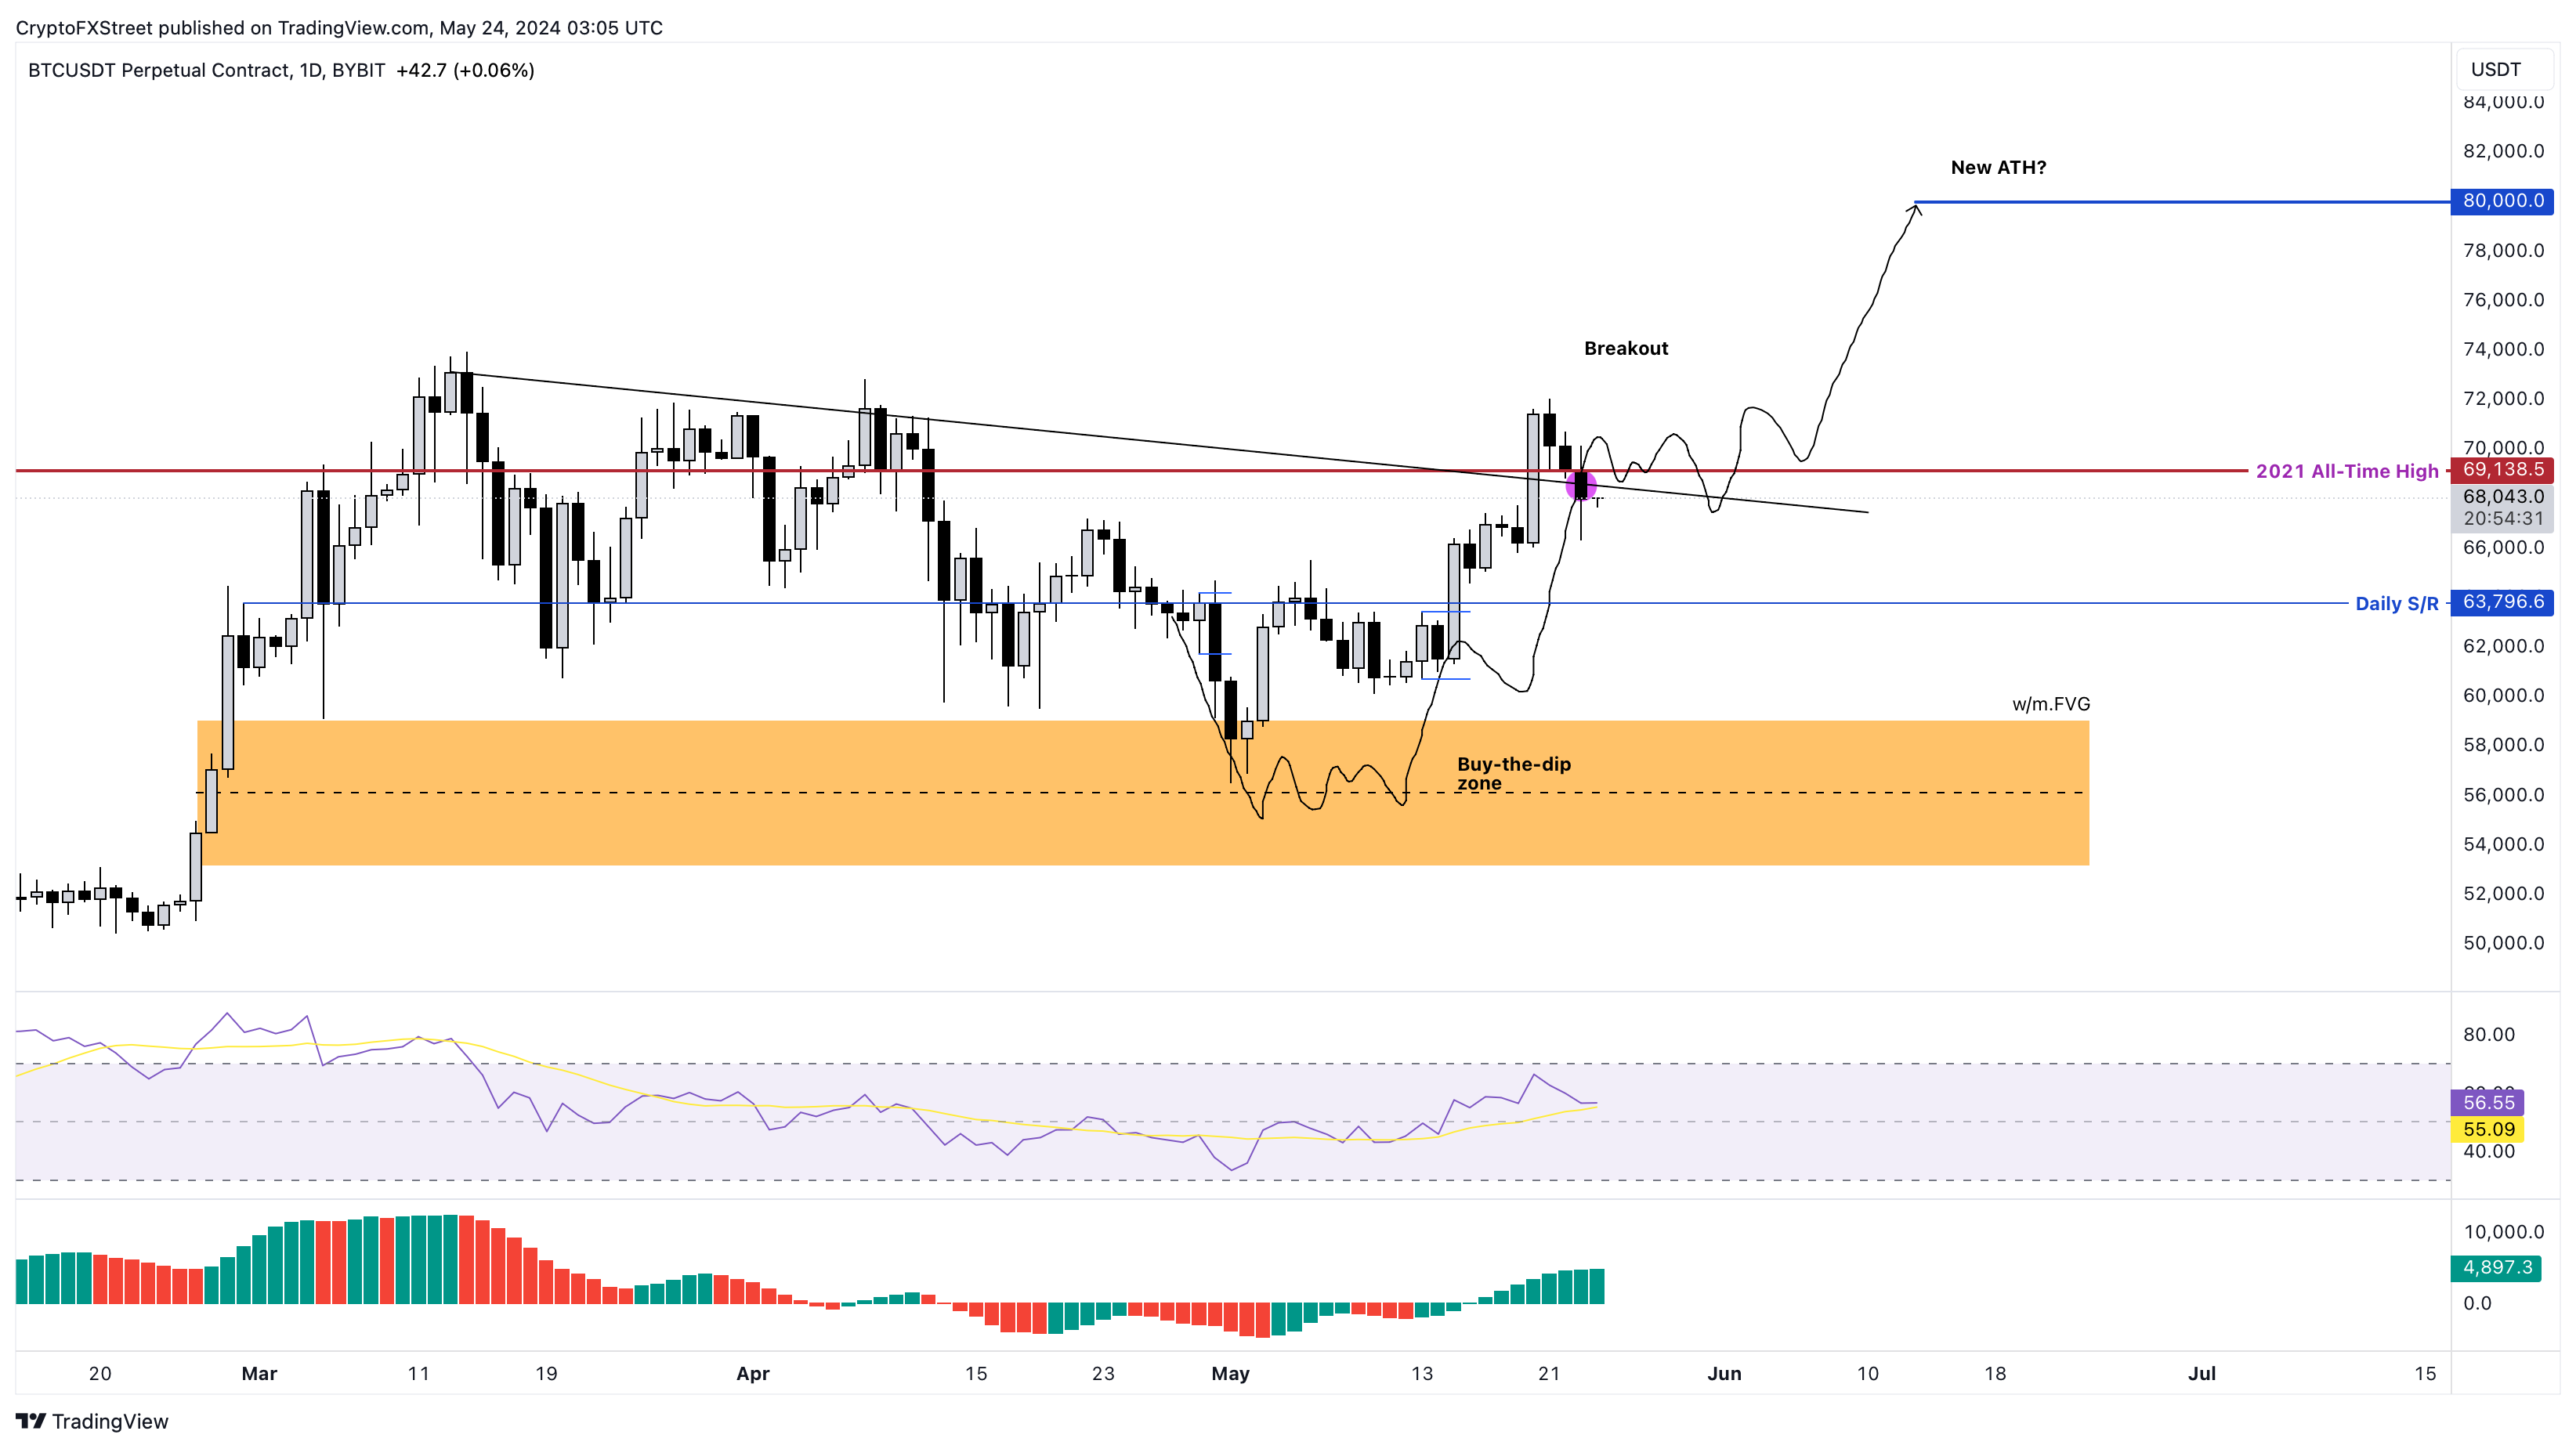
The daily chart shows Bitcoin price is trading at around $67,900, just below the 2021 high of $69,138. After breaching the declining trend line, BTC needs to sustain above the $70,000 psychological level to resume its uptrend. The ongoing struggle is to establish itself above that key support.
The Relative Strength Index (RSI) sits comfortably above its mean level of 50, showing that the uptrend is not under threat. The Awesome Oscillator is also above its mean level of zero, suggesting that bullish momentum is in control.
All in all, the outlook for Bitcoin price is bullish, but it needs to overcome the aforementioned level and flip it into a support floor. If successful, Bitcoin price oculd easily target the next psychological level at $80,000. This move would put BTC at a new ATH, but it would only mark the start of the post-halving rally, as noted above. The ultimate target based on our assumption and simple extrapolation is a six-digit Bitcoin price target.
While AI-based predictions are interesting, to say the least, they should not be considered the be-all and end-all of forecasts. Unknown or unforeseeable factors have the ability to change the targets completely.
Read more: Bitcoin Weekly Forecast: Is BTC out of the woods?
BTC/USD 1-day chart
On the other hand, if Bitcoin price fails to hold above $70,000 and instead revisits the daily support level at $64,000, it would be the first sign of weak buyers. If this weakness transitions into a sell-off that knocks BTC to produce a weekly candlestick close below $60,000, it would produce a lower low and invalidate the bullish thesis.
Such a development would skew the odds in bears’ favor and potentially attract short-term holders to panic sell. In such a case, Bitcoin price could retest the lower limit of the weekly and monthly imbalance, extending from $59,111 to $53,120.
Premium
You have reached your limit of 3 free articles for this month.
Start your subscription and get access to all our original articles.
Author

Akash Girimath
FXStreet
Akash Girimath is a Mechanical Engineer interested in the chaos of the financial markets. Trying to make sense of this convoluted yet fascinating space, he switched his engineering job to become a crypto reporter and analyst.


