Bitcoin Weekly Forecast: BTC sets a bull trap before ultimate crash to $30,000
- Bitcoin price shows a short-term bullish outlook that could propel it to $40,000.
- This optimism could be a bull trap before BTC triggers a crash to $30,000 or lower.
- A daily candlestick close above $52,000 will invalidate the bearish thesis and potentially kick-start an uptrend.

Bitcoin price has shown an increase in buyers over the past two days, leading to a quick run-up. This uptrend will likely last as BTC retests a crucial psychological level, luring buyers into a bull trap. Investors need to be cautious of a reversal that sends the big crypto in a tailspin.
Bitcoin price lures bulls before the culling begins
Bitcoin price flash crashed in January and bottomed around the weekly support level at $34,752. After a few retests of this barrier, BTC bounced off and entered an uptrend that has seen a 16% gain so far.
While this minor uptrend has given altcoins the space and momentum to pop off, it seems to be a trap employed by the bears to lure in uninformed buyers before sending the asset crashing. This setup is known as a bull trap, and the reason why investors need to expect a crash is due to the formation of a bearish breaker.
BTC price action set up two higher highs on September 7, 2021, and November 10, 2021, creating an illusion of an uptrend. The troughs between these peaks created a demand zone, extending from $40,794 to $44,387.
On January 21, however, BTC sliced through this demand zone, flipping it into a bearish breaker and leaving many holders underwater. Therefore, a retest of this breaker is likely to trigger a massive selling pressure crashing Bitcoin price.
In some cases, the big crypto could pierce through the breaker and retest the $43,000 level, a confluence of the 50-day Simple Moving Average (SMA) and a weekly resistance barrier.
As BTC continues to trend higher, and approaches the aforementioned breaker’s lower limit at $40,794, rejection is plausible. Adding credence to this outlook is the sell-side liquidity present below the $29,100 weekly support level.
In conclusion, the technical perspective suggests that a move to $30,000 or lower is likely for Bitcoin price in the coming days.
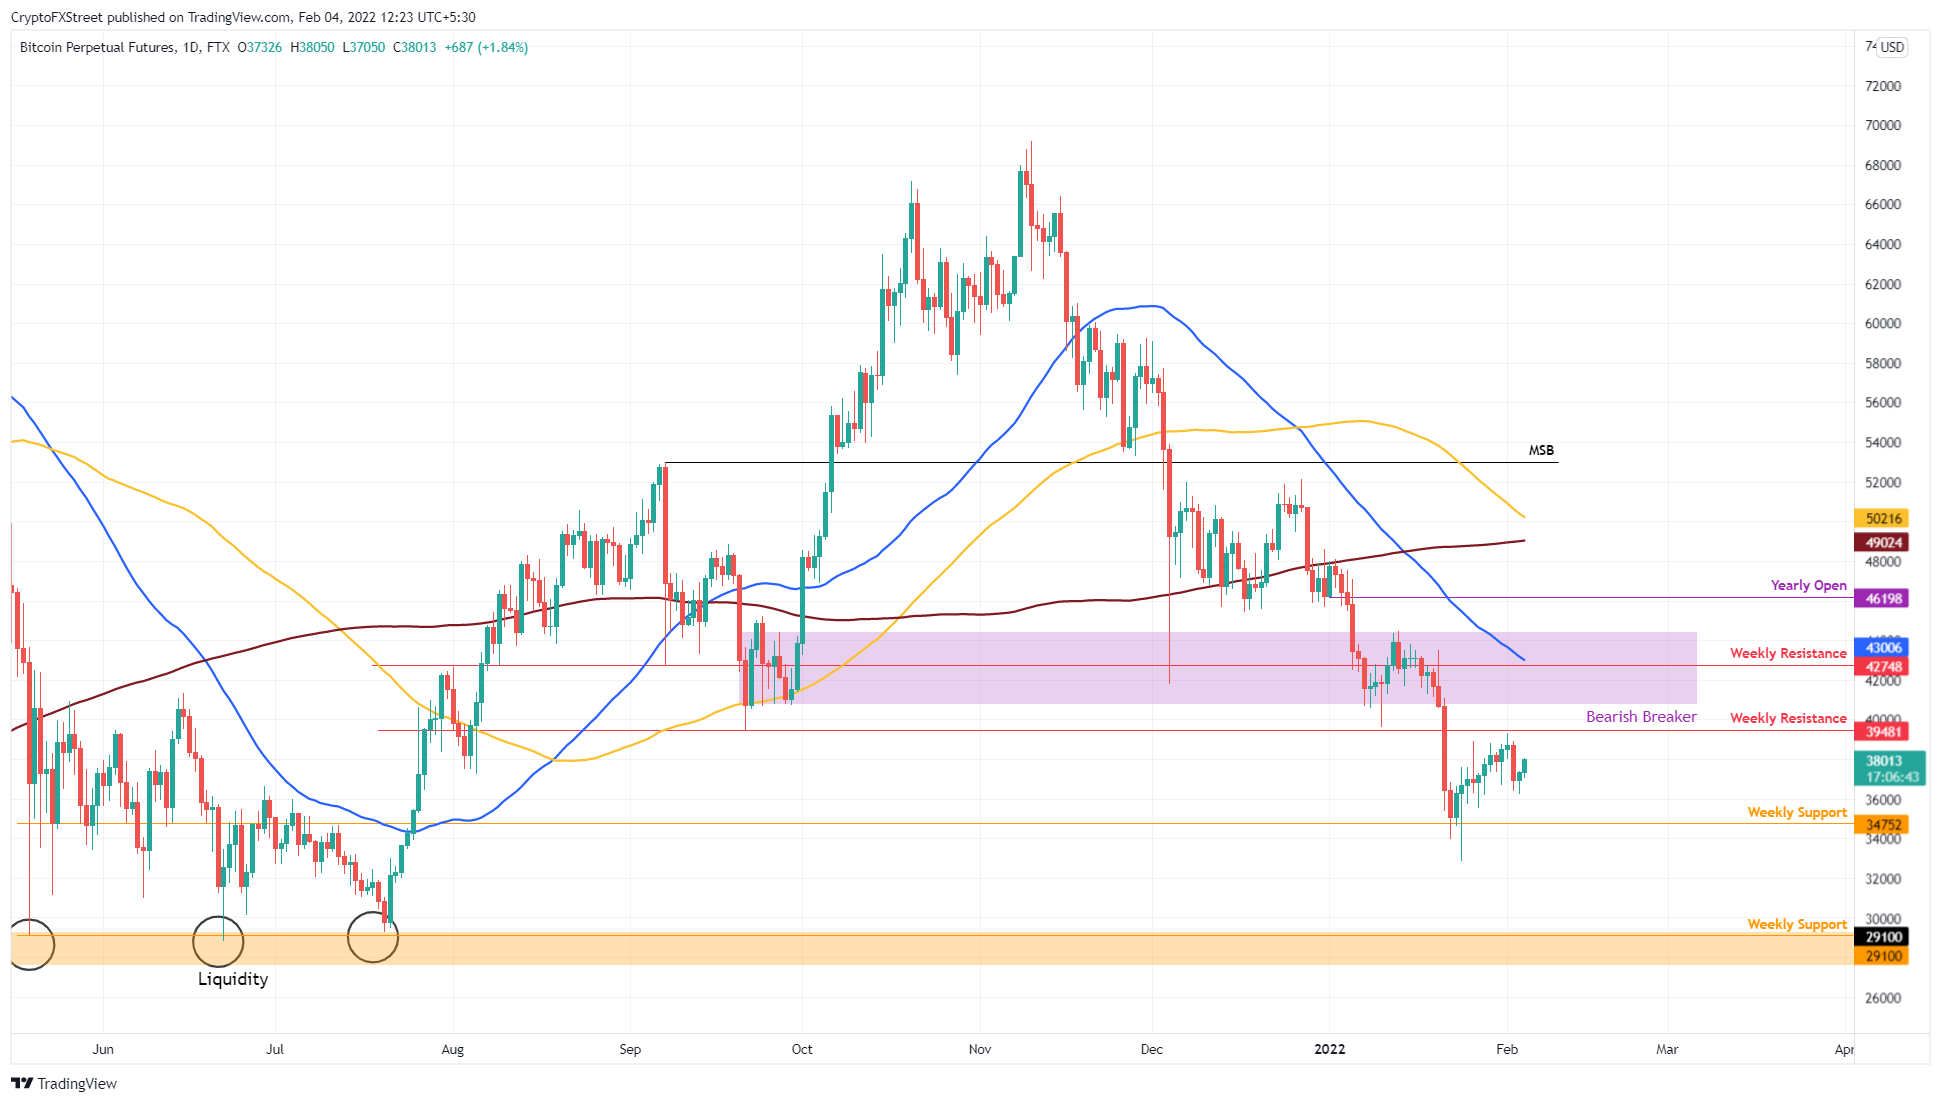
BTC/USDT 1-day chart
The sudden spike in daily active addresses from January 31 further supports the short-term bullish outlook seen in Bitcoin price. As of this writing, the number of daily active addresses was well above the 30-day moving average at 891,000.
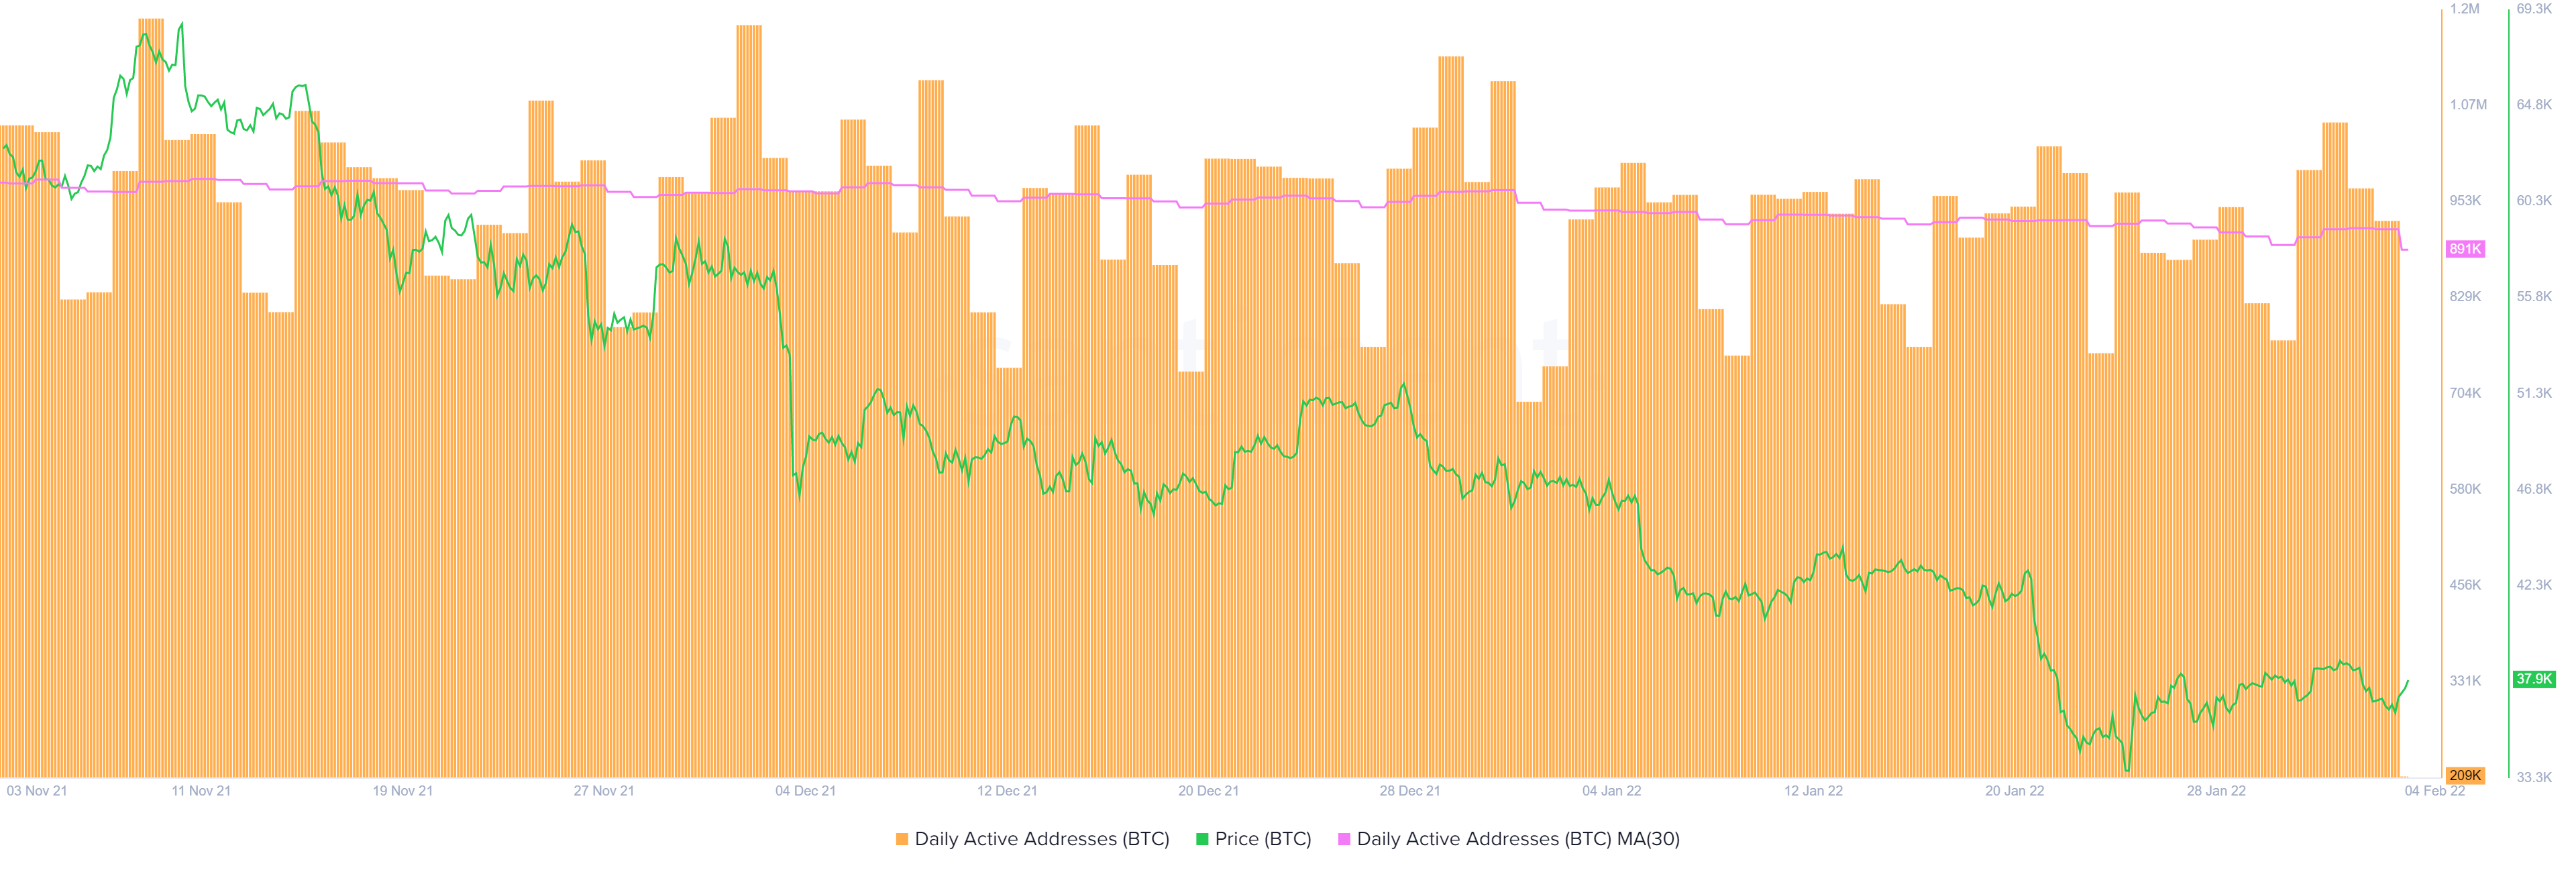
BTC DAA
While things might seem fine from the short-term outlook, IntoTheBlock’s Global In/Out of the Money (GIOM) model shows that Bitcoin price is close to retesting a massive resistance barrier. Roughly 3.36 million addresses that purchased 2.09 million BTC between $37,925 and $41,547 are “Out of the Money.”
Any spike in buying pressure that pushes Bitcoin price into the range mentioned above, therefore, is likely to be met with selling pressure from holders trying to break even. Moreover, the support level thins out considerably after $37,096, further crediting the bearish thesis.
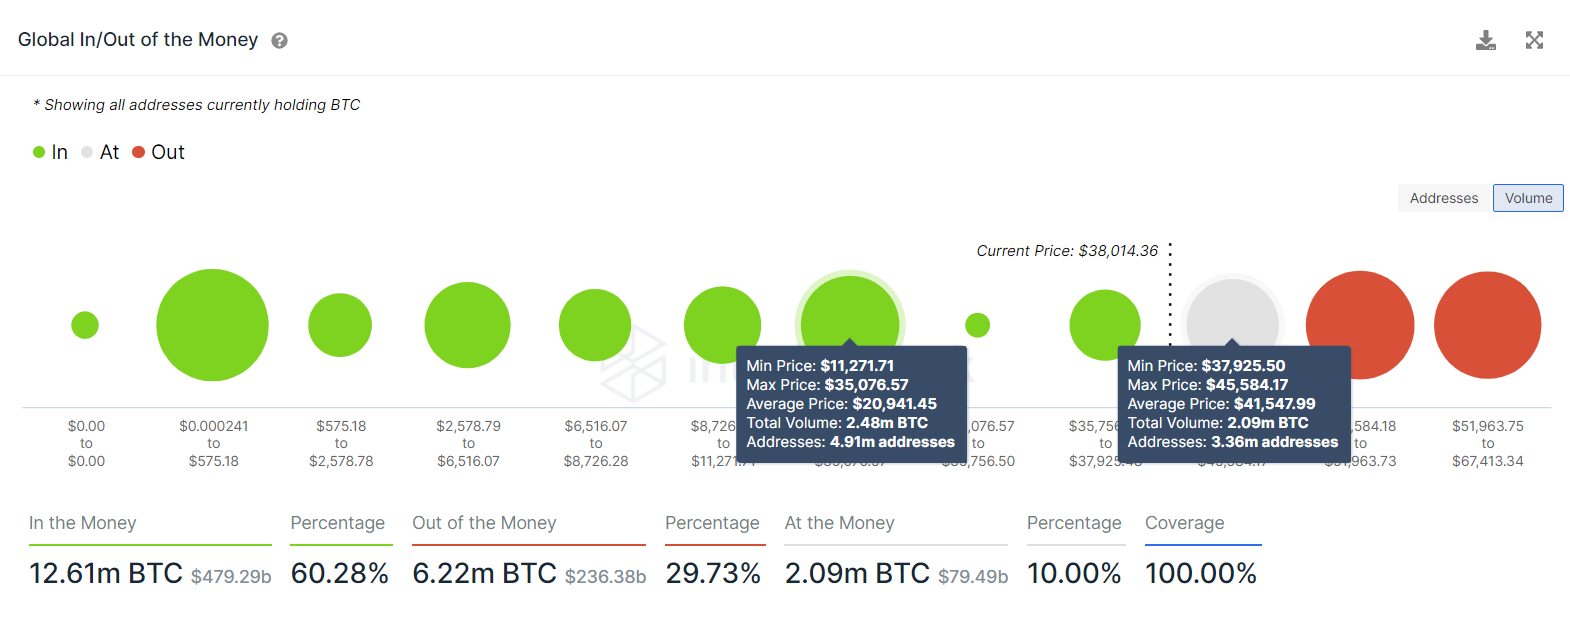
BTC GIOM
The final nail in the bulls’ coffin is the Market Value to Realized Value (MVRV) Z-score model. This on-chain metric is used to assess if an asset is overvalued or undervalued and does so by dividing the difference between the market capitalization and realized market capitalization with the standard deviation of the market capitalization.
It takes the MVRV metrics to a new level in determining historical areas of fair value, oversold or overbought. The red band indicates overbought and is typically where the bull runs top and reverse. However, the green value indicates oversold and is where long-term holders tend to accumulate.
BTC currently has an MVRV Z-score of 1.09, which is well above the oversold band, suggesting that a further downside move is not out of the question.
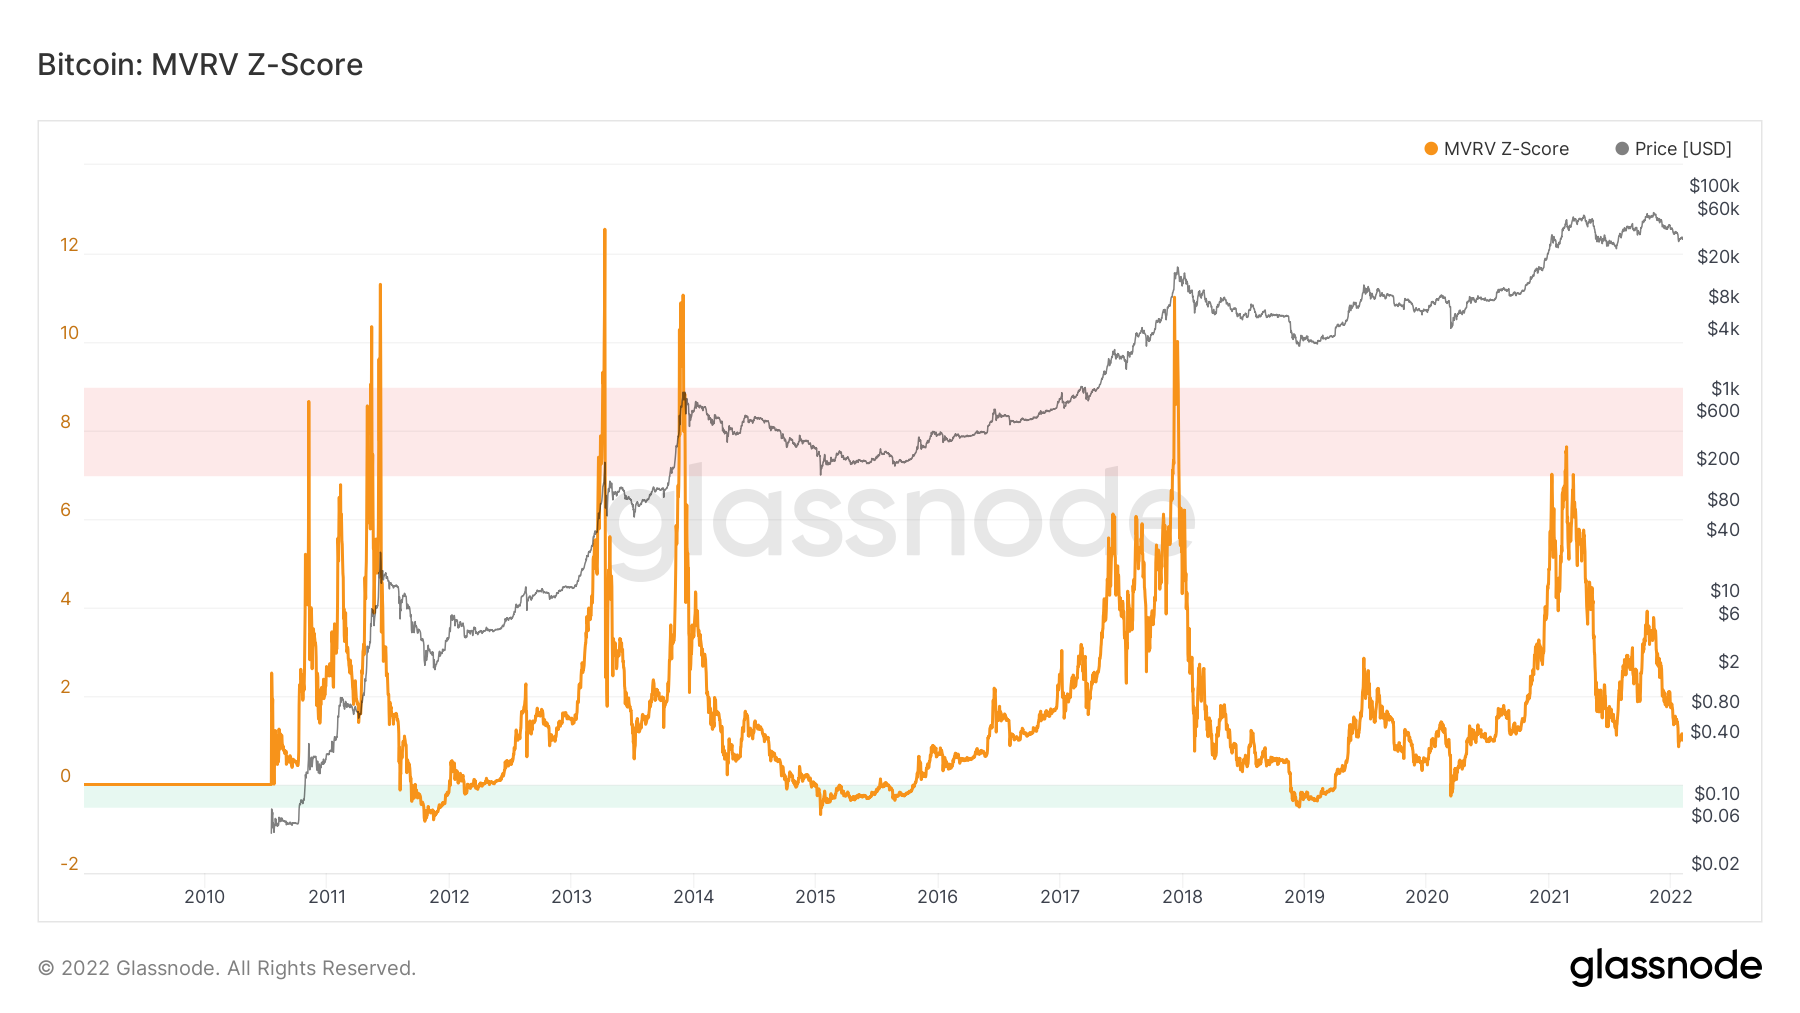
BTC MVRV Z-score
While things are looking awfully pessimistic for Bitcoin price from both technical and an on-chain perspective, a daily candlestick close above the breaker’s upper limit of $44,387 will invalidate the bearish outlook.
A bullish regime will only be seen after BTC sets up a higher high above $52,000. In such a case, investors can expect Bitcoin price to continue this trend and make a run for the $60,000 psychological barrier.
Author

Akash Girimath
FXStreet
Akash Girimath is a Mechanical Engineer interested in the chaos of the financial markets. Trying to make sense of this convoluted yet fascinating space, he switched his engineering job to become a crypto reporter and analyst.


