- Bitcoin price shows signs of exhaustion as it continues to recover after the recent crash.
- The majority of the on-chain metrics remain bullish, but the downside threat remains.
- A failure to hold above $40,000 will likely trigger a move to $36,000.
Bitcoin price shows lackluster performance after the recent crash, giving rise to the credibility of the run-up to $50,000. As the September 24 daily candlestick bathes in red, the chances of an uptrend continue to diminish.
Adoption remains strong, but investors move away from BTC
Twitter released an update on September 23, providing Twitter users with a Strike account to tip BTC via the Lightning Network. While the rumors of this development were outed a while ago, this feature will allow users to send money across borders without going through intermediaries like Western Union or MoneyGram.
The social media giant also has plans to include a feature that allows users to sign and authenticate their NFTs.
While this move from Twitter will boost BTC adoption, institutions seem to be moving away from BTC and toward ETH. According to a report by JP Morgan, the Bitcoin futures was in backwardation in May and July, indicating dwindling interest from institutions. Surprisingly, Ethereum futures entered a steep contango in September, suggesting a massive demand from big players. This development could potentially reveal a migration of institutional interest from BTC to ETH, anticipating higher returns.
On a positive note, Robert Kiyosaki, the author of Rich Dad Poor Dad, tweeted that the US was running out of money to print and that the world was going to witness the “biggest crash in history,” according to his recent tweet.
US Gov out of money. Shutdown looming. Dems blame Republicans for the problem. Evergrande Chinas biggest property developer with 800 projects in 200 cities out of money. Get the message? Get gold, silver, Bitcoin, ethereum before the biggest crash in history. Take care.
— therealkiyosaki (@theRealKiyosaki) September 23, 2021
Bitcoin price tries to whip up an uptrend
Bitcoin price set up a swing high on September 7 at $52,956 and the second lower high at $48,843 on September 18. While the recent recovery propped up BTC from $39,573 to $45,021, it is uncertain if the big crypto will continue to climb.
On the off chance that it does, the upside appears to be capped around the resistance level at $46,856 and, in an optimistic scenario, at $49,436.
If the bullish momentum continues to increase, there is a slim chance that BTC might tag the $50,000 psychological level. Breaching this barrier will create a higher high, shifting the momentum toward the bulls and giving the buyers a second chance.
The range high at $52,956 could thwart the plans if the momentum does not shatter this hurdle.
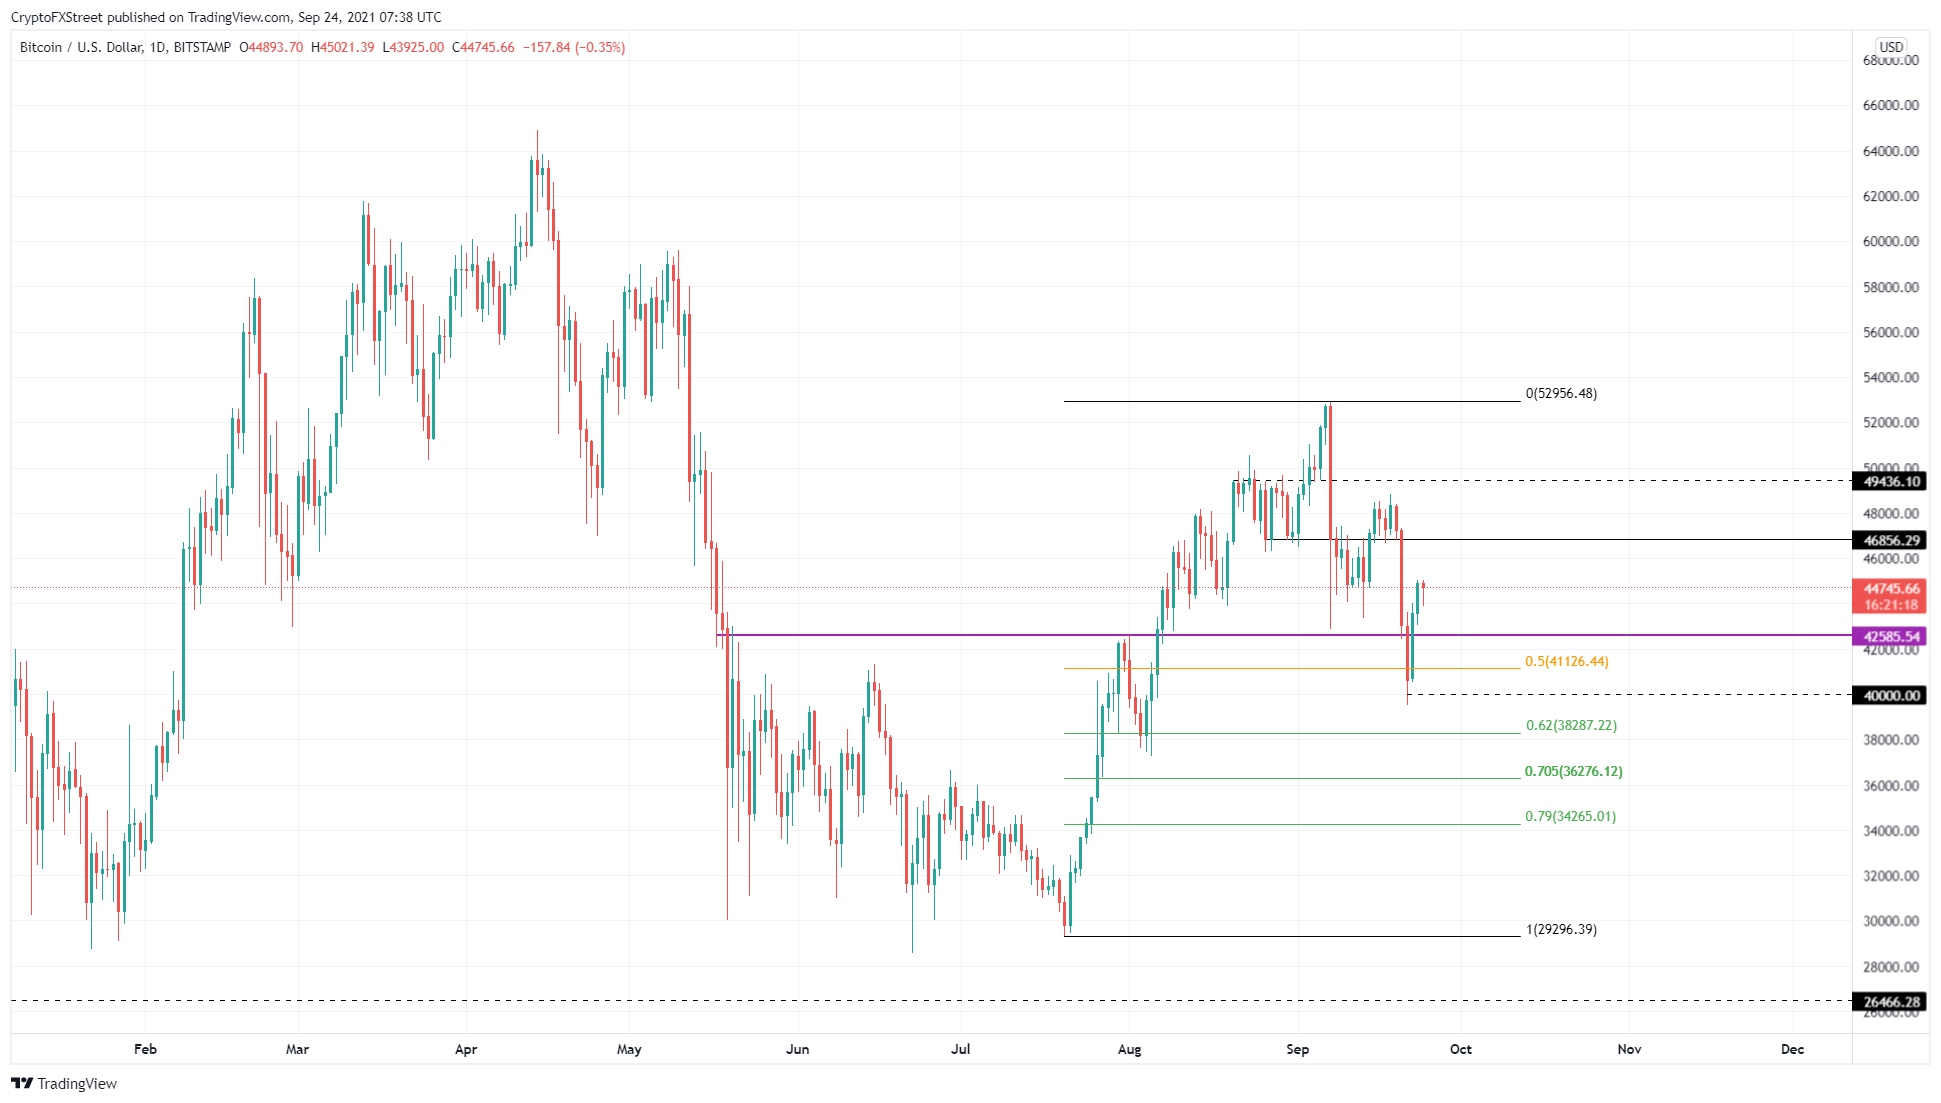
BTC/USD 1-day chart
Supporting the bullish outlook is IntoTheBlock’s Global In/Out of the Money (GIOM) model. This transaction map shows that BTC will encounter a relatively small cluster of underwater investors at $46,051. Here roughly 1.22 million addresses purchased 534,000 BTC.
Therefore, a decisive close above $46,000 will push these buyers into the safe zone and reduce the risk of a potential sell-off by a small percentage.
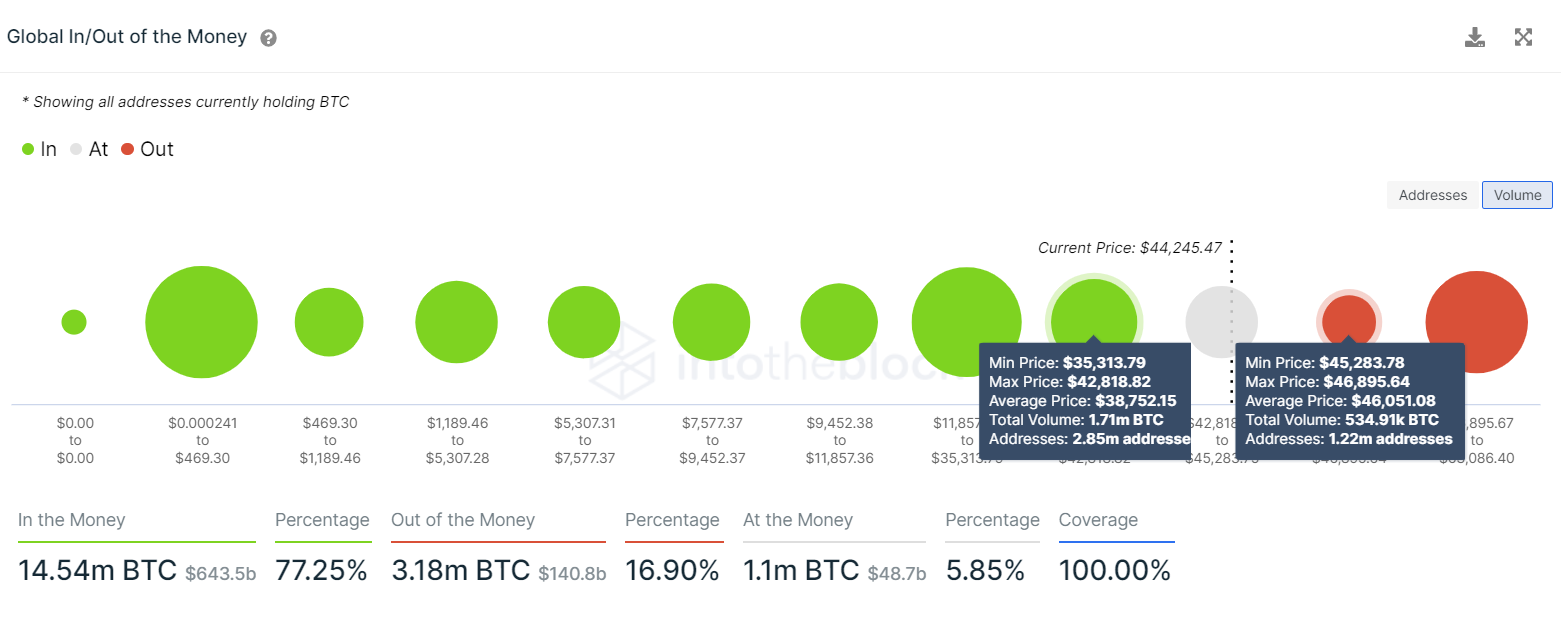
BTC GIOM chart
The Net Realized Profit/Loss metric, which calculates the average profit/loss of addresses exchanging hands on a daily basis, has flipped positive. This development indicates that the short-term investors are in profit.
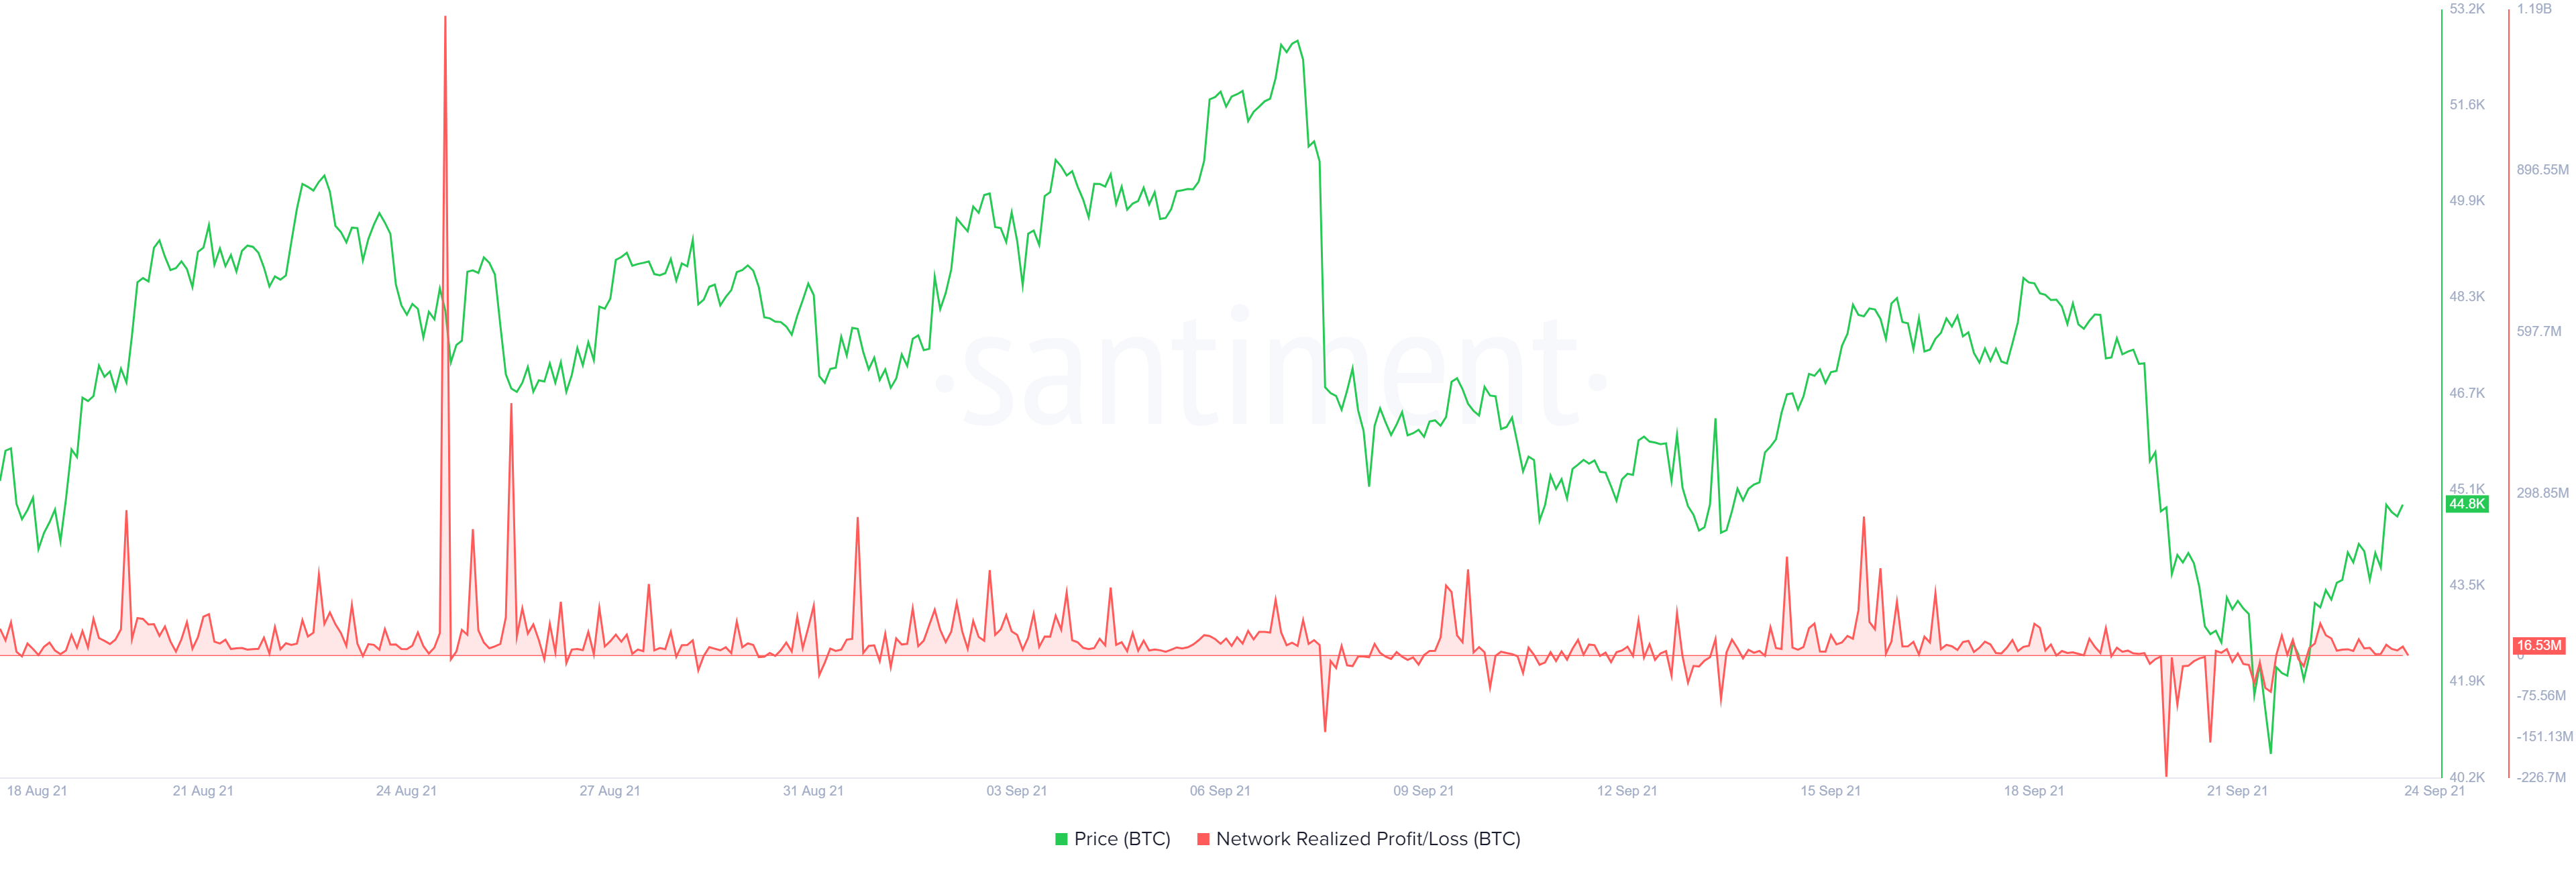
BTC NRPL chart
Lastly, the 365-day Market Value to Realized Value (MVRV) model reset on September 21, indicating that the threat of a sell-off, however short-term, has passed. Therefore, market participants can expect a brief rally.
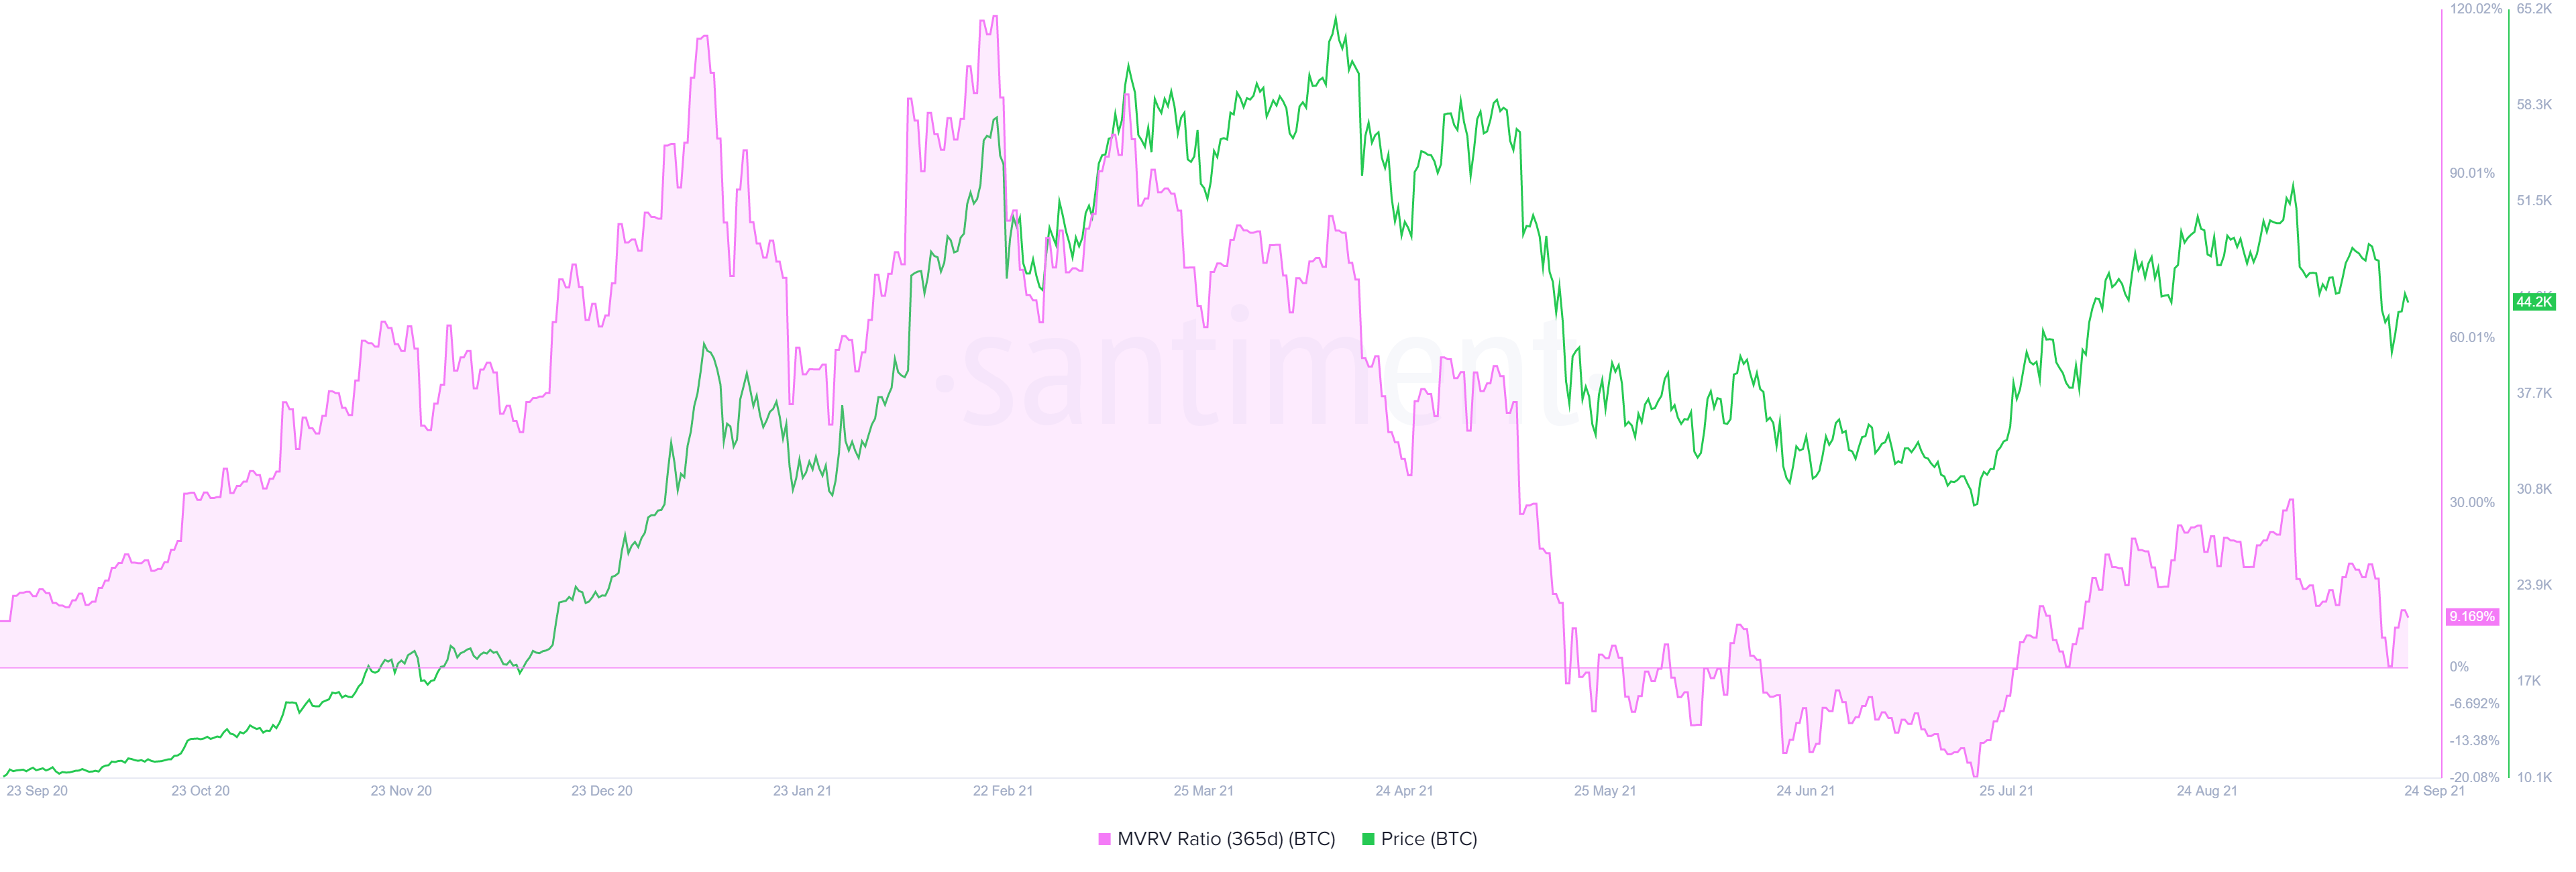
BTC 365-day MVRV chart
While things seem to be going well for Bitcoin, the hurdles at $46,586, $49,436 and $52,956 will play a crucial role in shaping the uptrend. However, if the buyers fail to step in and take control, the bounce off the 50% Fibonacci retracement at $41,126 will likely revisit the area. If things spin out of control, BTC could slice through it and venture down to retest the swing lows formed on August 3 at $38,287.
In some cases, if the selling pressure is too high, Bitcoin price might wick down to the 70.5% Fibonacci retracement level at $36,276 or $34,265. Signaling a similar outlook is the funding rate of BTC, which dipped into negative territory today.
This move indicates that investors are shorting BTC, revealing their bearish sentiment.
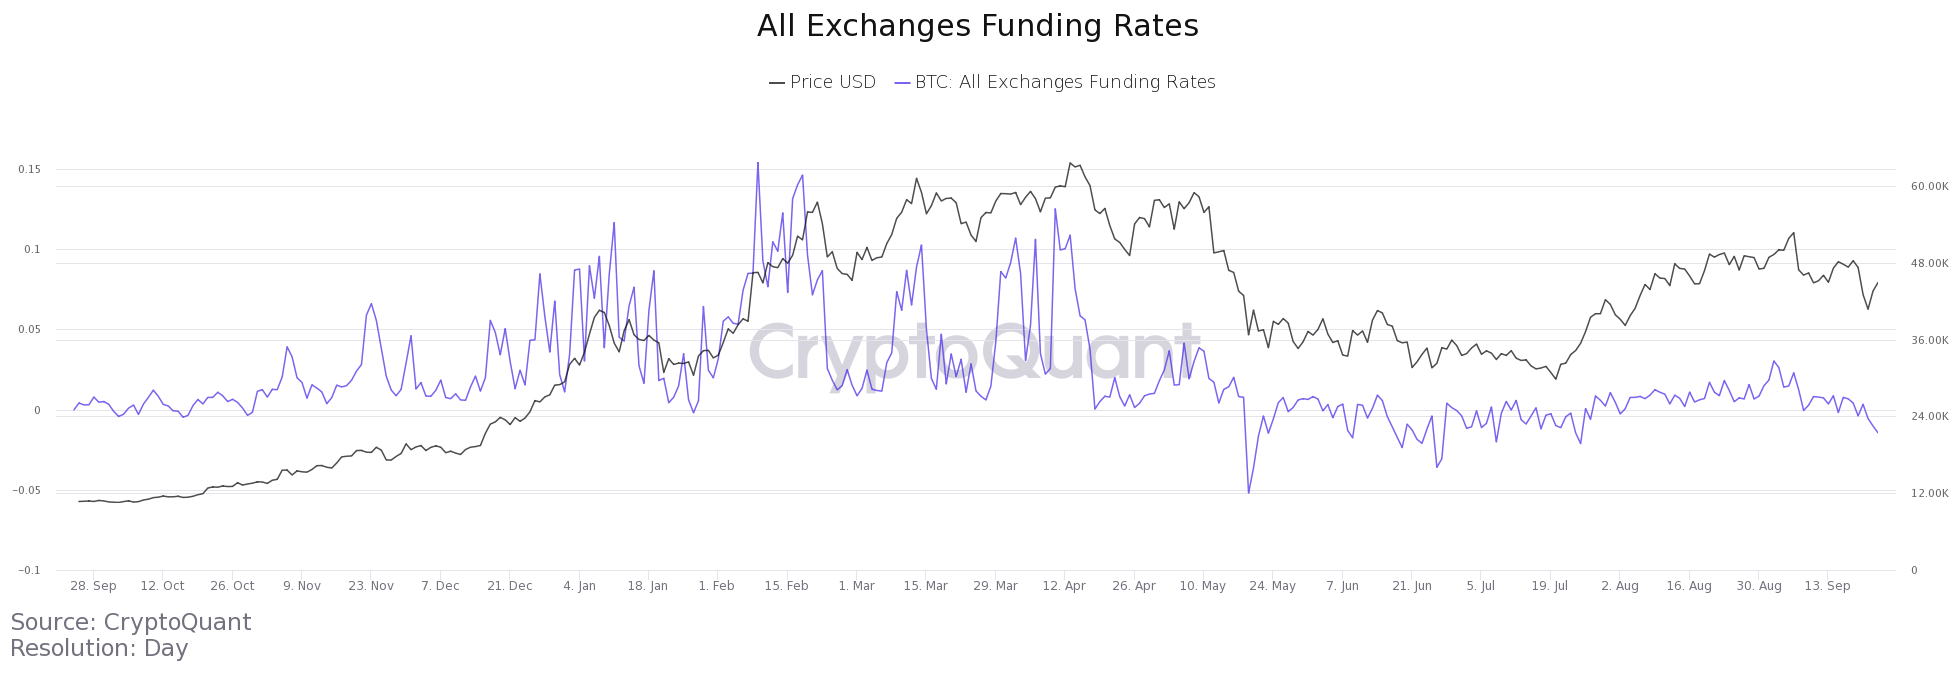
BTC funding rate chart
As long as Bitcoin price stays above the range low at $29,296, the bullish scenario will remain intact despite the temporary downswing currently on display. A breach of this level will create a lower low on a macro scale and potentially trigger a downswing to $26,466.
Information on these pages contains forward-looking statements that involve risks and uncertainties. Markets and instruments profiled on this page are for informational purposes only and should not in any way come across as a recommendation to buy or sell in these assets. You should do your own thorough research before making any investment decisions. FXStreet does not in any way guarantee that this information is free from mistakes, errors, or material misstatements. It also does not guarantee that this information is of a timely nature. Investing in Open Markets involves a great deal of risk, including the loss of all or a portion of your investment, as well as emotional distress. All risks, losses and costs associated with investing, including total loss of principal, are your responsibility. The views and opinions expressed in this article are those of the authors and do not necessarily reflect the official policy or position of FXStreet nor its advertisers. The author will not be held responsible for information that is found at the end of links posted on this page.
If not otherwise explicitly mentioned in the body of the article, at the time of writing, the author has no position in any stock mentioned in this article and no business relationship with any company mentioned. The author has not received compensation for writing this article, other than from FXStreet.
FXStreet and the author do not provide personalized recommendations. The author makes no representations as to the accuracy, completeness, or suitability of this information. FXStreet and the author will not be liable for any errors, omissions or any losses, injuries or damages arising from this information and its display or use. Errors and omissions excepted.
The author and FXStreet are not registered investment advisors and nothing in this article is intended to be investment advice.
Recommended Content
Editors’ Picks

Whale grabs 16,000 ETH as Ethereum Foundation vows support for L1, RWA and stablecoins
Ethereum Foundation's Co-Executive Director Tomasz K. Stańczak highlights simplified roadmap scaling blobs and improving L1 performance. Ethereum whale scoops 16,000 ETH, emphasizing growing interest in the token as the price recovers.

Bitcoin retests key resistance at $85K, breakout to $90K or rejection to $78K?
Bitcoin (BTC) price edges higher and approaches its key resistance at $85,000 on Monday, with a breakout indicating a bullish trend ahead. Metaplanet announced Monday that it purchased an additional 319 BTC, bringing its total holdings to 4,525 BTC.

XRP price teases breakout, bulls defend $2 support
Ripple (XRP) price grinds higher and trades at $2.15 during the early European session on Monday. The token sustained a bullish outlook throughout the weekend supported by bullish sentiment from the 90-day tariff suspension in the United States.

Senator Elizabeth Warren launches fresh offensive on crypto
Senators Elizabeth Warren, Mazie K. Hirono, and Dick Durbin want the DoJ’s decision to terminate crypto investigations reversed. The Senators raise concerns over the DoJ’s shift in priorities, terming it a “grave mistake.”

Bitcoin Weekly Forecast: Market uncertainty lingers, Trump’s 90-day tariff pause sparks modest recovery
Bitcoin (BTC) price extends recovery to around $82,500 on Friday after dumping to a new year-to-date low of $74,508 to start the week. Market uncertainty remains high, leading to a massive shakeout, with total liquidations hitting $2.18 billion across crypto markets.

The Best brokers to trade EUR/USD
SPONSORED Discover the top brokers for trading EUR/USD in 2025. Our list features brokers with competitive spreads, fast execution, and powerful platforms. Whether you're a beginner or an expert, find the right partner to navigate the dynamic Forex market.