- Bitcoin price shows no directional bias since it broke below the one-month-old inclined trend line on August 26.
- BTC adoption holds the line as accumulation kicks in during the recent collapse.
- The descent will likely find support at the demand zone ranging from $44,705 to $46,031.
Bitcoin price was in a sweet spot as it seemingly bounced off a crucial inclined trend line. However, as the selling pressure increased, BTC sliced through the said barrier and dropped lower. While things seem to be cooling off, directional bias is still unconfirmed for the big crypto.
Adoption and accumulation go hand-in-hand
According to a local news agency, Kyrgyzstan’s State Service for Regulation has developed a draft of regulations for crypto exchanges on August 25. The proposed draft aims to legalize crypto exchange operations. It also hopes to reduce risk by introducing frameworks that could help develop a digital economy in Kyrgyzstan by leveraging blockchain technology.
On the note of adoption, Holly Kim, a Lake County treasurer in Illinois, is reportedly accepting crypto donations for her reelection campaign, making her the first political candidate in the state to do so.
The candidate, who is up for reelection, plans to accept Bitcoin (BTC), Dogecoin (DOGE), Ethereum (ETH) and Dai (DAI).
Additionally, the institutions seem to be getting cozy with the second leg of the 2021 bull run, as MicroStrategy announced the addition of 3,907 BTC to its treasury.
Based on the 8-K filing with the Securities & Exchange Commission (SEC), the company purchased 3,907 BTC at an average price of $45,294, pushing its total holdings to 108,991 BTC worth roughly $5.2 billion at the current exchange rate.
In a recent interview, Kraken, a US-based crypto exchange, announced that it is expanding to European markets in 2021. The company is working with the local authorities to receive a license that targets multiple local jurisdictions.
While the exchange is already operating in 190 jurisdictions, this move could be to capitalize on the second phase of the 2021 bull run.
Bitcoin price stuck in limbo
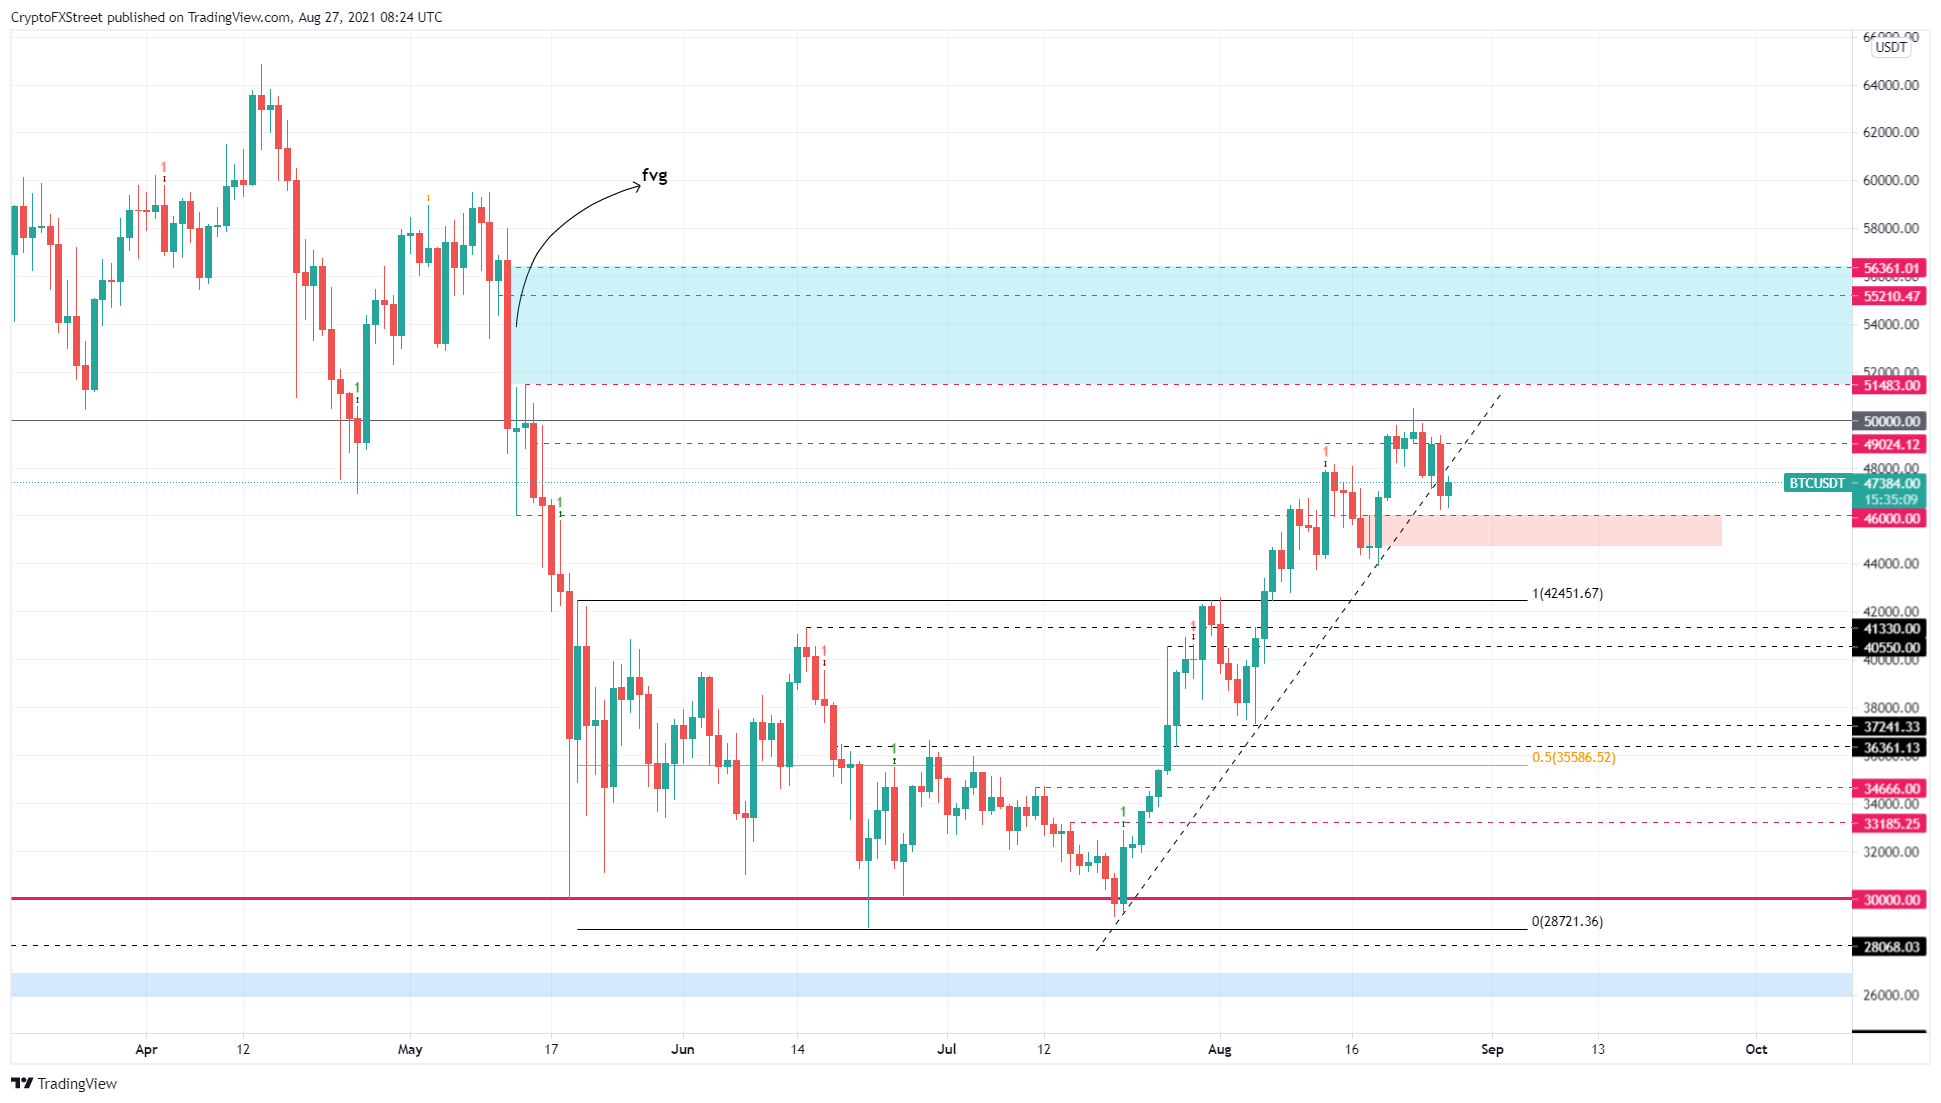
Bitcoin price began its uptrend after dipping below the $30,000 barrier on July 20. Since then, BTC rose roughly 72%, as it pierced the $50,000 psychological level briefly. On its way up, the big crypto respected the inclining trend line perfectly.
However, on August 26, BTC price sliced below this trend line and dropped roughly 6.3%. This move has now pushed the pioneer cryptocurrency in an open space with a demand zone ranging from $44,705 to $46,031.
While the overall trend remains bullish and unchanged, investors need to note that a breach below $44,705 will put the bulls in a tough spot. If the buying pressure increases on the retest of the said support area, however, BTC will likely head to $49,000 and even attempt to retest $50,000.
A decisive daily candlestick close above $51,500 will confirm the start of a new uptrend and propel BTC to roughly $57,000.
BTC/USDT 1-day chart
Supporting a bullish outlook is the Bitcoin supply shock chart, which shows a recent uptick in the exchange supply and the liquid supply.
Willy Woo, a popular on-chain analyst states,
In the last 3 days we’ve seen new buying coming in to absorb coins. We can see this in the Supply Shock chart below, switching towards the demand side. There was also passive buying in the order flow seen on exchanges. This has contained the downside risk in price action.
BTC supply shock chart
Furthermore, August 26 saw a massive outflow of 2,046 BTC from miners’ wallets. This was the single largest hourly transfer since June 4. The outflow indicates that the backbone of the Bitcoin network, miners, are bullish about BTC price performance.
BTC miner wallet outflows chart
Furthermore, stablecoins on all exchanges have hit a new all-time high at $19.22 billion. This metric tracks the number of stablecoins held on known exchange wallets and can be interpreted as a potential buying power resting on centralized entities, which can be seen as a bullish sign.
Stablecoins held on exchanges chart
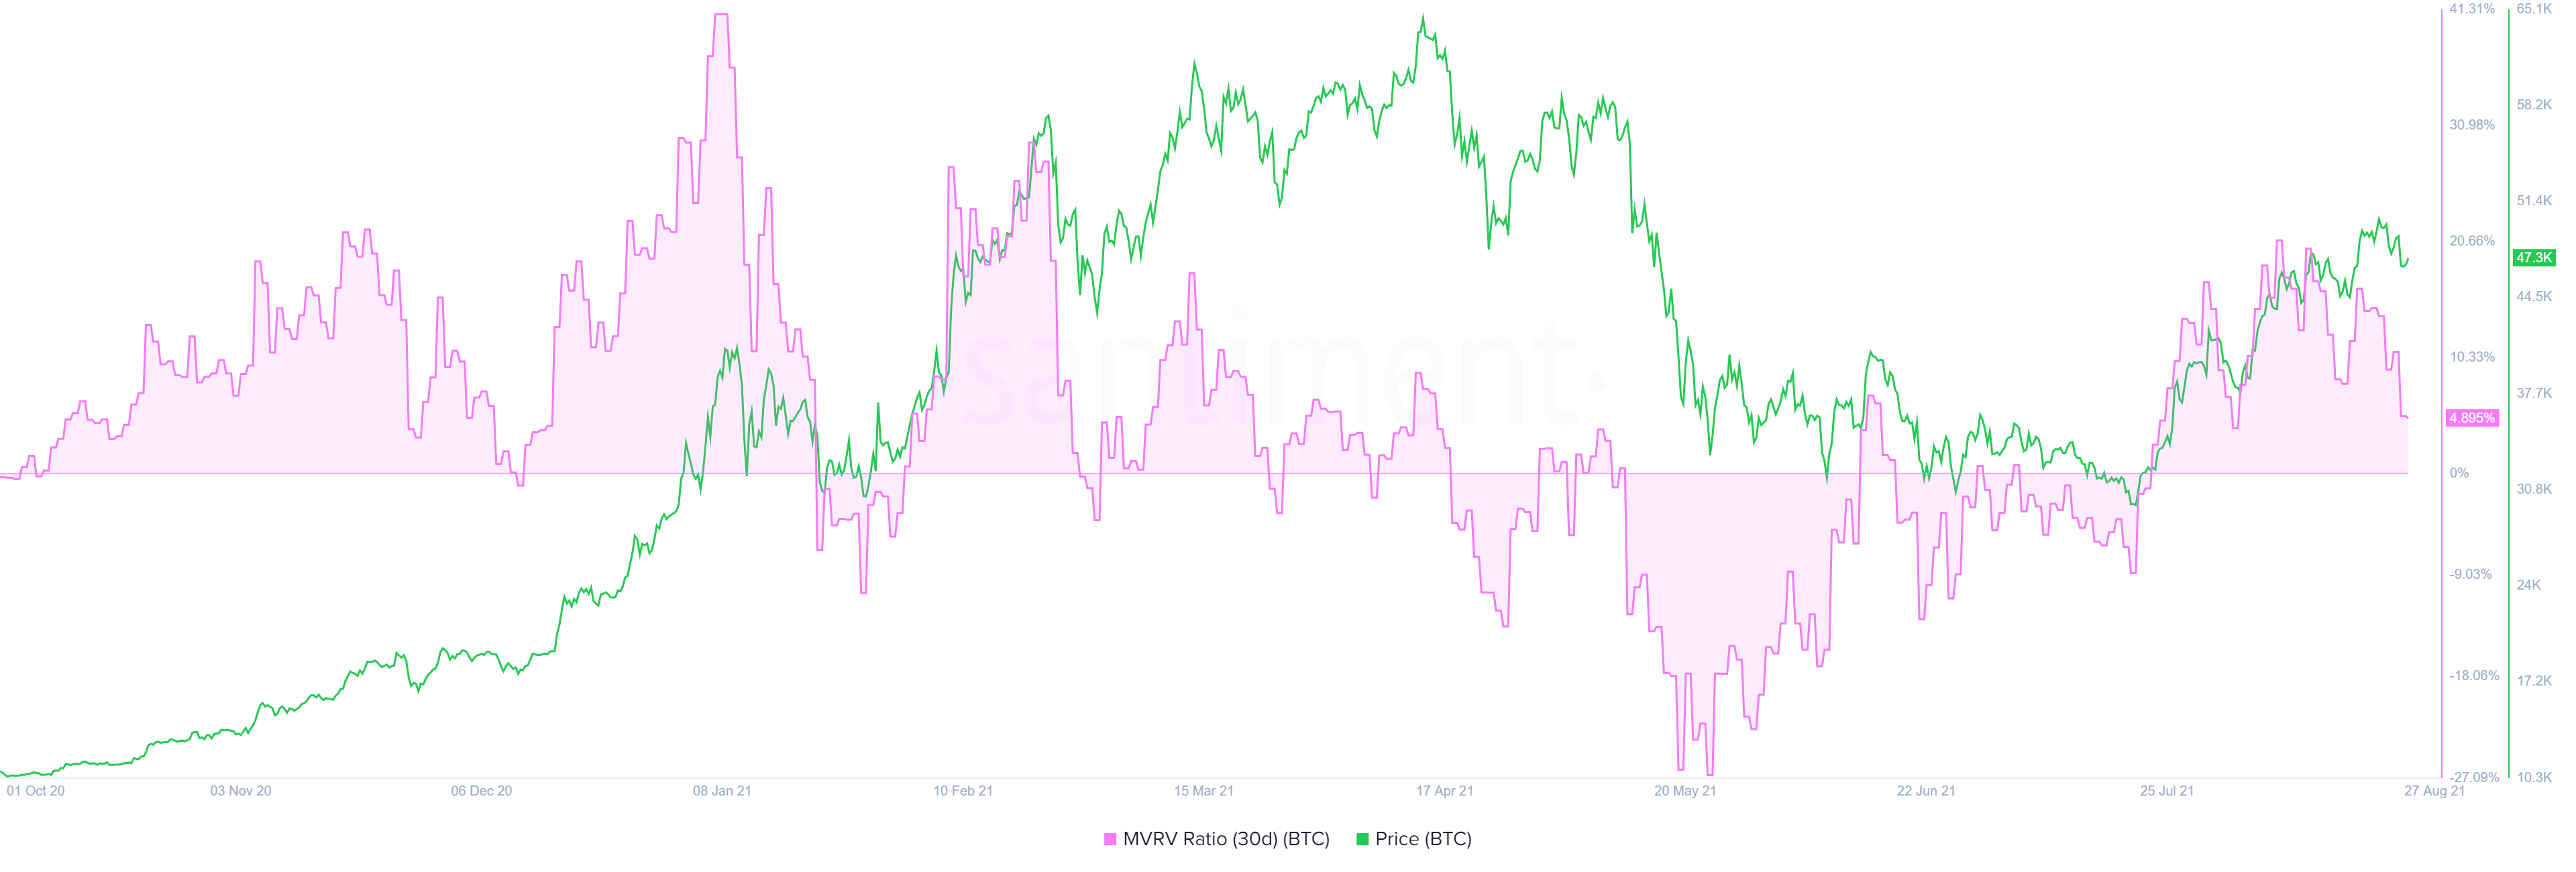
Additionally, painting a bullish outlook is the 30-day Market Value to Realized Value (MVRV) model, hovering at 4.8%. This fundamental indicator tracks the average profit/loss of investors that purchased BTC over the past month.
A lower MVRV value indicates that the investors have booked profit and that the short-term outlook remains bullish and free from unexpected sell-offs.
BTC 30-day MVRV chart
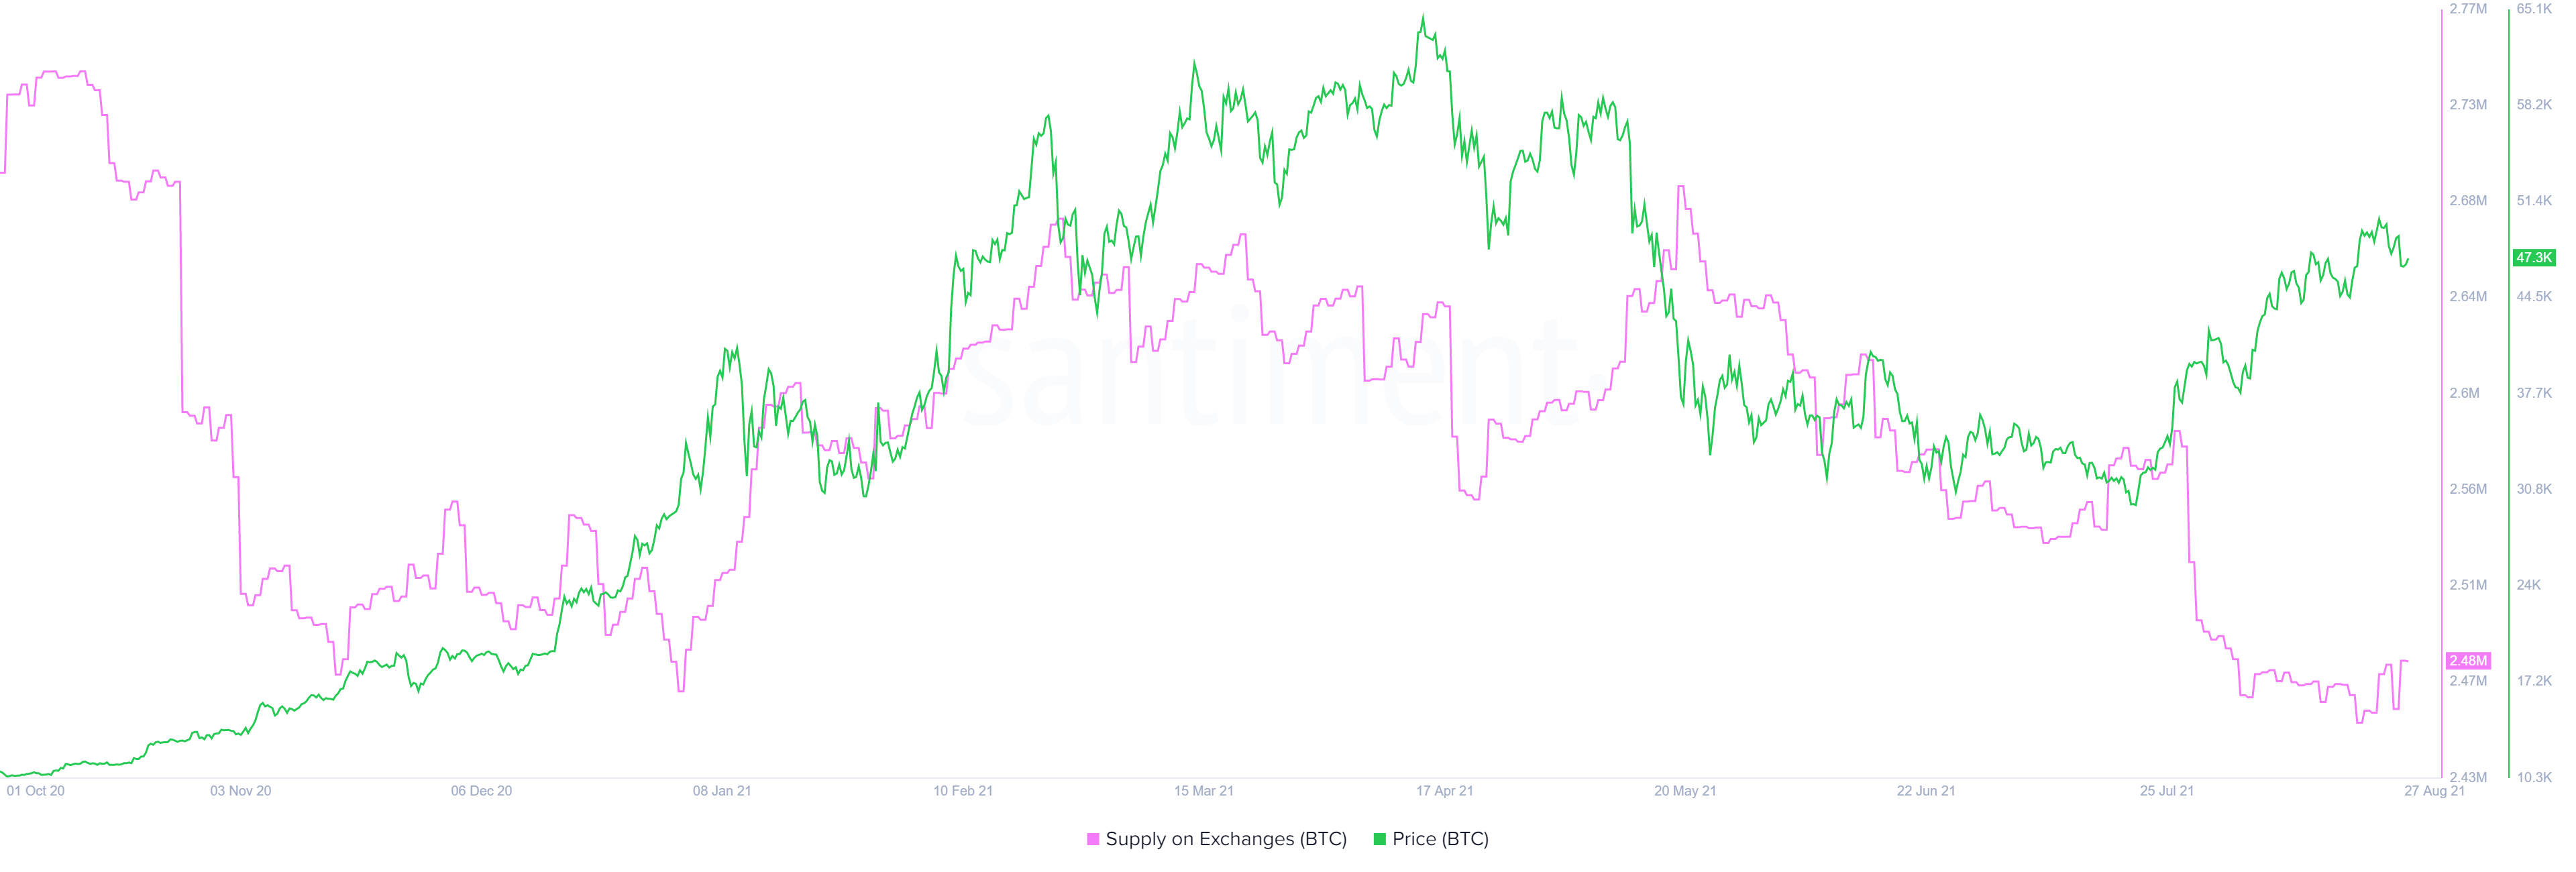
While things do not seem so bad for Bitcoin price in the short-term, it could get worse since the supply of BTC held on exchanges has increased from 2.46 million to 2.48 million since August 25.
This 20,000 BTC inflow could further cause a crash if investors decide to cash in their profits.
BTC supply on exchange chart
If the demand zone ranging from $44,705 to $46,031 breaks down due to an unforeseen spike in selling pressure, it will invalidate the bullish thesis. In some cases, BTC might crash 5% to retest the $42,000 support level or lower.
Information on these pages contains forward-looking statements that involve risks and uncertainties. Markets and instruments profiled on this page are for informational purposes only and should not in any way come across as a recommendation to buy or sell in these assets. You should do your own thorough research before making any investment decisions. FXStreet does not in any way guarantee that this information is free from mistakes, errors, or material misstatements. It also does not guarantee that this information is of a timely nature. Investing in Open Markets involves a great deal of risk, including the loss of all or a portion of your investment, as well as emotional distress. All risks, losses and costs associated with investing, including total loss of principal, are your responsibility. The views and opinions expressed in this article are those of the authors and do not necessarily reflect the official policy or position of FXStreet nor its advertisers. The author will not be held responsible for information that is found at the end of links posted on this page.
If not otherwise explicitly mentioned in the body of the article, at the time of writing, the author has no position in any stock mentioned in this article and no business relationship with any company mentioned. The author has not received compensation for writing this article, other than from FXStreet.
FXStreet and the author do not provide personalized recommendations. The author makes no representations as to the accuracy, completeness, or suitability of this information. FXStreet and the author will not be liable for any errors, omissions or any losses, injuries or damages arising from this information and its display or use. Errors and omissions excepted.
The author and FXStreet are not registered investment advisors and nothing in this article is intended to be investment advice.
Recommended Content
Editors’ Picks

Bitcoin, Ethereum and XRP steady as China slaps 125% tariff on US, weekend sell-off looming?
The Cryptocurrency market shows stability at the time of writing on Friday, with Bitcoin (BTC) holding steady at $82,584, Ethereum (ETH) at $1,569, and Ripple (XRP) maintaining its position above $2.00.

Bitcoin Weekly Forecast: Market uncertainty lingers, Trump’s 90-day tariff pause sparks modest recovery
Bitcoin price extends recovery to around $82,500 on Friday after dumping to a new year-to-date low of $74,508 to start the week. Market uncertainty remains high, leading to a massive shakeout, with total liquidations hitting $2.18 billion across crypto markets.

Bitcoin, Ethereum, Dogecoin and Cardano stabilze – Why crypto is in limbo
Bitcoin, Ethereum, Dogecoin and Cardano stabilize on Friday as crypto market capitalization steadies around $2.69 trillion. Crypto traders are recovering from the swing in token prices and the Monday bloodbath.

Can FTX’s 186,000 unstaked SOL dampen Solana price breakout hopes?
Solana price edges higher and trades at $117.31 at the time of writing on Friday, marking a 3.4% increase from the $112.80 open. The smart contracts token corrected lower the previous day, following a sharp recovery to $120 induced by US President Donald Trump’s 90-day tariff pause on Wednesday.

Bitcoin Weekly Forecast: Market uncertainty lingers, Trump’s 90-day tariff pause sparks modest recovery
Bitcoin (BTC) price extends recovery to around $82,500 on Friday after dumping to a new year-to-date low of $74,508 to start the week. Market uncertainty remains high, leading to a massive shakeout, with total liquidations hitting $2.18 billion across crypto markets.

The Best brokers to trade EUR/USD
SPONSORED Discover the top brokers for trading EUR/USD in 2025. Our list features brokers with competitive spreads, fast execution, and powerful platforms. Whether you're a beginner or an expert, find the right partner to navigate the dynamic Forex market.


-637656514548683296.png)

