Bitcoin Weekly Forecast: BTC price hangs between whales accumulation and miners woes
- Bitcoin price falters, trying to recover, but on-chain metrics suggest a grim outlook.
- Whales bought 77,000 BTC worth $3 billion.
- However, the mining industry seems to be the latest target from Elon Musk, China and even Iran.

Bitcoin price seems to be recuperating from the losses witnessed last week. While institutional investors’ ETF applications are helping bolster the adoption curve and hasten the process, several on-chain metrics combined with the developments surrounding regulating BTC mining in China and Iran has put a nail in the recovery’s coffin.
Institutions flock to SEC for Bitcoin ETF approval
The United States Securities &and Exchange Commission (SEC) is reviewing Bitcoin Exchange Traded Funds (ETF) applications filed by Fidelity and SkyBridge Capital. While new applications for ETFs are stacking, VanEck’s filings are still pending review until June.
Adding a semblance of hope to this delay in adoption is Ray Dalio’s announcement on May 24. The founder of the renowned Bridgewater hedge fund revealed that he was a Bitcoin holder. Despite appreciating the digital asset’s features and capabilities, Dalio warned investors that the increasing popularity of Bitcoin among investors might attract severe regulatory blowback from authorities.
Adding a tailwind to Bitcoin price recovery is the accumulation of BTC from whales during the recent crash on May 19. This development suggests that despite a 51% drawdown from the all-time high, investors are keen on acquiring the pioneer cryptocurrency, which speaks volumes to their bullishness on it.
Chainalysis noted in a recent report that whales bought roughly 77,000 BTC worth nearly $2.85 billion at the time of writing. Despite the mounting buying pressure, the market sell-offs on May 19 or May 23 were caused by the combined efforts of Elon Musk, the state of the cryptocurrency market and China.
Elon Musk reignited the age-old debate about using fossil fuels for mining Bitcoin when he revealed that Tesla would no longer accept BTC as payment. His remarks sent shockwaves across the cryptocurrency market as Bitcoin price started a new descent.
China added fuel to the flame when reports of a mining ban spread like wildfire, tanking BTC price as low as $30,000. This debate was put to rest when MicroStrategy CEO Michael Saylor set up a Bitcoin Council to promote energy usage transparency to "accelerate sustainability initiatives worldwide."
While Iran is enforcing an outright ban, Sichuan’s government officials plan to host a seminar next week to identify the impact of the Bitcoin mining ban on hydroelectricity excess. Although the decision is yet to be made, its effects are already being felt in the Chinese mining ecosystem.
For instance, the Antminer S19 equipment cost has gone down from $12,000 to $8,000 in anticipation of the government’s anti-mining policy.
Bitcoin price ponders recovery and another sell-off
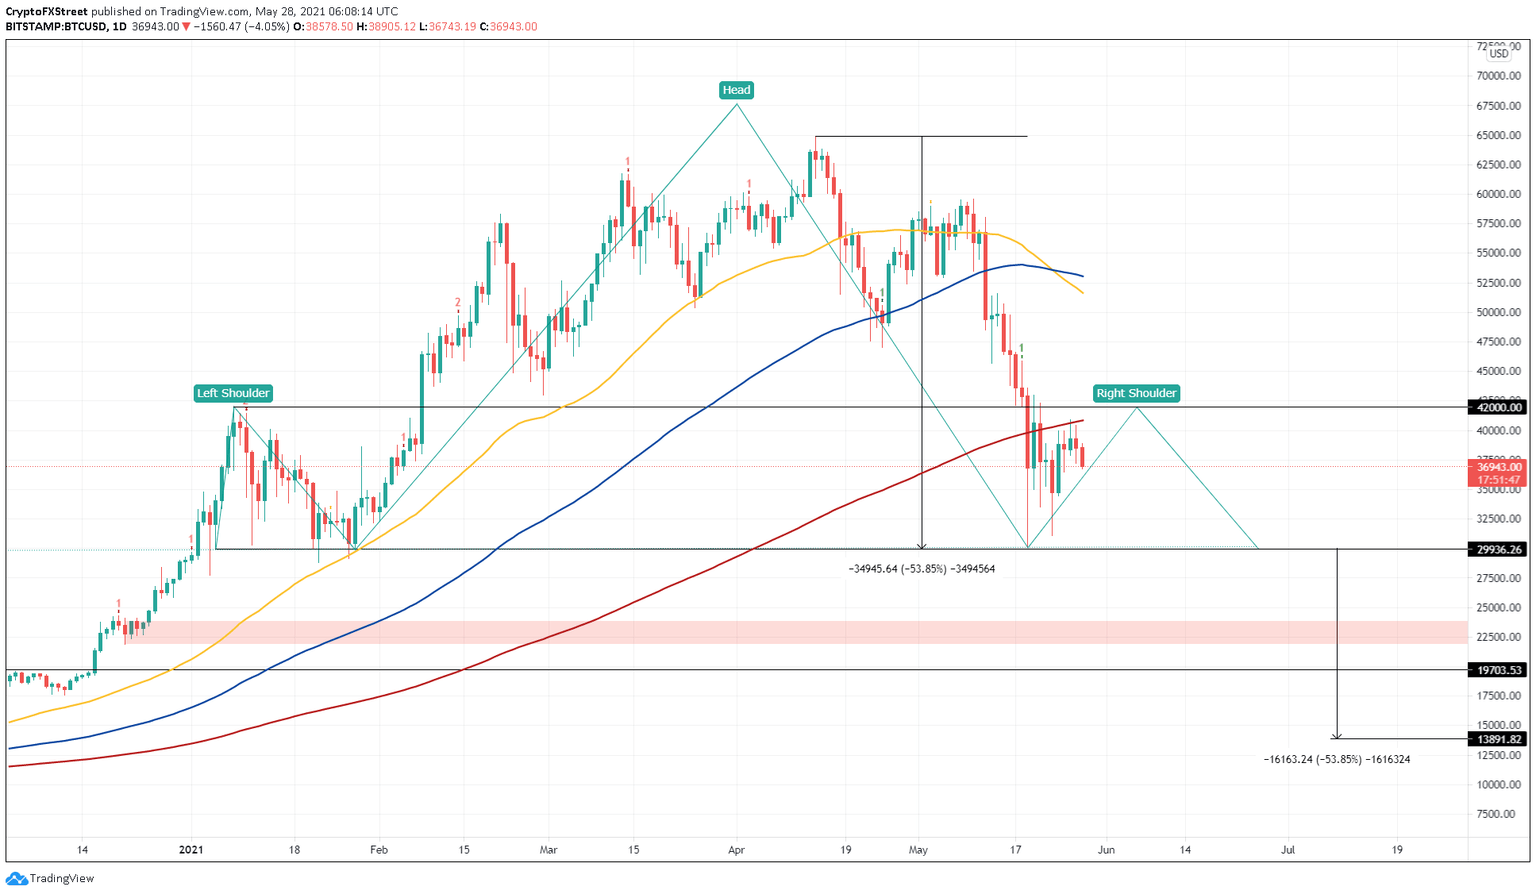
Bitcoin price has surged 35% since May 19 but faced stiff resistance from the 200-day Simple Moving Average (SMA) at $40,700. The rejection led to an 11% decline in the market value of BTC to where it currently stands, $36,943.
Interestingly, the pioneer cryptocurrency appears to be building up toward a potential top in the form of a head-and-shoulders pattern. A breakdown of the neckline at $29,936 could confirm the start of a bearish reversal. In that case, the setup forecasts a 53.85% retracement, obtained by adding the distance between the head’s peak and the neckline to the breakout point.
Such a pessimistic target puts Bitcoin price at $13,891. However, investors should note that the supply zone, ranging from $21,864 to $23,835, might cushion the fall. The same can be said for the support level at $19,703.
Adding credence to a short-term bearish outlook is the move of the 50-day SMA below the 100-day SMA, forming a death cross on May 23. This development suggests that the short-term bearish momentum is increasing faster than the buying pressure.

BTC/USD 1-day chart
Perhaps the most crucial on-chain data that suggests a bearish outlook is the 50-day average of the Unspent Transaction Outputs (UTXOs) in profit. According to Glassnode, this metric tracks “the percentage of unspent transaction outputs whose price at creation time was lower than the current price.”
The 50-day average of this model is used to identify cycle tops. This metric is currently 95.11%, a level BTC was during the peak of the 2017 bull run in December, adding a tailwind to the bearish narrative detailed above.
BTC percent UTXOs in profit chart
Also supporting the grim outlook for the flagship cryptocurrency is the 365-day Market Value to Realized Value (MVRV) model, which suggests more room for a downside move.
This fundamental index measures the profit/loss of investors who purchased BTC in the past year. While the recent crash tanked MVRV from 118% to 1.77%, there is a chance that it will dip into negative territory, aka the opportunity zone.
Such a move will suggest that the short-term investors are selling, providing an “opportunity” for the long-term holders to accumulate.
BTC 365-day MVRV
If the supply of BTC on an exchange increases, it is bearish since it directly adds to the sell-side pressure. Although this metric increased from 1.87 million to 1.97 between April 30 and May 17, it has decreased by 2% to date.
While this decline is relatively insignificant, investors should keep a close eye on this index.

BTC supply held on exchanges.
A popular technical analyst with the screen name “dave the wave” points out the “elephant in the room,” as he describes that Bitcoin price is not out of the woods yet.
He reveals that the Moving Average Convergence Divergence (MACD) indicator has not yet noticed a bearish crossover despite the brutal sell-off from roughly $50,000 to $30,000.

BLX 1-month chart
As grim as it may sound, Bitcoin price still has room to head higher, at least until $42,000. The bearish thesis put forth by the head-and-shoulders technical pattern will face invalidation if BTC generates a decisive daily candlestick close above the resistance level at $42,000.
Such a move would also put Bitcoin price above the 200-day SMA at $40,770, indicating a shift in trend from bearish to bullish. In that case, investors might see BTC rally 27% to tag the intersection of the 50-day and 100-day SMA at $53,650.
Further supporting this bullish outlook is the low funding rate for BTC futures, which is less than 0.01% on major cryptocurrency exchanges, promoting a quick recovery.
BTC funding rate chart
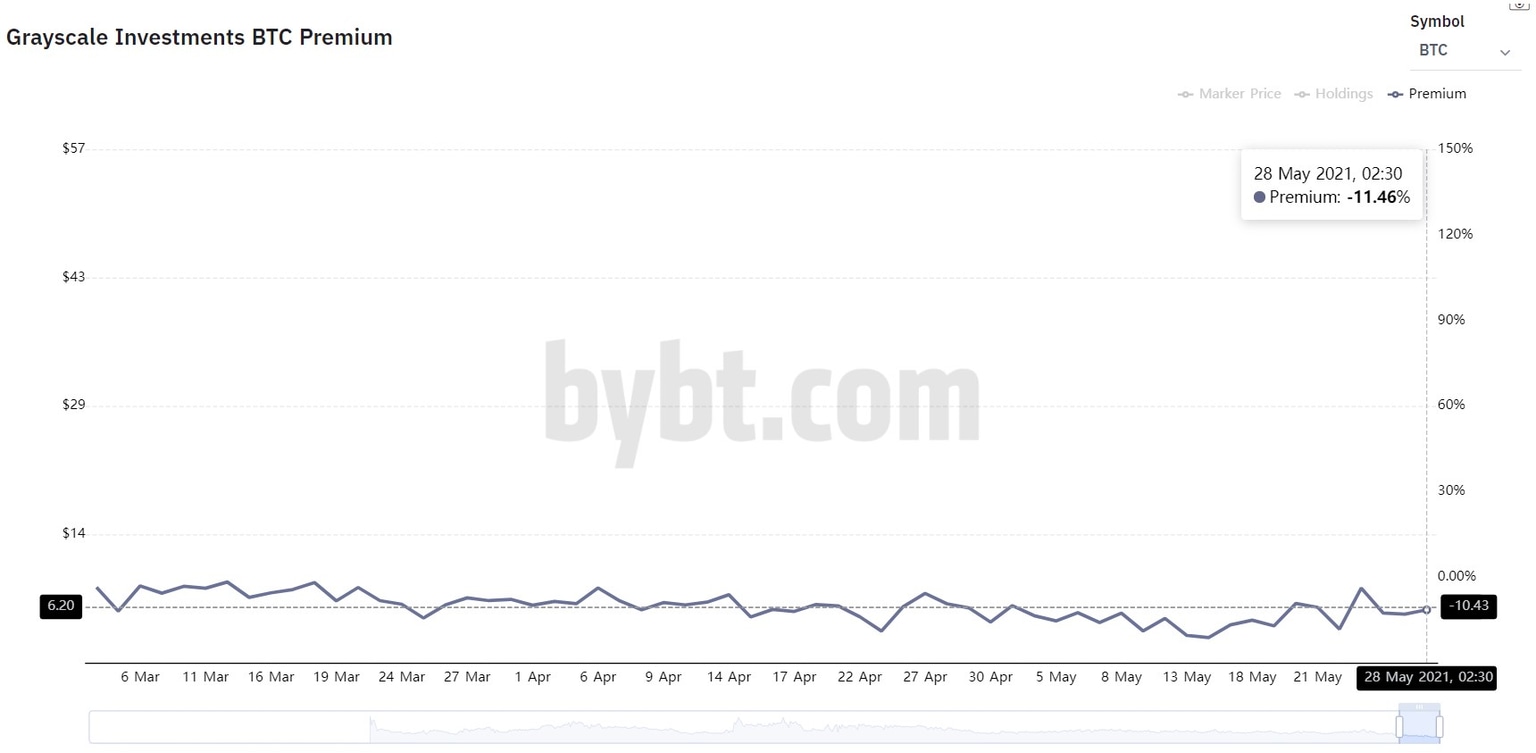
A similar bullish outlook is observed in premium for Grayscale’s GBTC product, which has increased from -21.23% to -11.36% between May 14 and today. This uptick suggests a revitalized interest from investors who are interested in Bitcoin price at the current levels.
BTC Grayscale GBTC premium chart
When the positives are added to the negatives, Bitcoin price is at an inflection point, and nothing is set in stone yet. A sharp decline that breaches the support level at $29,936 indicates the start of a 54% sell-off. However, a decisive daily candlestick close above $42,000 suggests a potential 27% rally to $56,650.
Author

Akash Girimath
FXStreet
Akash Girimath is a Mechanical Engineer interested in the chaos of the financial markets. Trying to make sense of this convoluted yet fascinating space, he switched his engineering job to become a crypto reporter and analyst.


