Bitcoin Weekly Forecast: BTC may capitulate to $30,000
- Bitcoin price has seen a considerable drop this week as it slid below the $39,573 to $46,406 demand zone.
- The recent crash has jeopardized BTC, which hints at a further crash to $30,000 or lower.
- On-chain metrics have aligned to this potential bearish outlook.

Bitcoin price has dropped considerably over the last three weeks. The recent downswing has made things worse for BTC and hints that a steep correction could be on its way.
Bitcoin price at wits’ end
Bitcoin price is in a bearish outlook after the recent crash as it sliced through the $39,573 to $46,406 demand zone. If BTC produces a weekly candlestick close below $39,573, there is a good chance this downtrend will extend lower.
The demand zone extending from $39,573 to $46,406 was major support formed during an uptrend. Therefore, investors that bought BTC at or around this barrier are underwater due to the December 4 crash.
Any upswing that originates after a decisive close below $39,573 will face immense selling pressure from these underwater investors trying to break even. Therefore, the fate of the big crypto is dependent on this week’s close relative to the $39,573 level.
Assuming Bitcoin price fails to recover the recent losses, market participants can expect an 11% crash to the $34,266 support barrier. Here, buyers will probably band together for a comeback. This scenario is unlikely, however, as market makers will likely drag the pioneer cryptocurrency below $31,671 to collect the sell-side liquidity resting below the series of string lows formed in July 2021.
MicroStrategy’s average buy-in price at $29,860 is present just below the $30,000 psychological barrier and is inside the liquidity zone mentioned above. Therefore, investors can expect BTC to see a retest of $30,000 or lower.
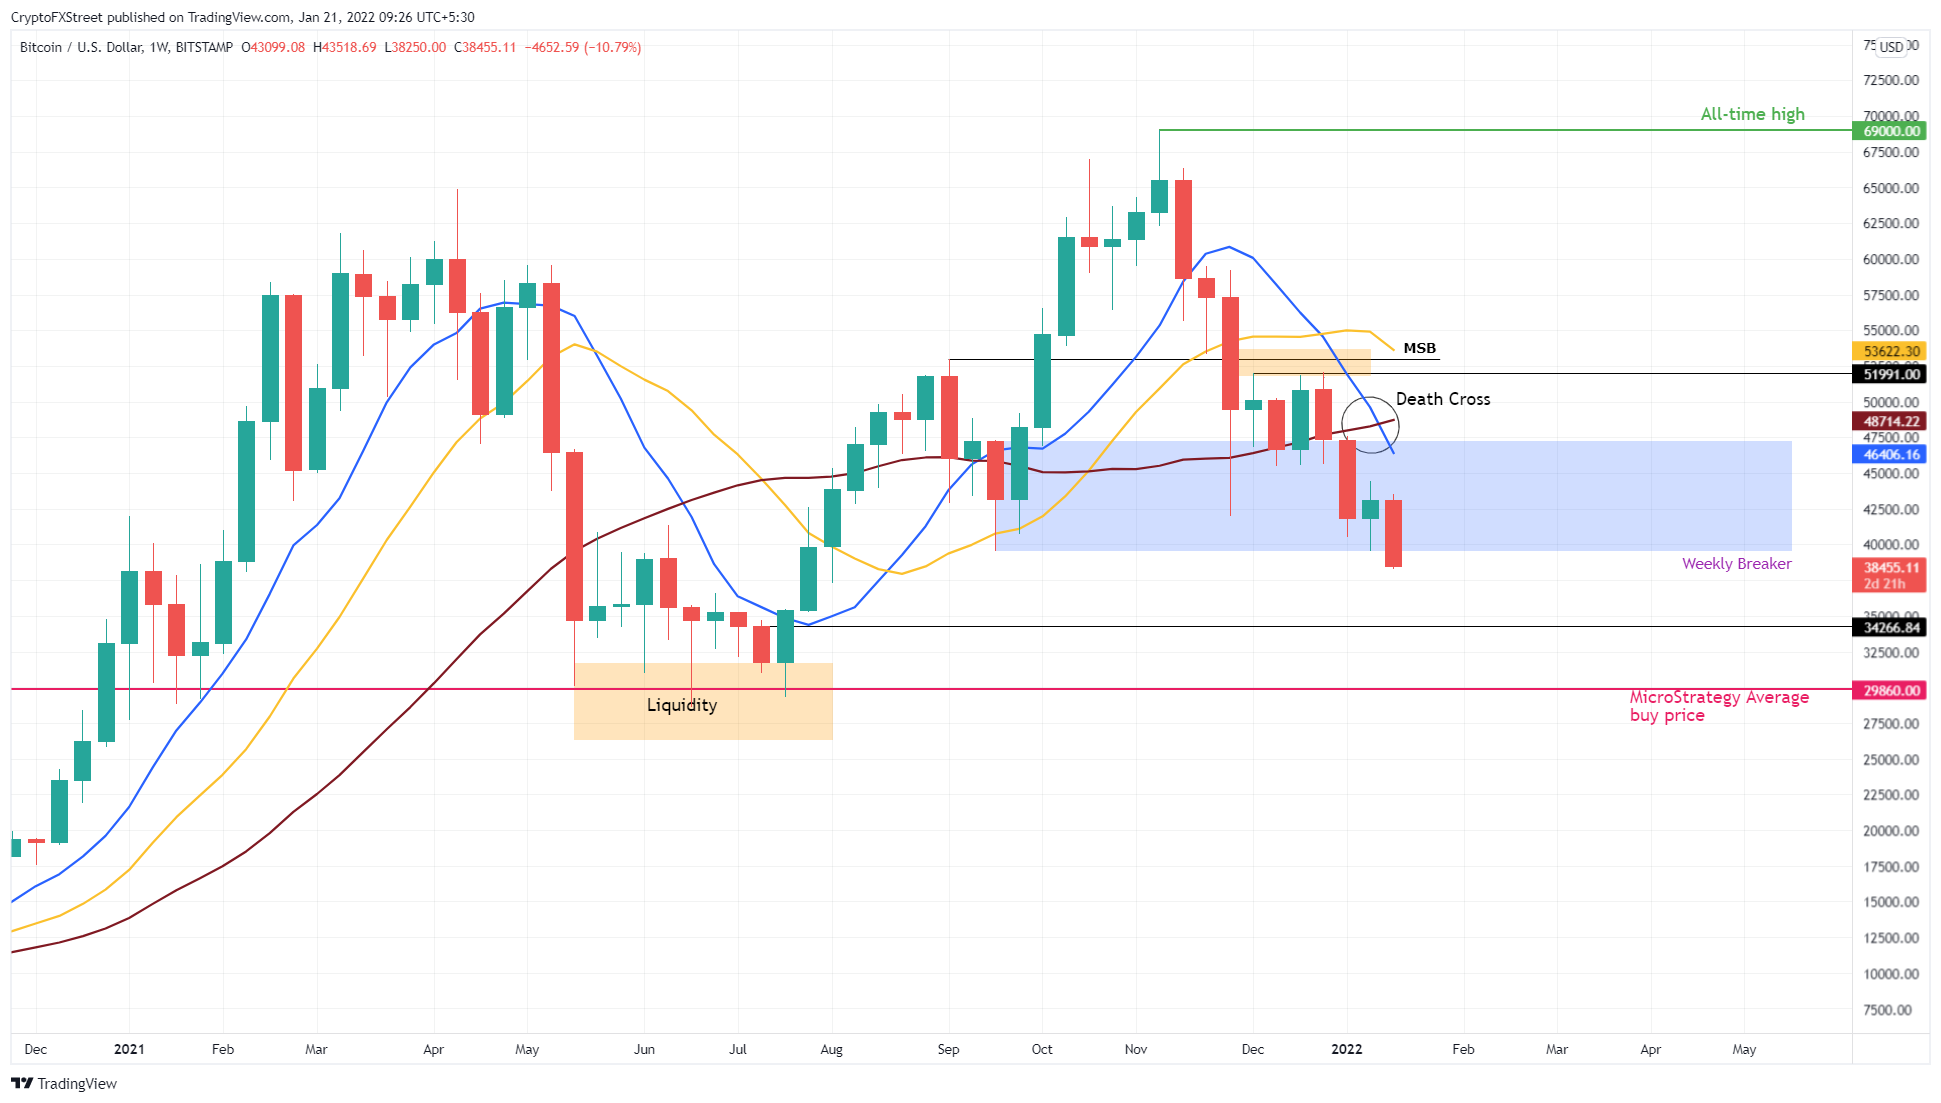
BTC/USD 1-weekly chart
Supporting this crash for Bitcoin price is IntoTheBlock’s Global In/Out of the Money (GIOM) model. This on-chain index shows that the next support area for BTC extends from $11,101 to $34,287. Here, roughly 4.92 million addresses purchased 2.43 million BTC at an average price of $19,668.
Therefore, any downward moves will likely be absorbed by the buying pressure from investors accumulating in this area.
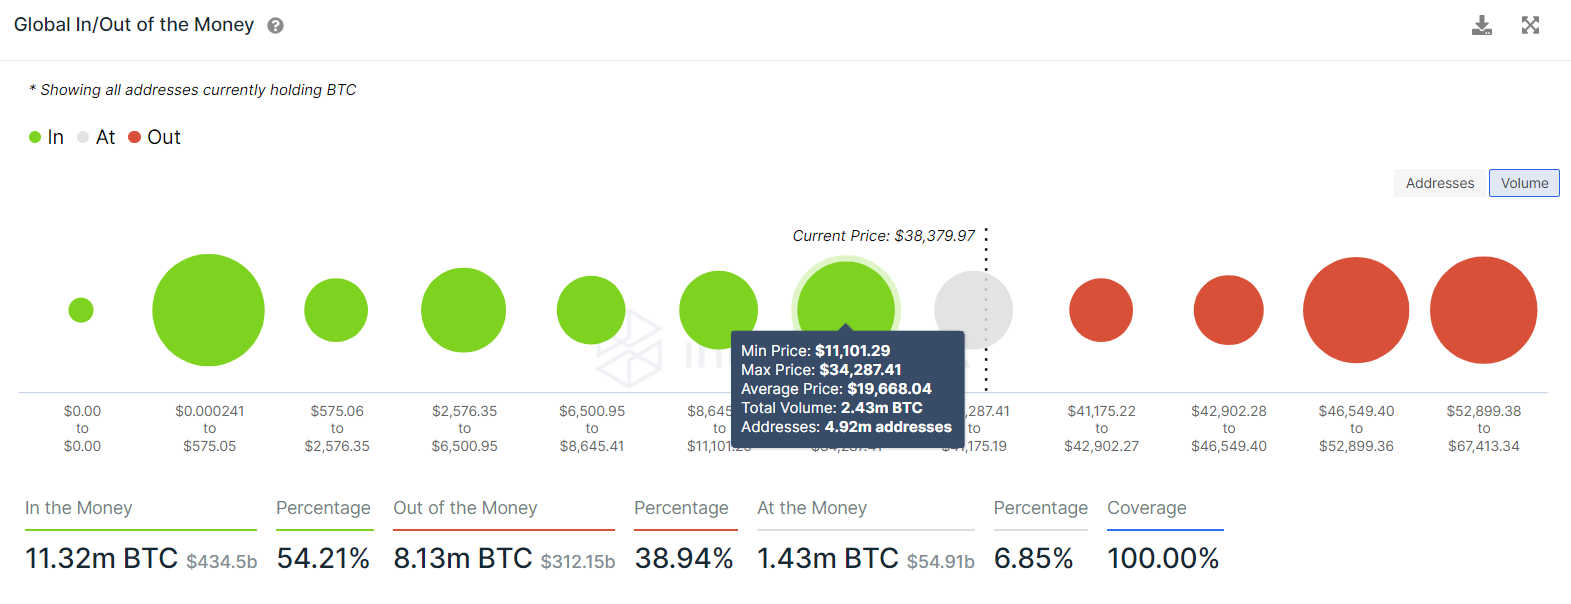
BTC GIOM
Depicting the grim nature of the recent crash is the total number of liquidations seen across the board. Roughly $346 million worth of long positions were liquidated as Bitcoin price crashed 12% in the last two days.
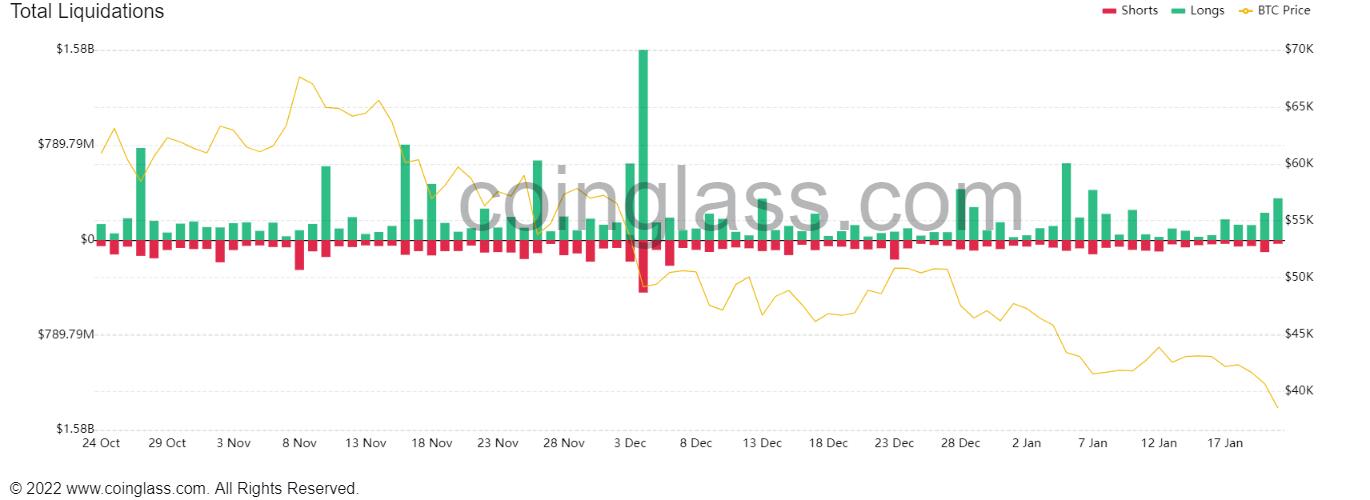
BTC liquidation
The number of daily active addresses paints a picture of the investors’ sentiment and their view on the current price of Bitcoin. In the image attached below, the 50-day Moving Average (MA) of DAA has crossed below the 200-day MA, indicating a bearish crossover. The last time this occurred was on May 17 and was followed by BTC crashing from roughly $46,000 to $29,000.
If history were to repeat itself, there is a good chance Bitcoin price could revisit $29,000, coinciding well with the target forecasted from the technical perspective.
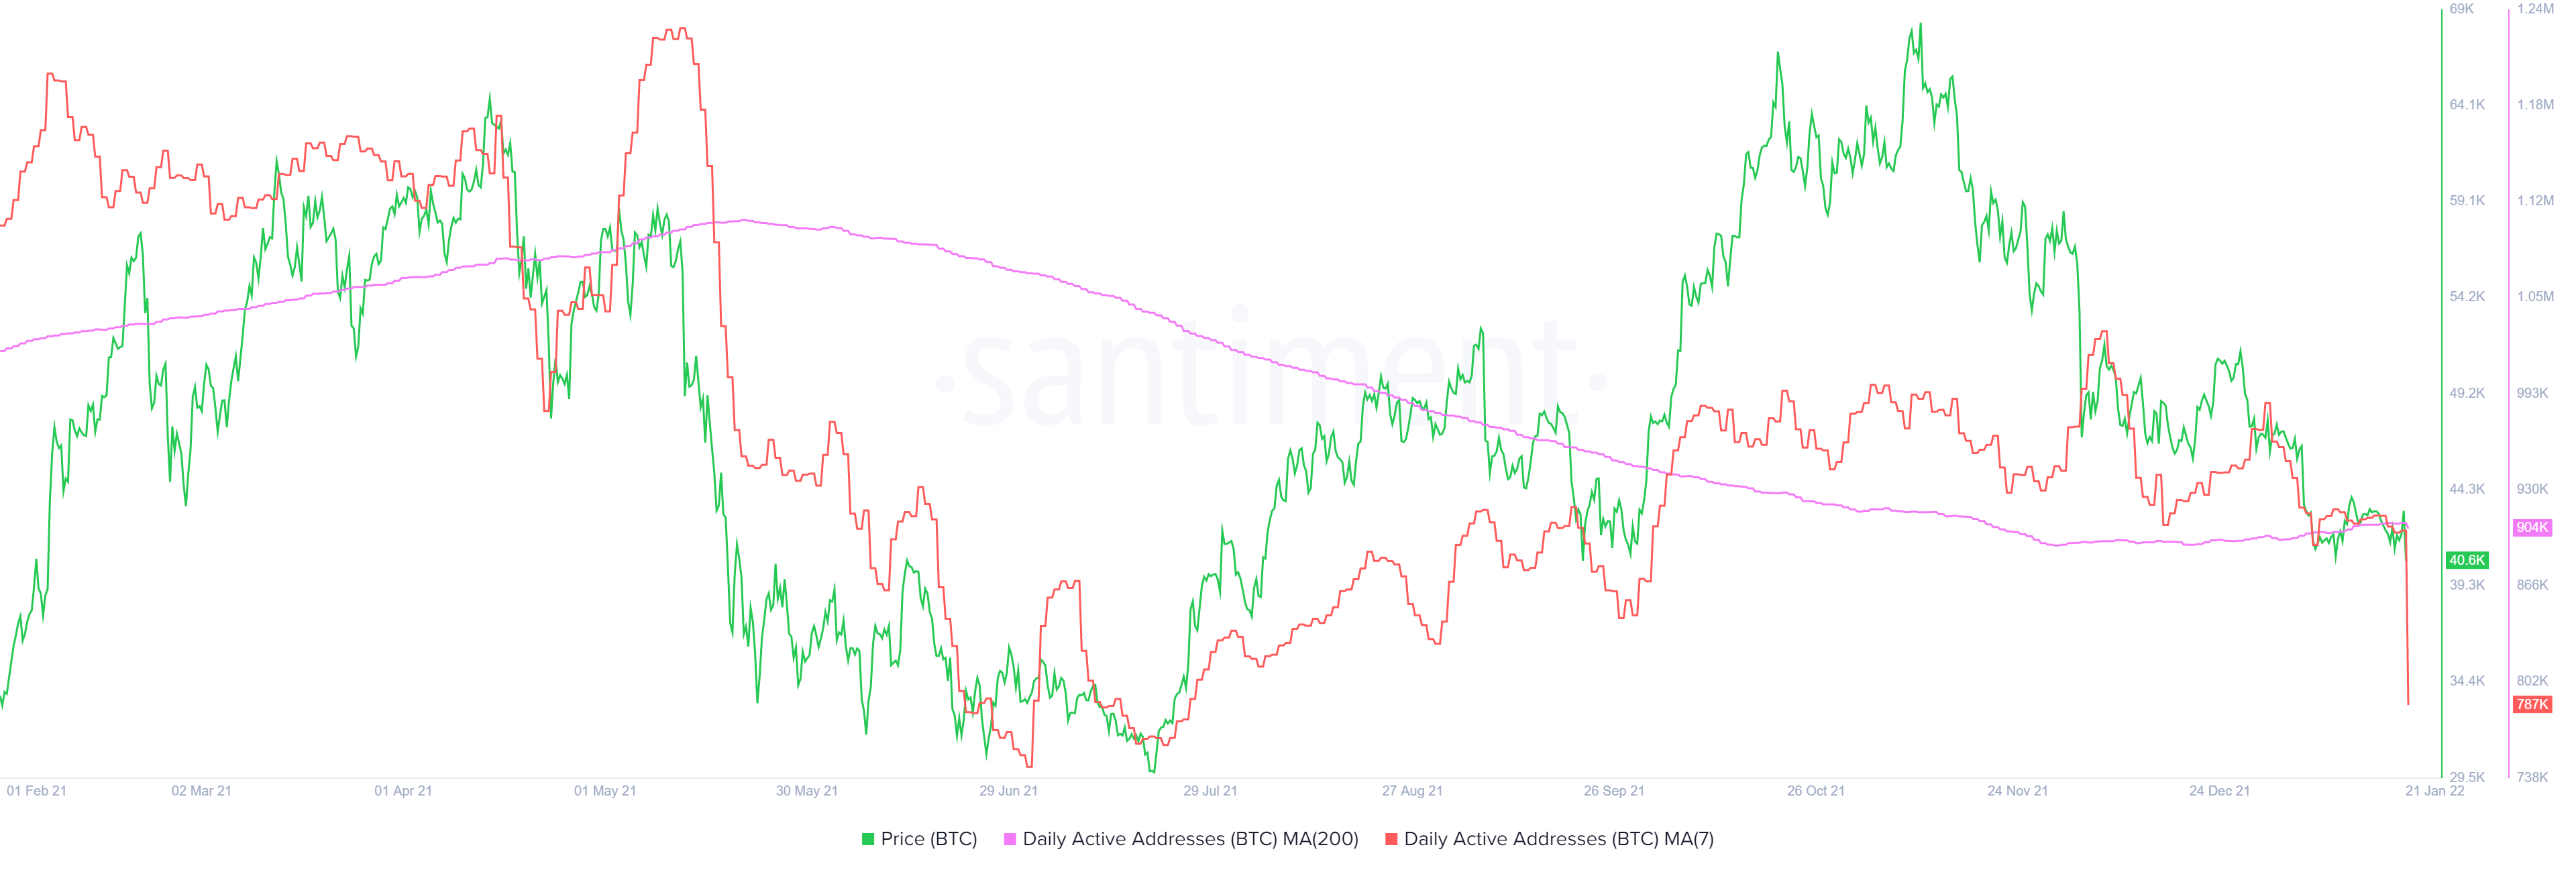
BTC DAA
A majority of the on-chain indicators suggest a bearish outlook for Bitcoin price and align well with the technical forecasts. However, the bearish outlook can be temporarily sidestepped by the big crypto if it recovers above the $39,573.
Supporting the optimistic outlook is the Market Value to Realized Value (MVRV) model. This on-chain metric is used to determine the average profit/loss of investors that purchased BTC over the past year.
Currently, MVRV is hovering at -19%, revealing that short-term holders are at a loss. This level was last seen in July 2021, when BTC bottomed at $29,862 and kick-started an uptrend. This index suggests that all hope is not lost for Bitcoin and that an uptrend is likely to begin if long-term investors come to the rescue.
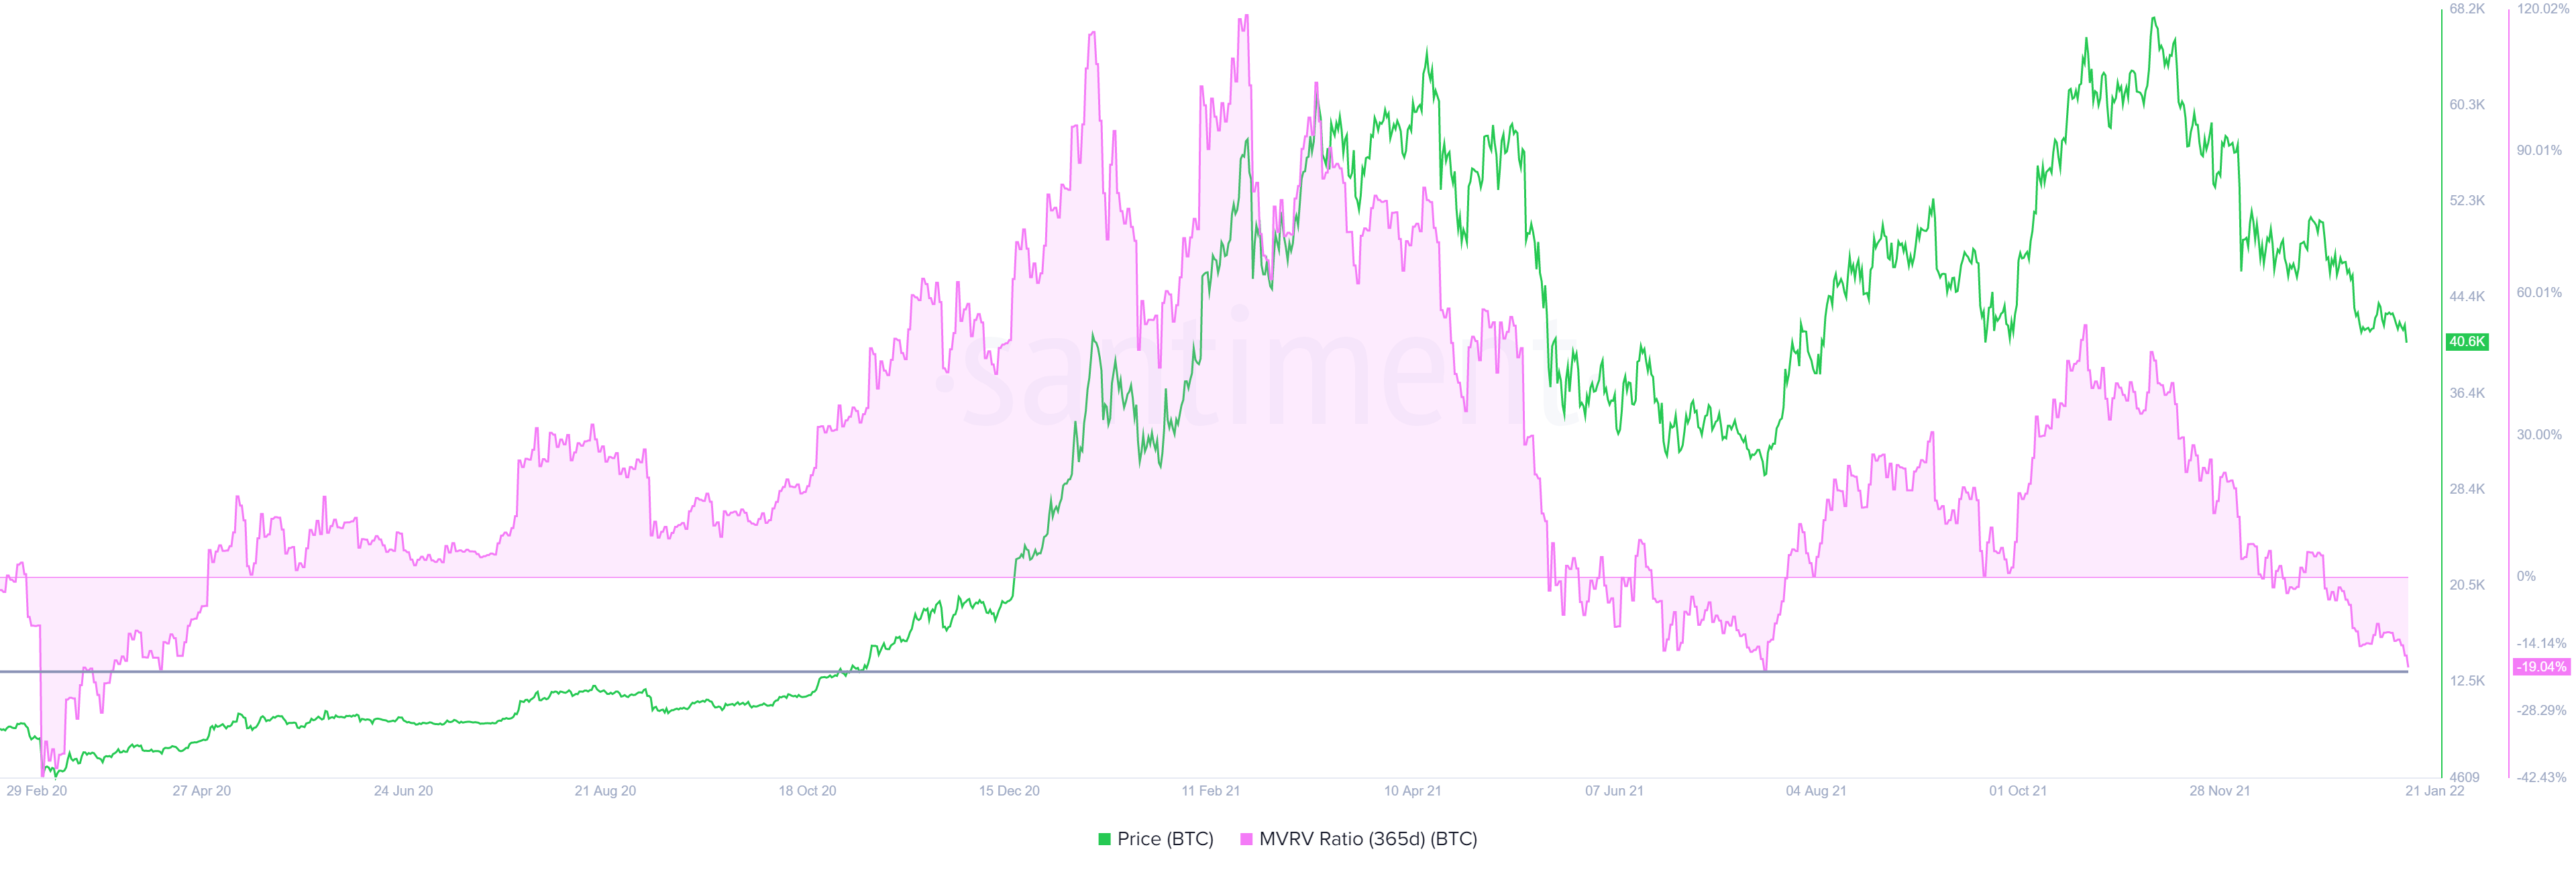
BTC 365-day MVRV
If BTC produces a weekly candlestick close above the supply zone’s upper limit at $47,257, it will invalidate the pessimistic thesis. For a bullish outlook Bitcoin price needs to set a weekly close above $52,150. This will set a higher high, allowing sidelined buyers to step in. Investors can then expect a retest of the $60,000 psychological barrier.
Author

Akash Girimath
FXStreet
Akash Girimath is a Mechanical Engineer interested in the chaos of the financial markets. Trying to make sense of this convoluted yet fascinating space, he switched his engineering job to become a crypto reporter and analyst.


