Bitcoin Weekly Forecast: BTC is on track to $100,000 despite the recent correction
- Bitcoin price plummeted from $35,600 down to 28,850 in less than 48 hours.
- BTC bulls have bought the dip pushing the digital asset above $32,000.
- On-chain metrics and several other indicators show Bitcoin is still poised to hit $100,000 in the long-term.
- The Stock-to-Flow predictive model for Bitcoin remains extremely accurate.

After hitting a new all-time high of $41,950, Bitcoin had a major 31% correction down to $28,850. For the most part, this pullback is considered healthy as past price action indicates it’s normal for the flagship cryptocurrency to experience 30-40% corrections during a bull rally.
Is the bull rally over for Bitcoin?
A lot of cryptocurrency enthusiasts are concerned about the end of the current Bitcoin rally as the digital asset has dropped by more than 30% since its all-time high. However, most on-chain metrics and indicators suggest the run has just barely started.
Back on January 18, we knew that a 30% move was underway according to various indicators. In our article, we presented two potential price targets depending on a breakout or breakdown. The $26,000 target was almost hit. However, now several technicals show that Bitcoin has reached its local bottom.
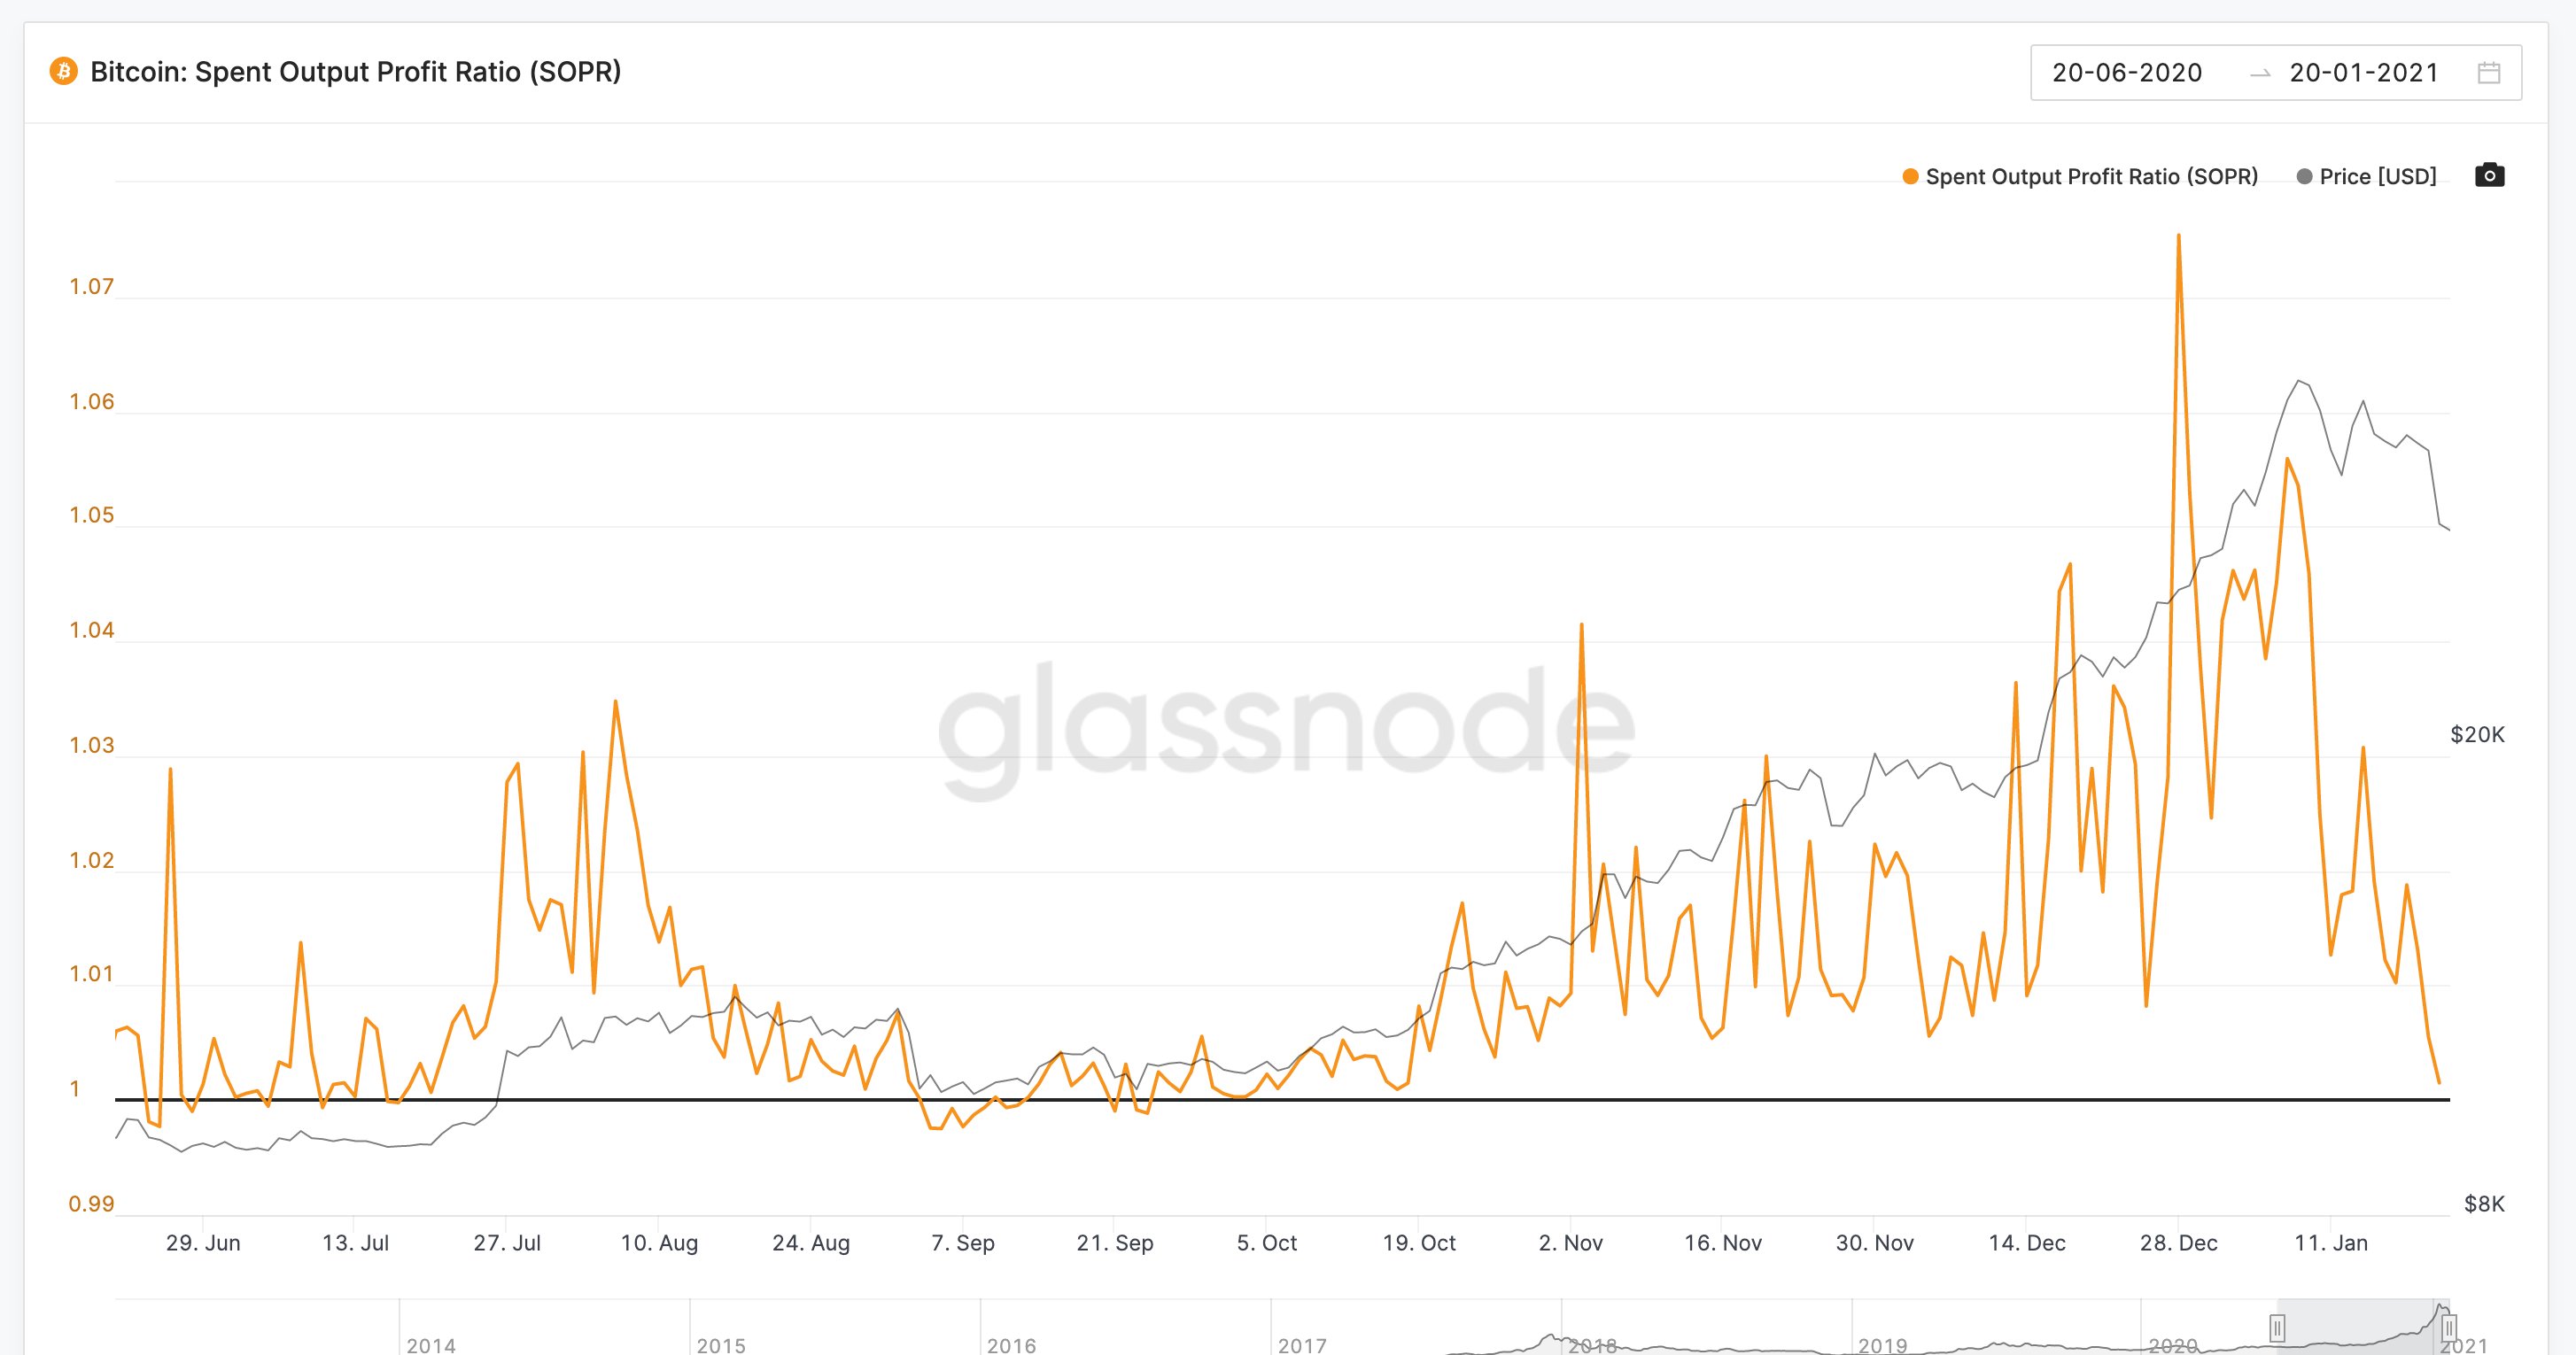
BTC SOPR chart
As we have stated in our last analysis, the SOPR (Spent Output Profit Ratio) indicator has cooled off for the first time since October 2020 and indicates that on average, traders wouldn’t profit anymore from selling Bitcoin.
Bitcoin price remains on its way to $100,000 according to S2F Model
The Stock-to-Flow model is a predictive tool for Bitcoin price created by PlanB. This model relies on Bitcoin’s scarcity and its upcoming halvings. According to the author, the S2F chart predicts where Bitcoin price is headed in the future.
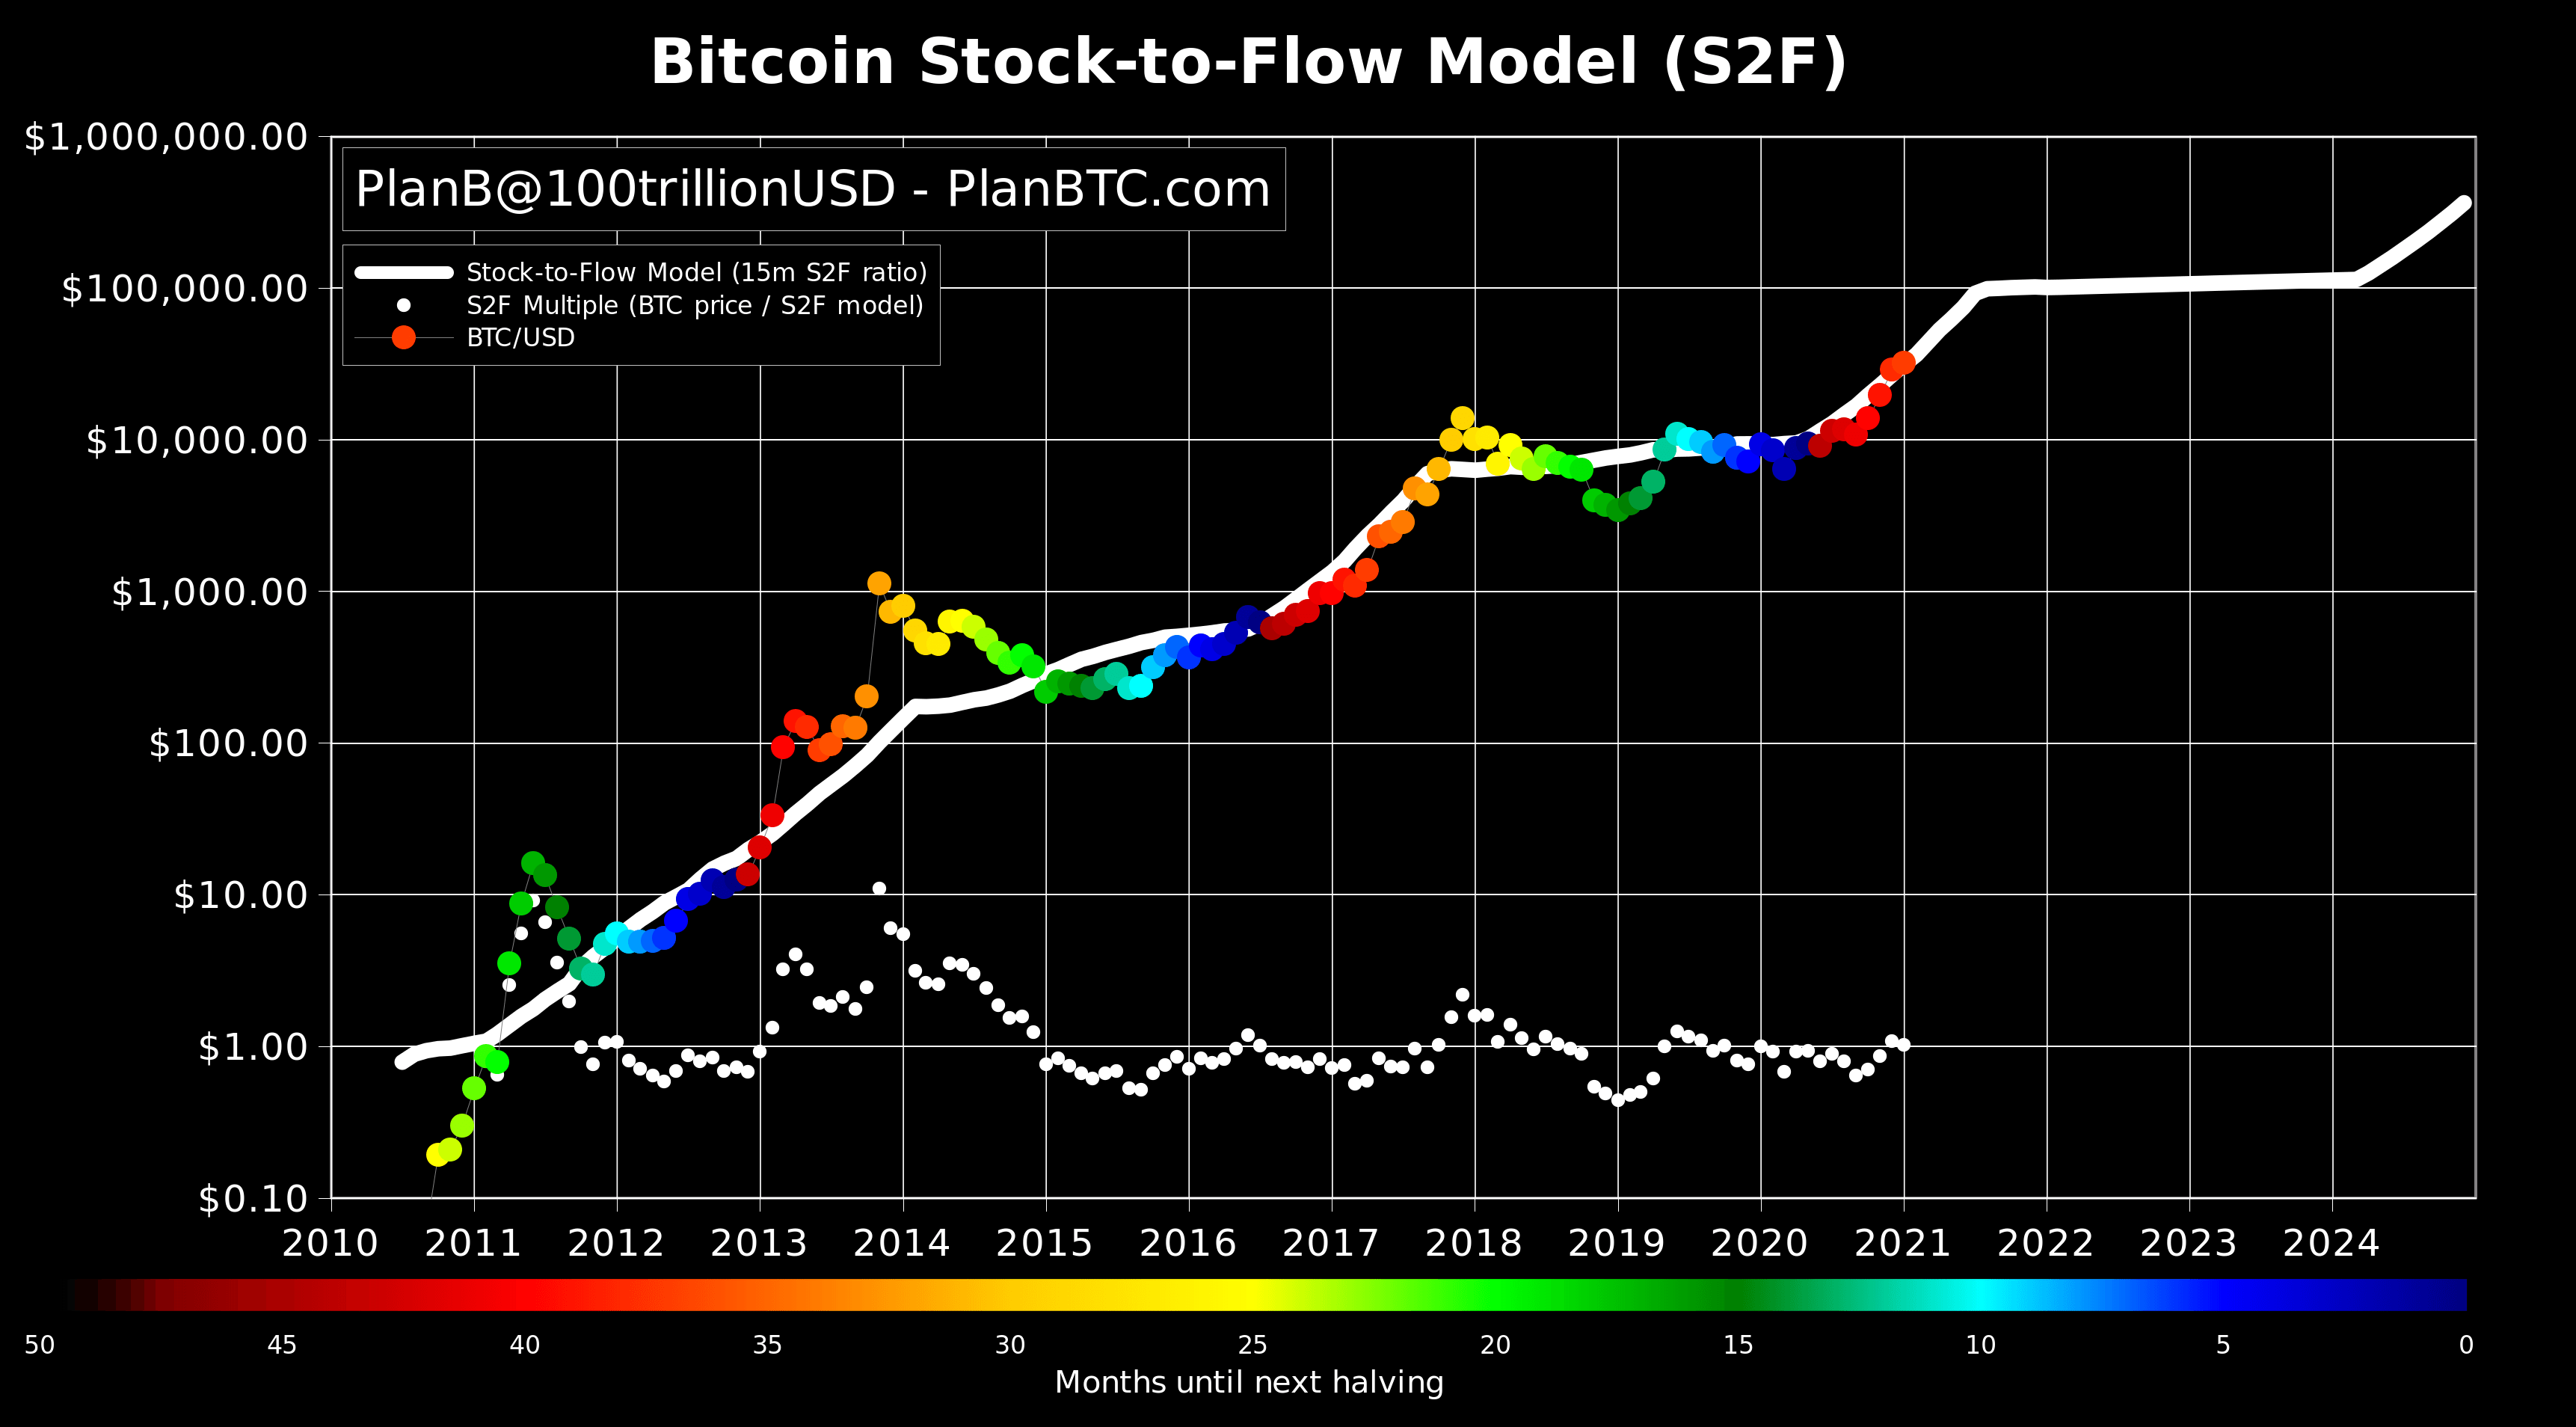
BTC S2F Model
The predicted market value for bitcoin after May 2020 halving is $1trn, which translates in a bitcoin price of $55,000. That is quite spectacular. I guess time will tell and we will probably know one or two years after the halving, in 2020 or 2021
So far the model has been extremely accurate despite the significant criticism it has received in social media channels. Even Anthony Pompliano, the co-founder of Morgan Creek Digital Assets, has recommended the model.
Stock to flow model is deadly accurate so far.
— Pomp (@APompliano) January 21, 2021
This is what a programmatic monetary policy looks like.
Predictable and transparent.
No one can change the rules unilaterally because they think they're smarter than the free market. pic.twitter.com/Kps1AZ7lpD
The S2F model suggests that Bitcoin price could reach $100,000 before the end of 2021. Additionally, the colors used in the chart indicate how far away Bitcoin is from the next halving. After the red dots, BTC price has historically risen even higher which suggests the same could happen now, pushing Bitcoin towards $100,000.
Bitcoin price aims for a short-term rebound
One of the most significant developments on the daily chart has been the loss of the 26-EMA which has been a robust support level since October 2020. It shows a notable shift in momentum and confirms a daily downtrend.
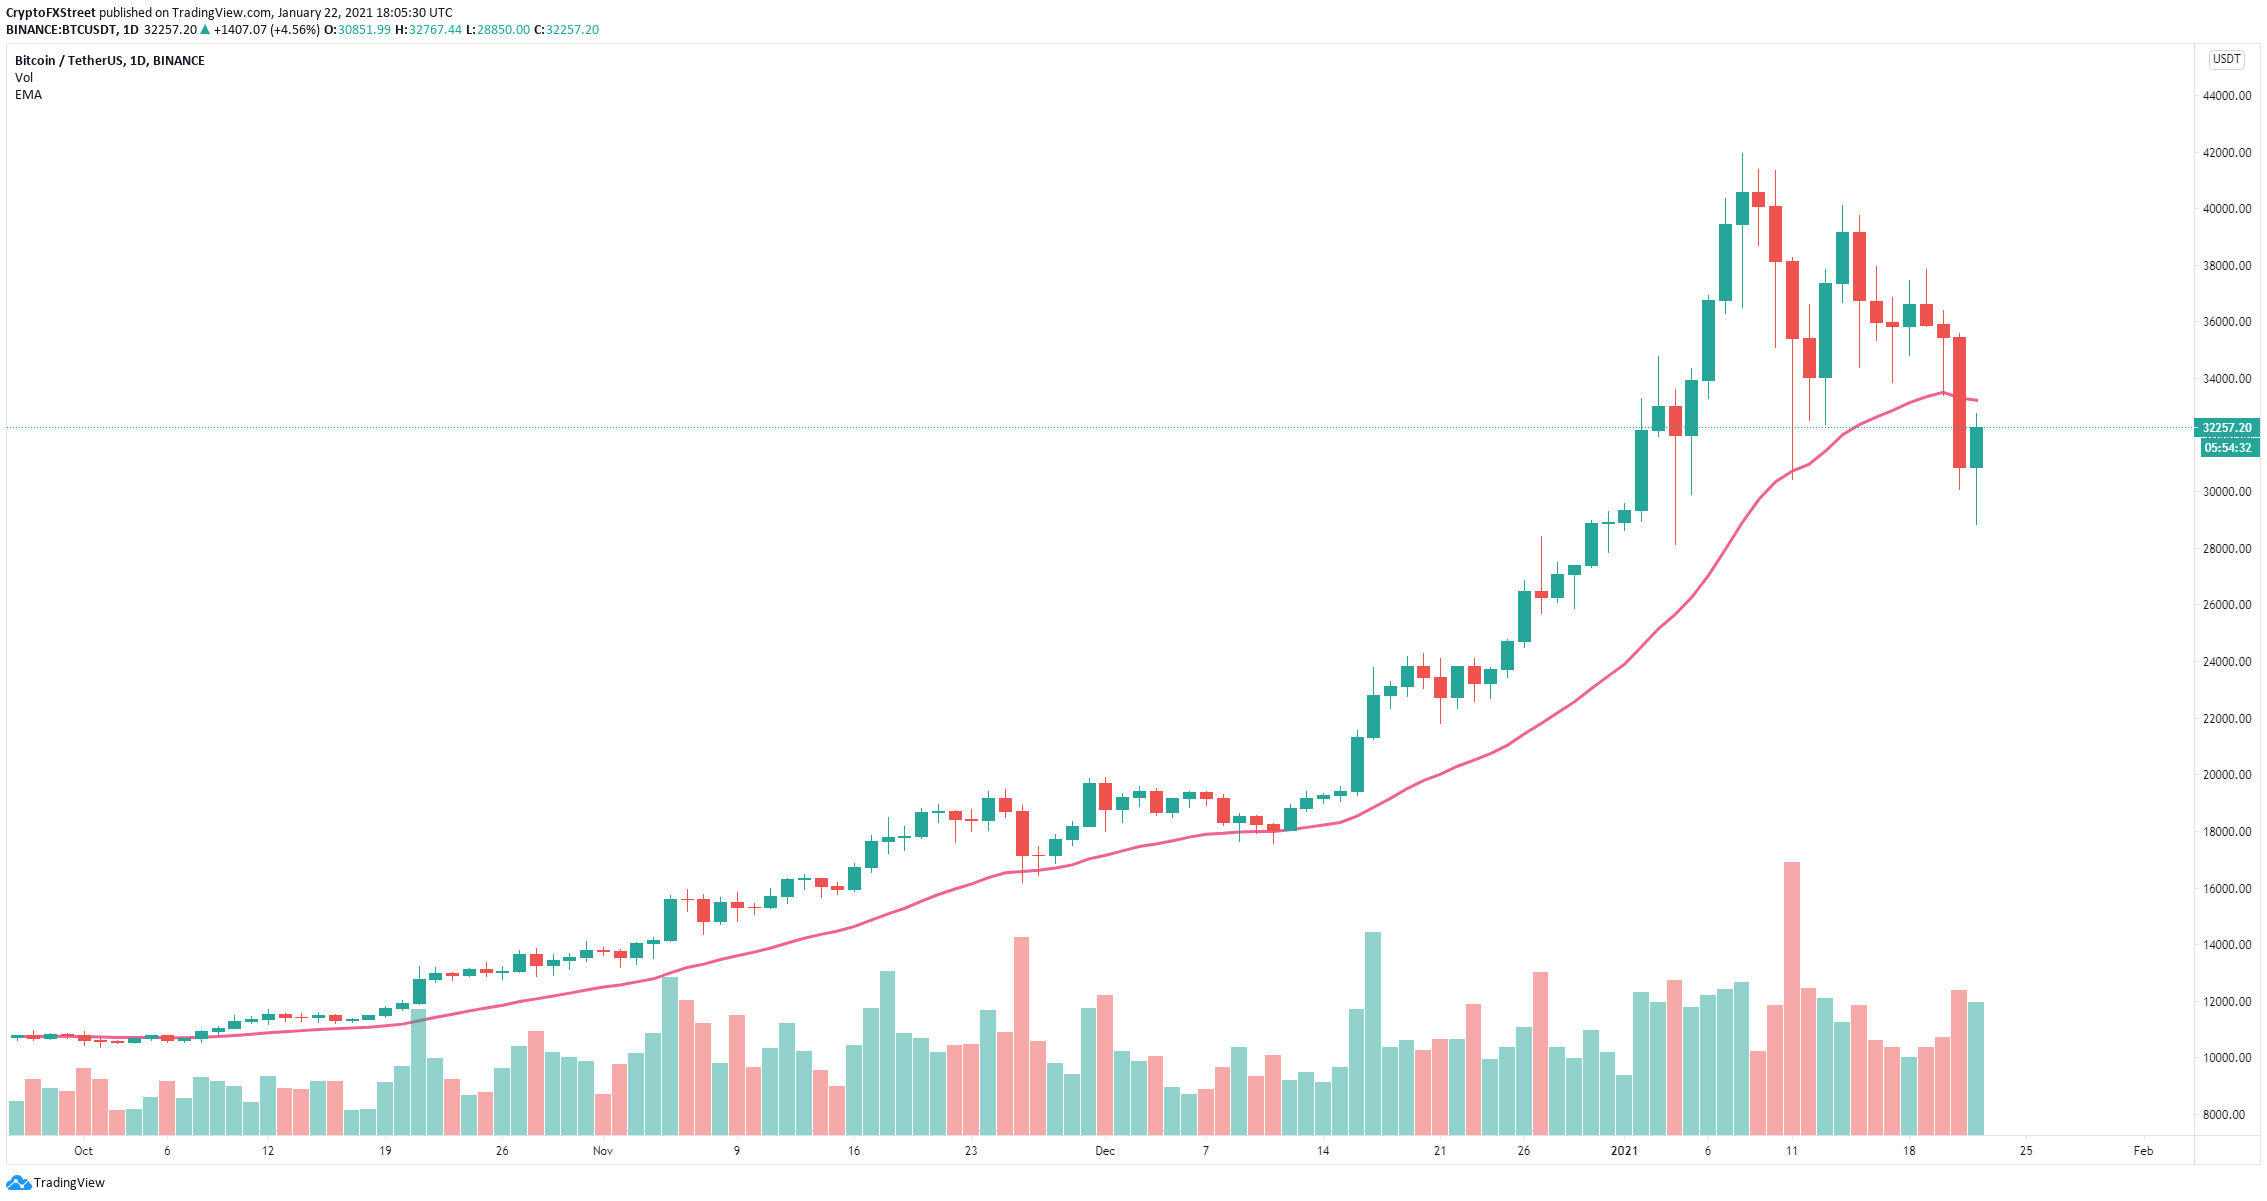
BTC/USD daily chart
However, despite the recent sell-off, BTC bulls have pushed the digital asset up by 13% in the past 24 hours forming a bullish candlestick on the daily chart. If Bitcoin price can regain the 26-EMA, there is a strong chance to see a breakout towards $38,000 as there is very little resistance on the way up.
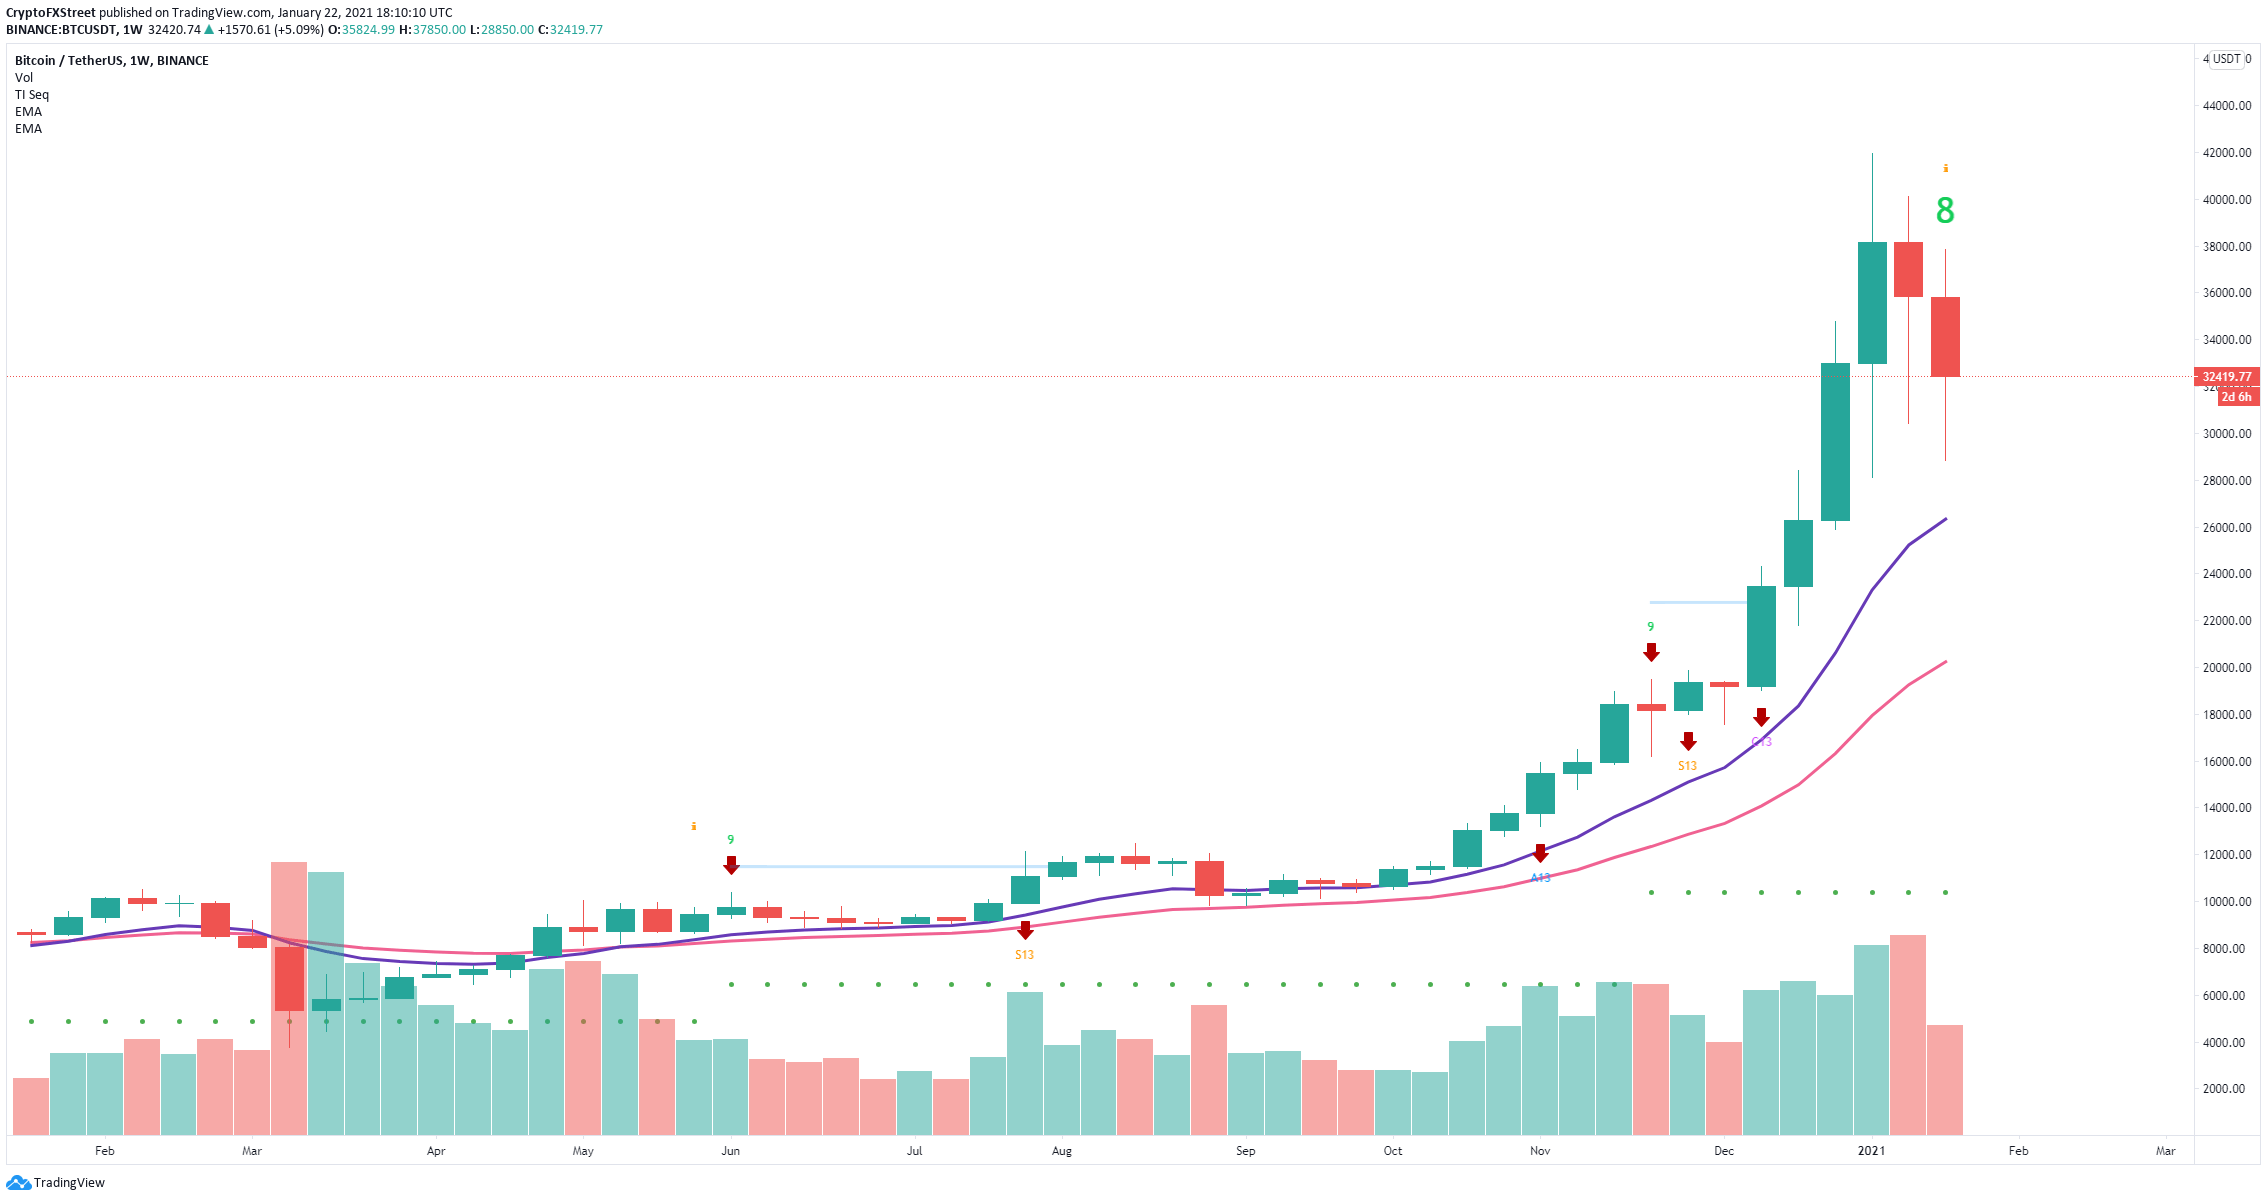
BTC/USD weekly chart
It’s also important to note that zooming out to the weekly chart, this pullback doesn’t seem as bad. The uptrend here isn’t even close to being lost and the 12-EMA is all the way down at $26,330.
The only concerning sign for the bulls is the TD Sequential indicator which seems to be on the verge of presenting a sell signal for the first time since November 23.
Author

Lorenzo Stroe
Independent Analyst
Lorenzo is an experienced Technical Analyst and Content Writer who has been working in the cryptocurrency industry since 2012. He also has a passion for trading.


