Bitcoin Weekly Forecast: BTC eyes retest of $50,000
- Bitcoin price is turning over a new leaf after bouncing off the $41,000 support level.
- A retest of the $49,000 or the $50,000 psychological level seems likely for BTC in the coming days.
- On-chain metrics support the bullish outlook scenario, adding weight to the technical perspective.

Bitcoin price shows a resurgence of retail interest as it bounced off a crucial psychological level. The recent uptrend is preparing a base on a short-term time frame so BTC can kick-start a larger leg-up. Interestingly, on-chain metrics are lining up with the bullish outlook portrayed from a technical perspective. An uptrend now seems inevitable for BTC and, therefore, the larger ecosystem.
Bitcoin price prepares for a new local top
Bitcoin price set up a triple bottom around the $41,000 support level. The third tap at the said barrier collected the sell-side liquidity resting from $40,747 to $39,629. This sudden downswing was the key that kick-started a 12% ascent.
Since this minor uptrend, BTC has retraced and is preparing a foothold that will serve as a base for the next leg-up. As the big crypto trades around $42,780, investors can expect Bitcoin to revisit the previous Monday’s low and high at $45,874 and $47,609, respectively.
These barriers are the midway point for BTC and the final target is perhaps at $52,150, where the pioneer crypto set up a double top on December 7, 2021, and December 27, 2021. Due to this reversal top setup, there is a considerable amount of buy-stop liquidity resting above it.
Market participants can expect Bitcoin price to sweep above $52,150. The swing high formed around this level could be a local top where buying pressure will likely exhaust.
Investors need to exercise caution above $52,150 as any move beyond this point could be ephemeral.
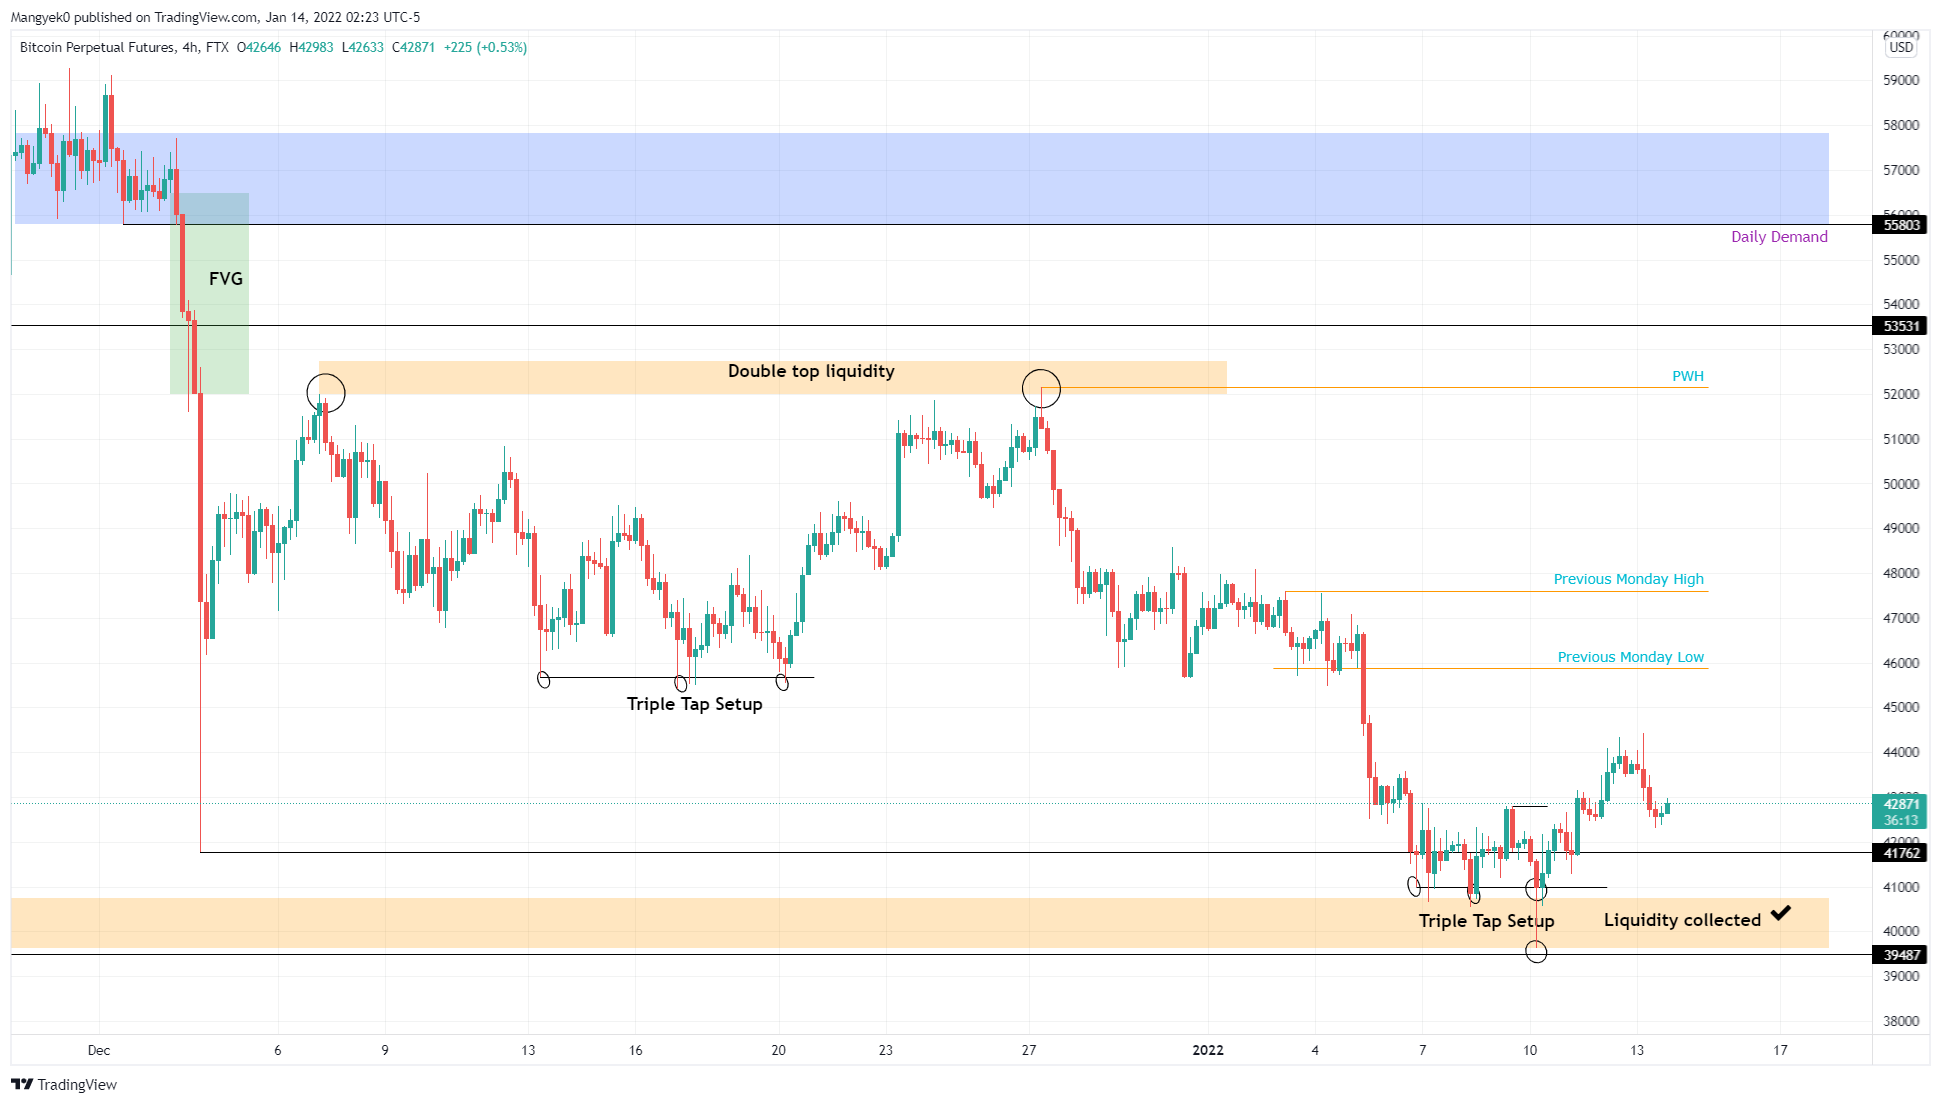
BTC/USDT 1-day chart
Supporting this bullish thrust in Bitcoin price is IntoTheBlock’s Global In/Out of the Money (GIOM) model, which shows that the significant level of resistance for BTC extends from $46,824 to $53,228.
Roughly 5.66 million addresses that purchased nearly 3 million BTC are “Out of the Money.” These holders are likely to offload their tokens if the price reaches their buy-in point, leading to an increase in selling pressure.
Any move up to $53,228 seems reasonable and interestingly enough, coincides accurately with the one predicted from a technical perspective
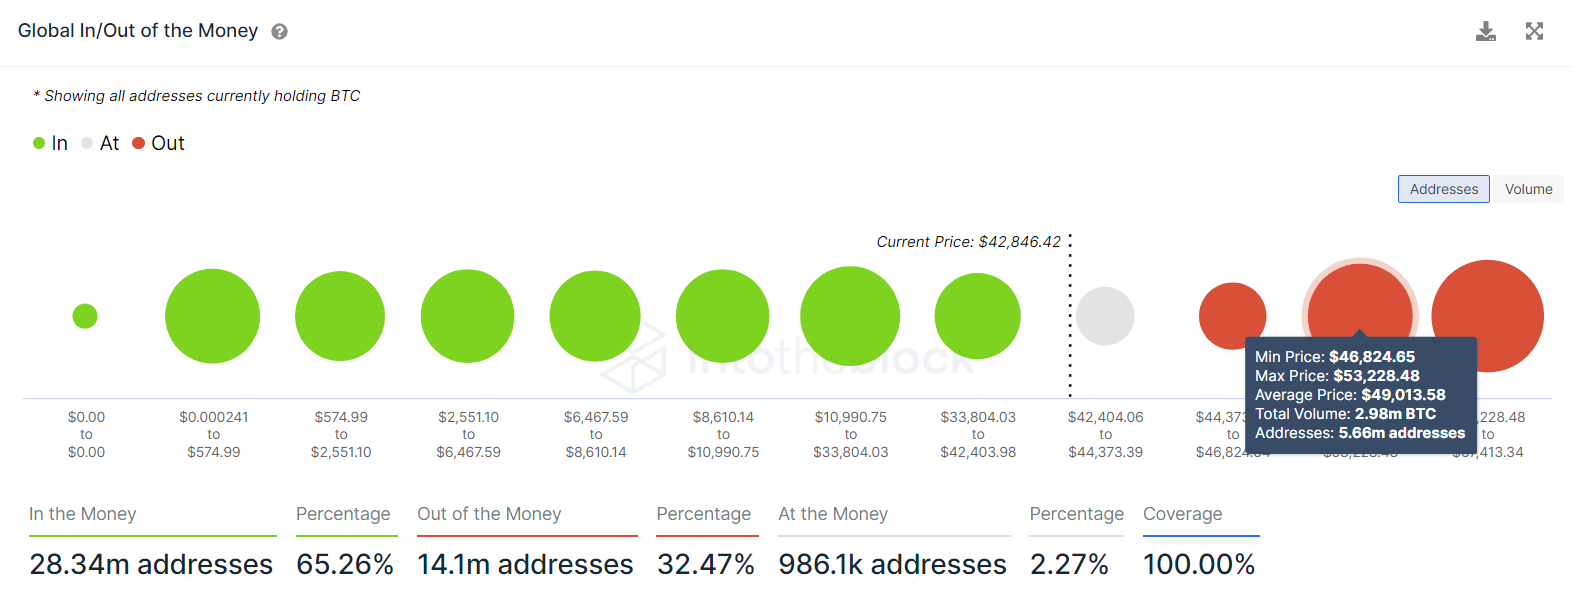
BTC GIOM
The 30-day Bitcoin price Market Value to Realized Value (MVRV) model adds a tailwind to the optimistic narrative as it bounces back to -6% from -10%.
This on-chain metric is used to determine the average profit/loss of investors that purchased BTC over the past month.
A negative value indicates that short-term holders are at loss and are less incentivized to sell. Long-term investors tend to accumulate their holdings in these levels, suggesting a bullish outlook.
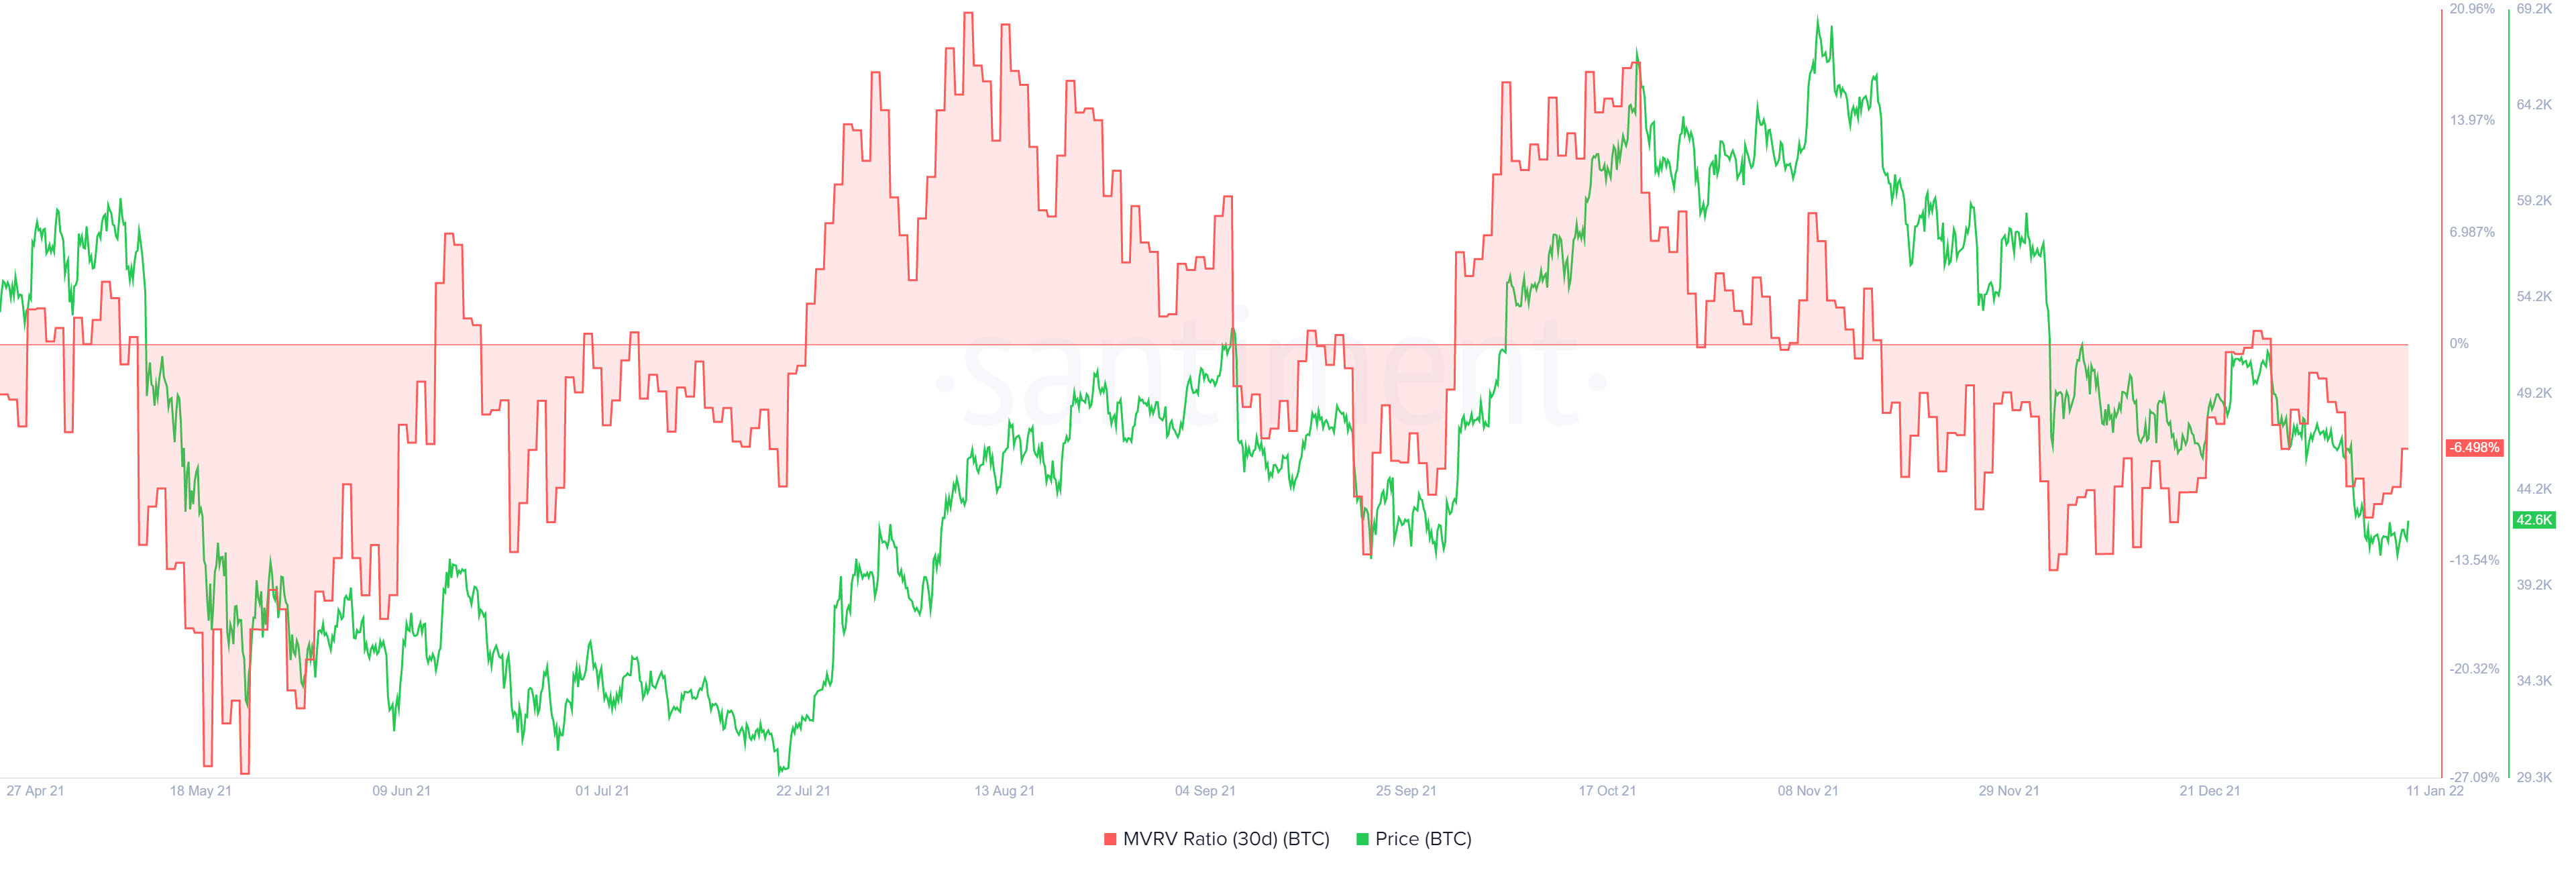
BTC 30-day MVRV
Perhaps, the most significant on-chain metric that spells out the bullish outlook for Bitcoin price from a mid-to-high time frame is the entity-adjusted dormancy flow. This fundamental index is obtained by dividing the current market capitalization and the annualized USD-denominated dormancy value. Dormancy refers to the average number of days each coin transacted remained dormant or unmoved, a gauge of the market's spending pattern.
A dip into the green band, seen in the image below, often marks macro bottoms for BTC. The same was observed in December 2018, March 2020. Over the last six months, the entity-adjusted dormancy flow has retested the green band twice, indicating that a bottom for BTC is in.
This outlook lines up perfectly with the technical perspective forecasting a $50,000 BTC.
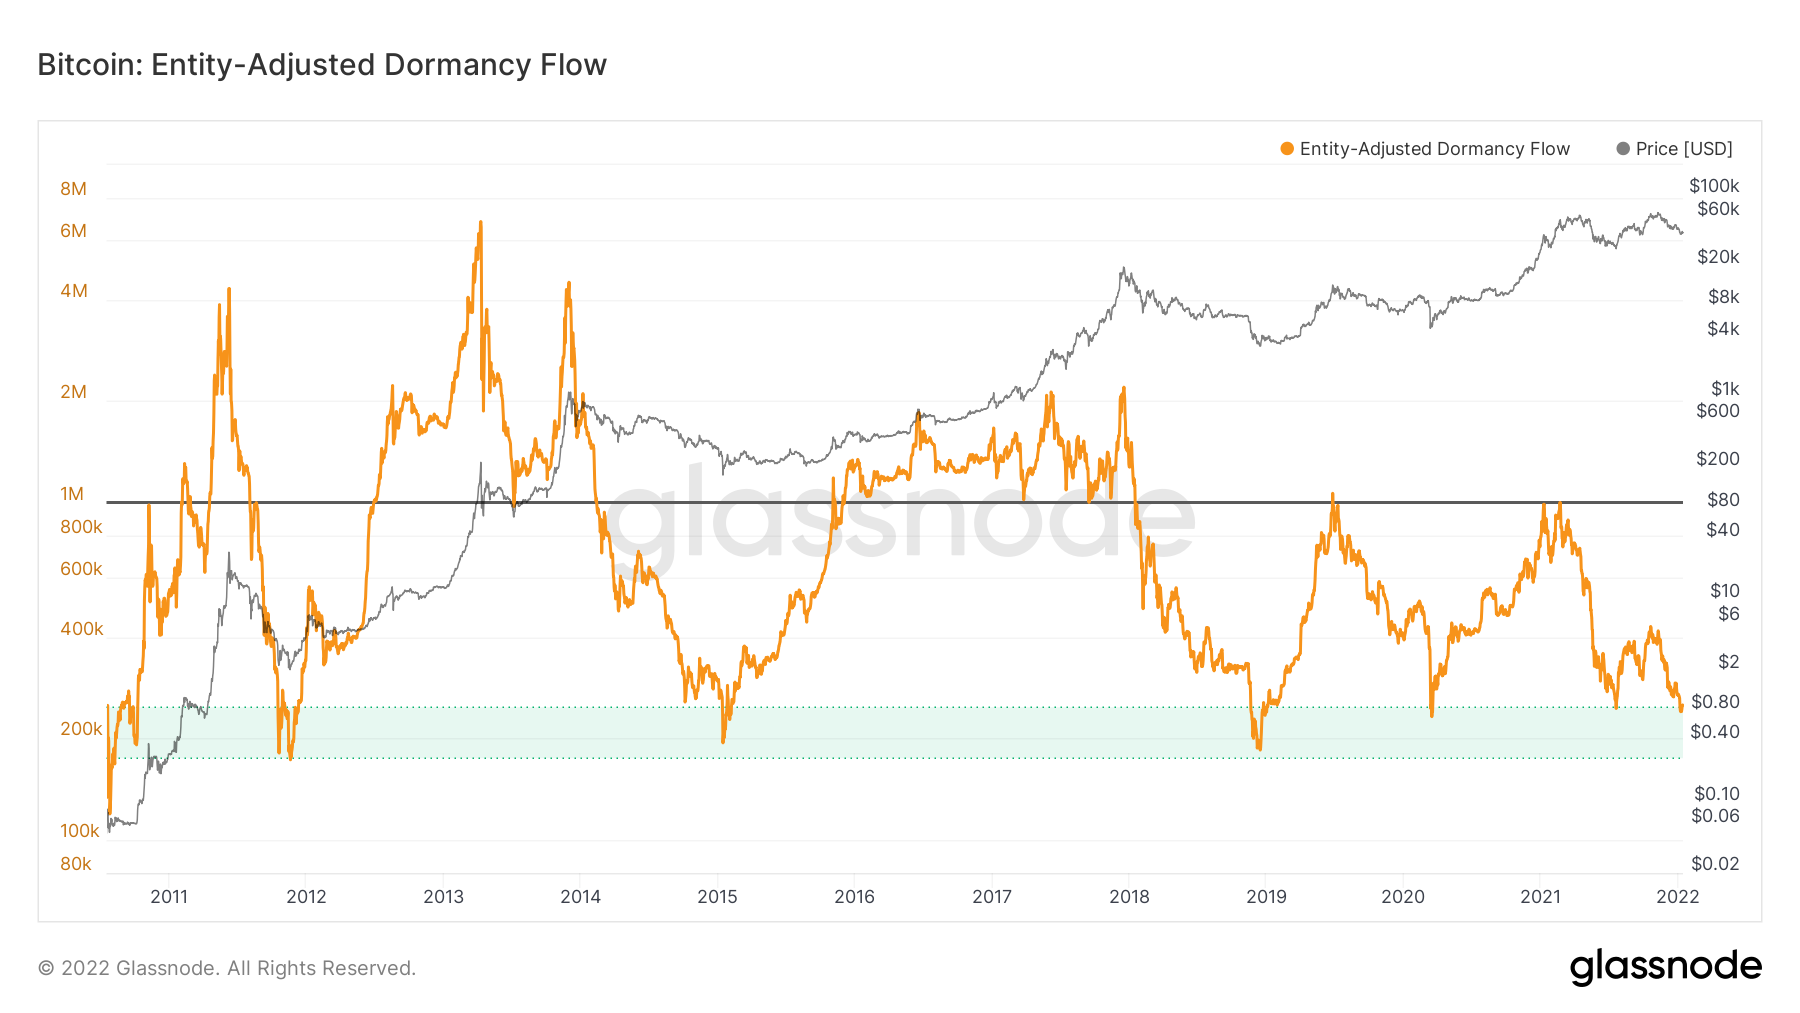
BTC entity-adjusted dormancy flow
While things are looking up for Bitcoin price, a sudden spike in selling pressure that pushes BTC to revisit the $40,000 psychological level could indicate a weak buyer camp. A daily candlestick close below $39,057 will produce a lower low, invalidating the bullish thesis and shifting the narrative toward the bears.
This flash crash could induce FUD among retail, triggering a crash to $33,804, where the buyers can band together and make a comeback.
Author

Akash Girimath
FXStreet
Akash Girimath is a Mechanical Engineer interested in the chaos of the financial markets. Trying to make sense of this convoluted yet fascinating space, he switched his engineering job to become a crypto reporter and analyst.


