Bitcoin Weekly Forecast: BTC eyes $60,000 but correction looms
- Bitcoin price retests a tough resistance level at $52,062.
- A lack of momentum is likely to trigger a correction and consolidation for the next few weeks.
- Investors can expect BTC to remain between the $52,062 to $45,156 levels.
- Bounce at the lower end of the potential range could see a revisit of the $58,399 weekly resistance level.

Bitcoin (BTC) price has been moving up only since January 22 but could slip into a consolidation before the next leg up. With the rate at which BTC is climbing after the ETF approval, coupled with strong fundamentals, investors should consider buying the dips before BTC hits $60,000.
Also read: Bitcoin Weekly Forecast: BTC targets $52,000, will New Moon trigger a pullback first?
Bitcoin price likely to slow down
Bitcoin price rallied 68% between October 9, 2023, and December 4, 2023, following which it consolidated for seven weeks. In the eighth week, it triggered a breakout, rallying 25% and setting up a local top at $52,879.
The second leg has pushed BTC to sweep the weekly resistance level at $52,065, collecting the buy-stop liquidity there. If this weekly candlestick closes below the said resistance level, the chances of consolidation will increase heavily.
Assuming Bitcoin price slips below $52,065, it is likely to slide lower and tag the $45,156, a weekly support level. This development is supported by the potential bearish divergence discussed in the previous publication. Once the lower and upper limits are set, BTC will likely trade within the range, looking for a sweep of the range low before triggering an upswing.
The upside target for Bitcoin price includes the next weekly resistance level at $58,399. However, it is unlikely BTC will stop at this level, a quick extension higher could see the pioneer crypto revisit the $60,000 psychological level after more than two years.
The euphoria, coupled with the retail FOMO for hitting $60,000 could be enough to propel Bitcoin price to retest and overcome the all-time high of $69,138.
Read more: Week Ahead: Bitcoin inches closer to $50,000, altcoins likely to explode
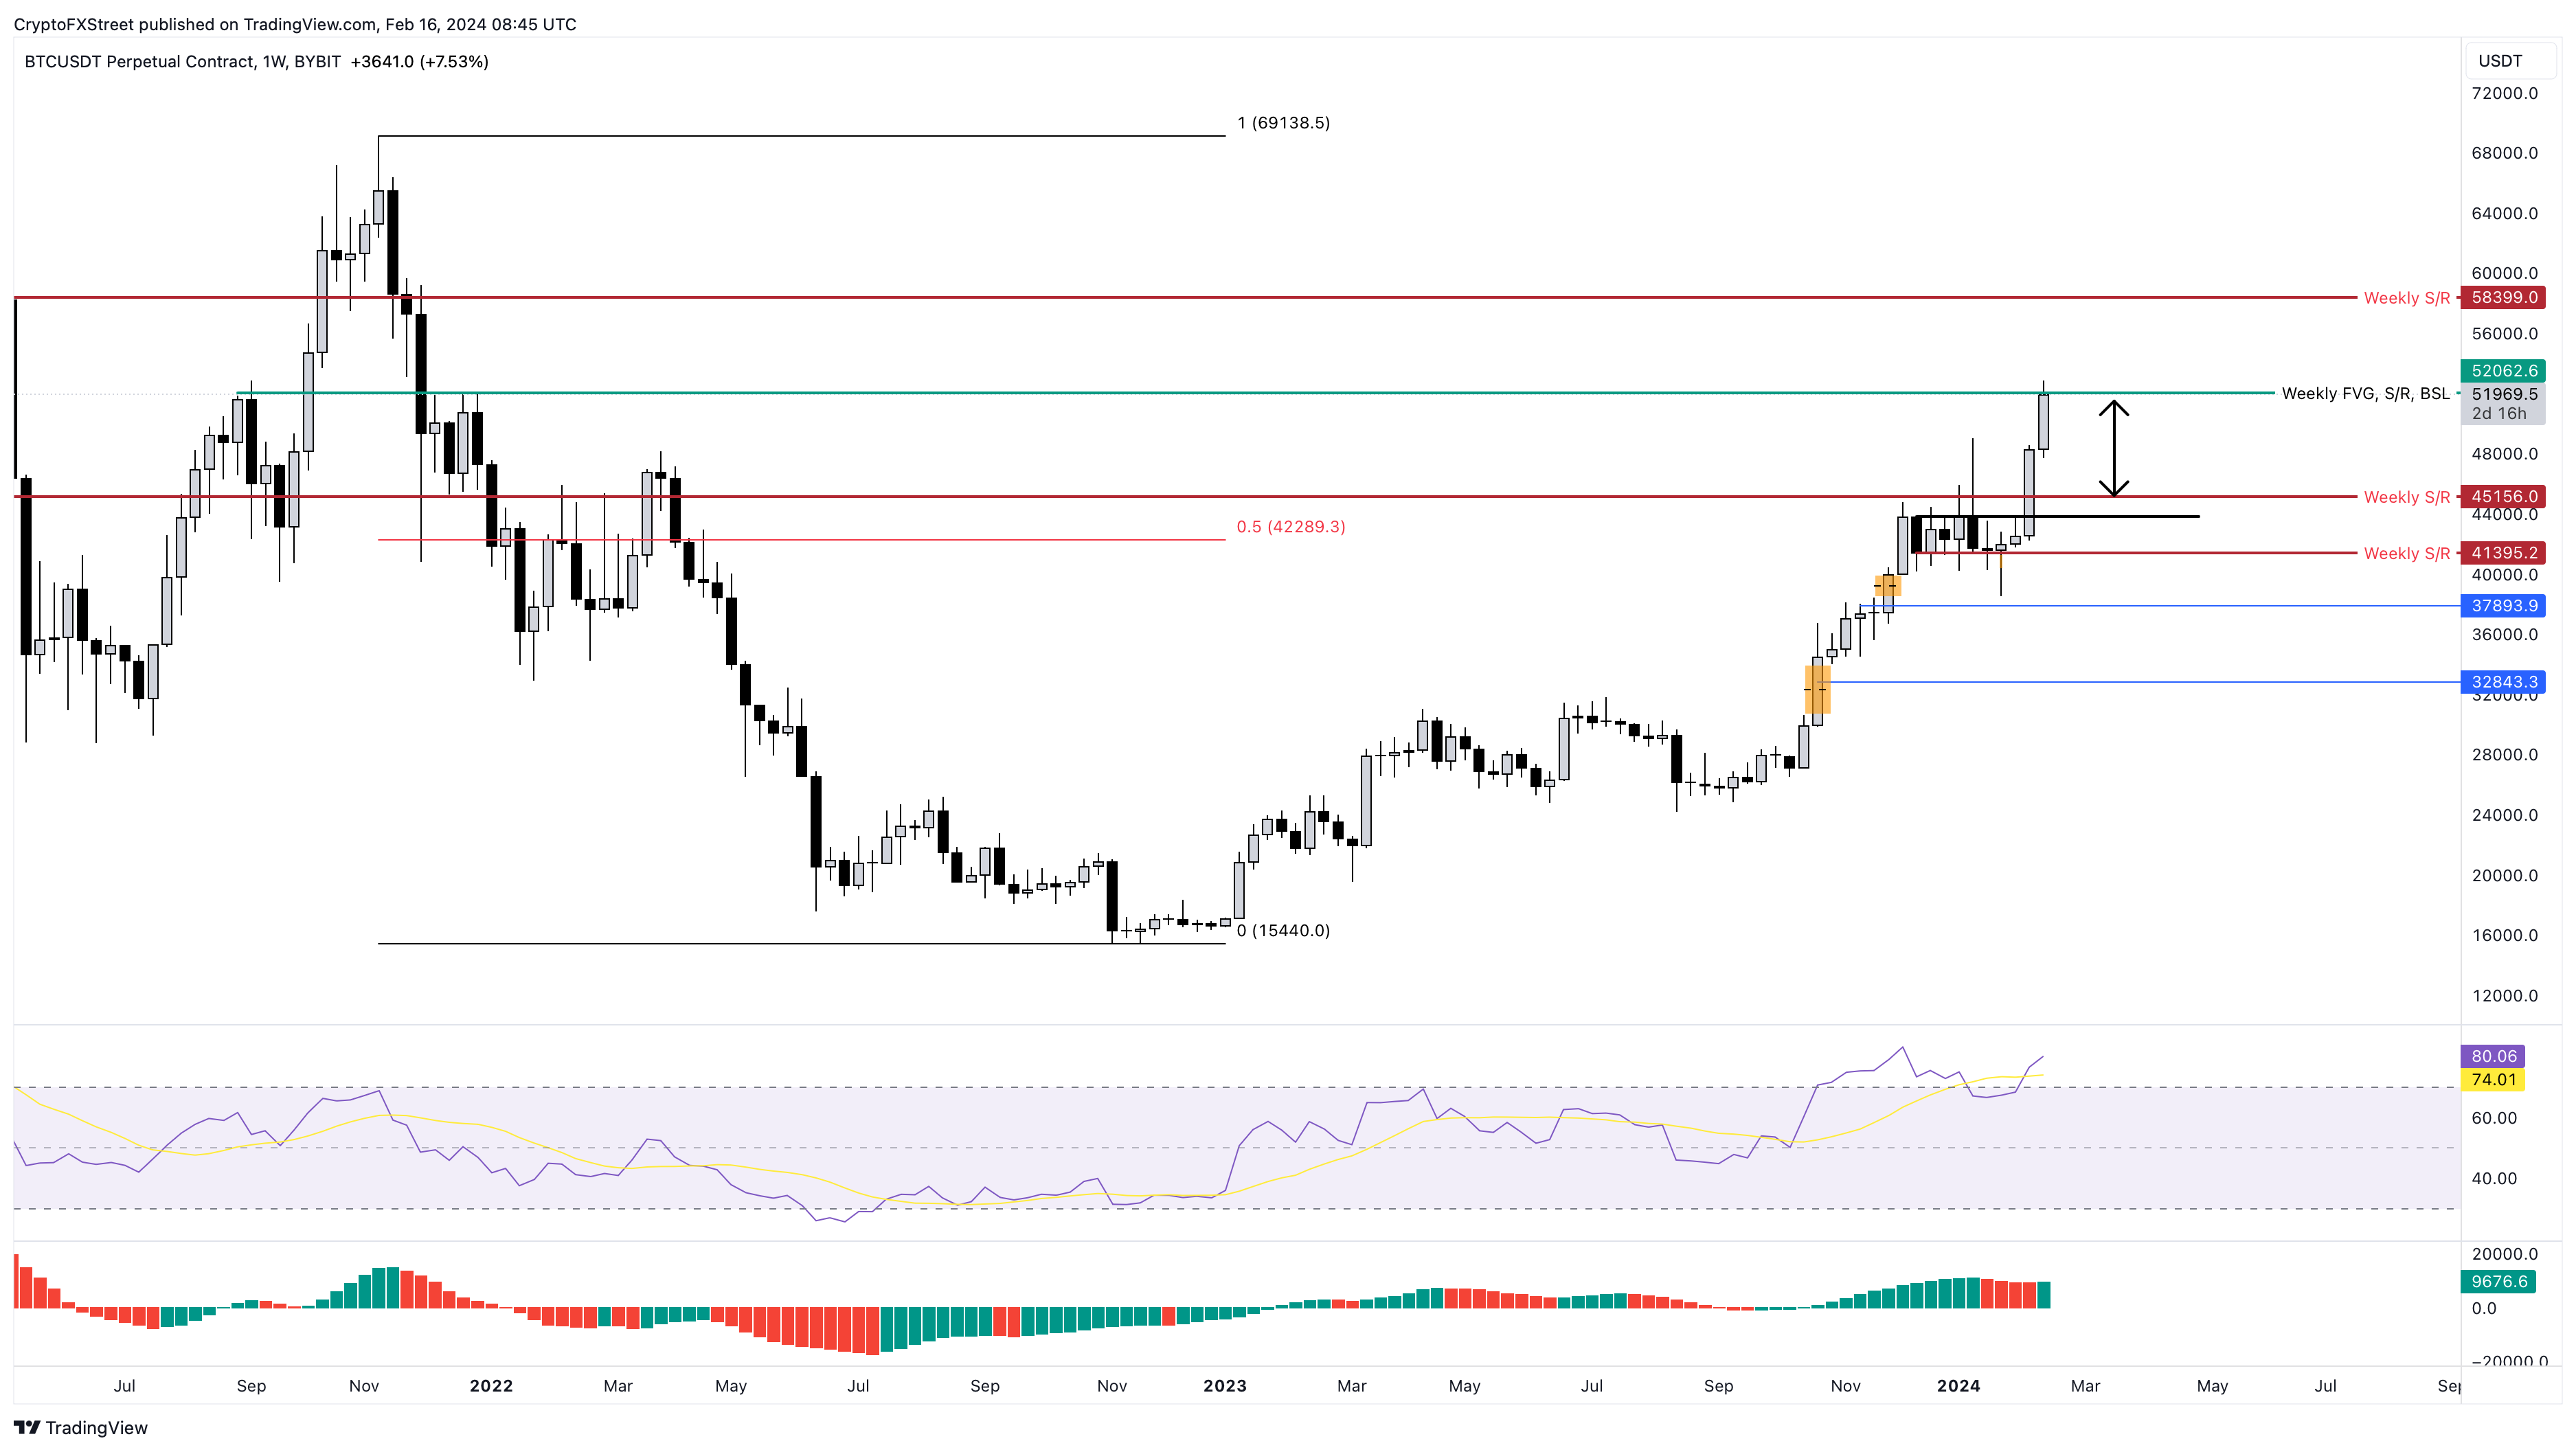
BTC/USDT 1-week chart
BTC sell signals and fractals
Supporting a short-term correction in Bitcoin price is the daily chart, which displays a red “one” sell signal from the Momentum Reversal Indicator (MRI). This technical formation forecasts a one-to-four candlestick correction.
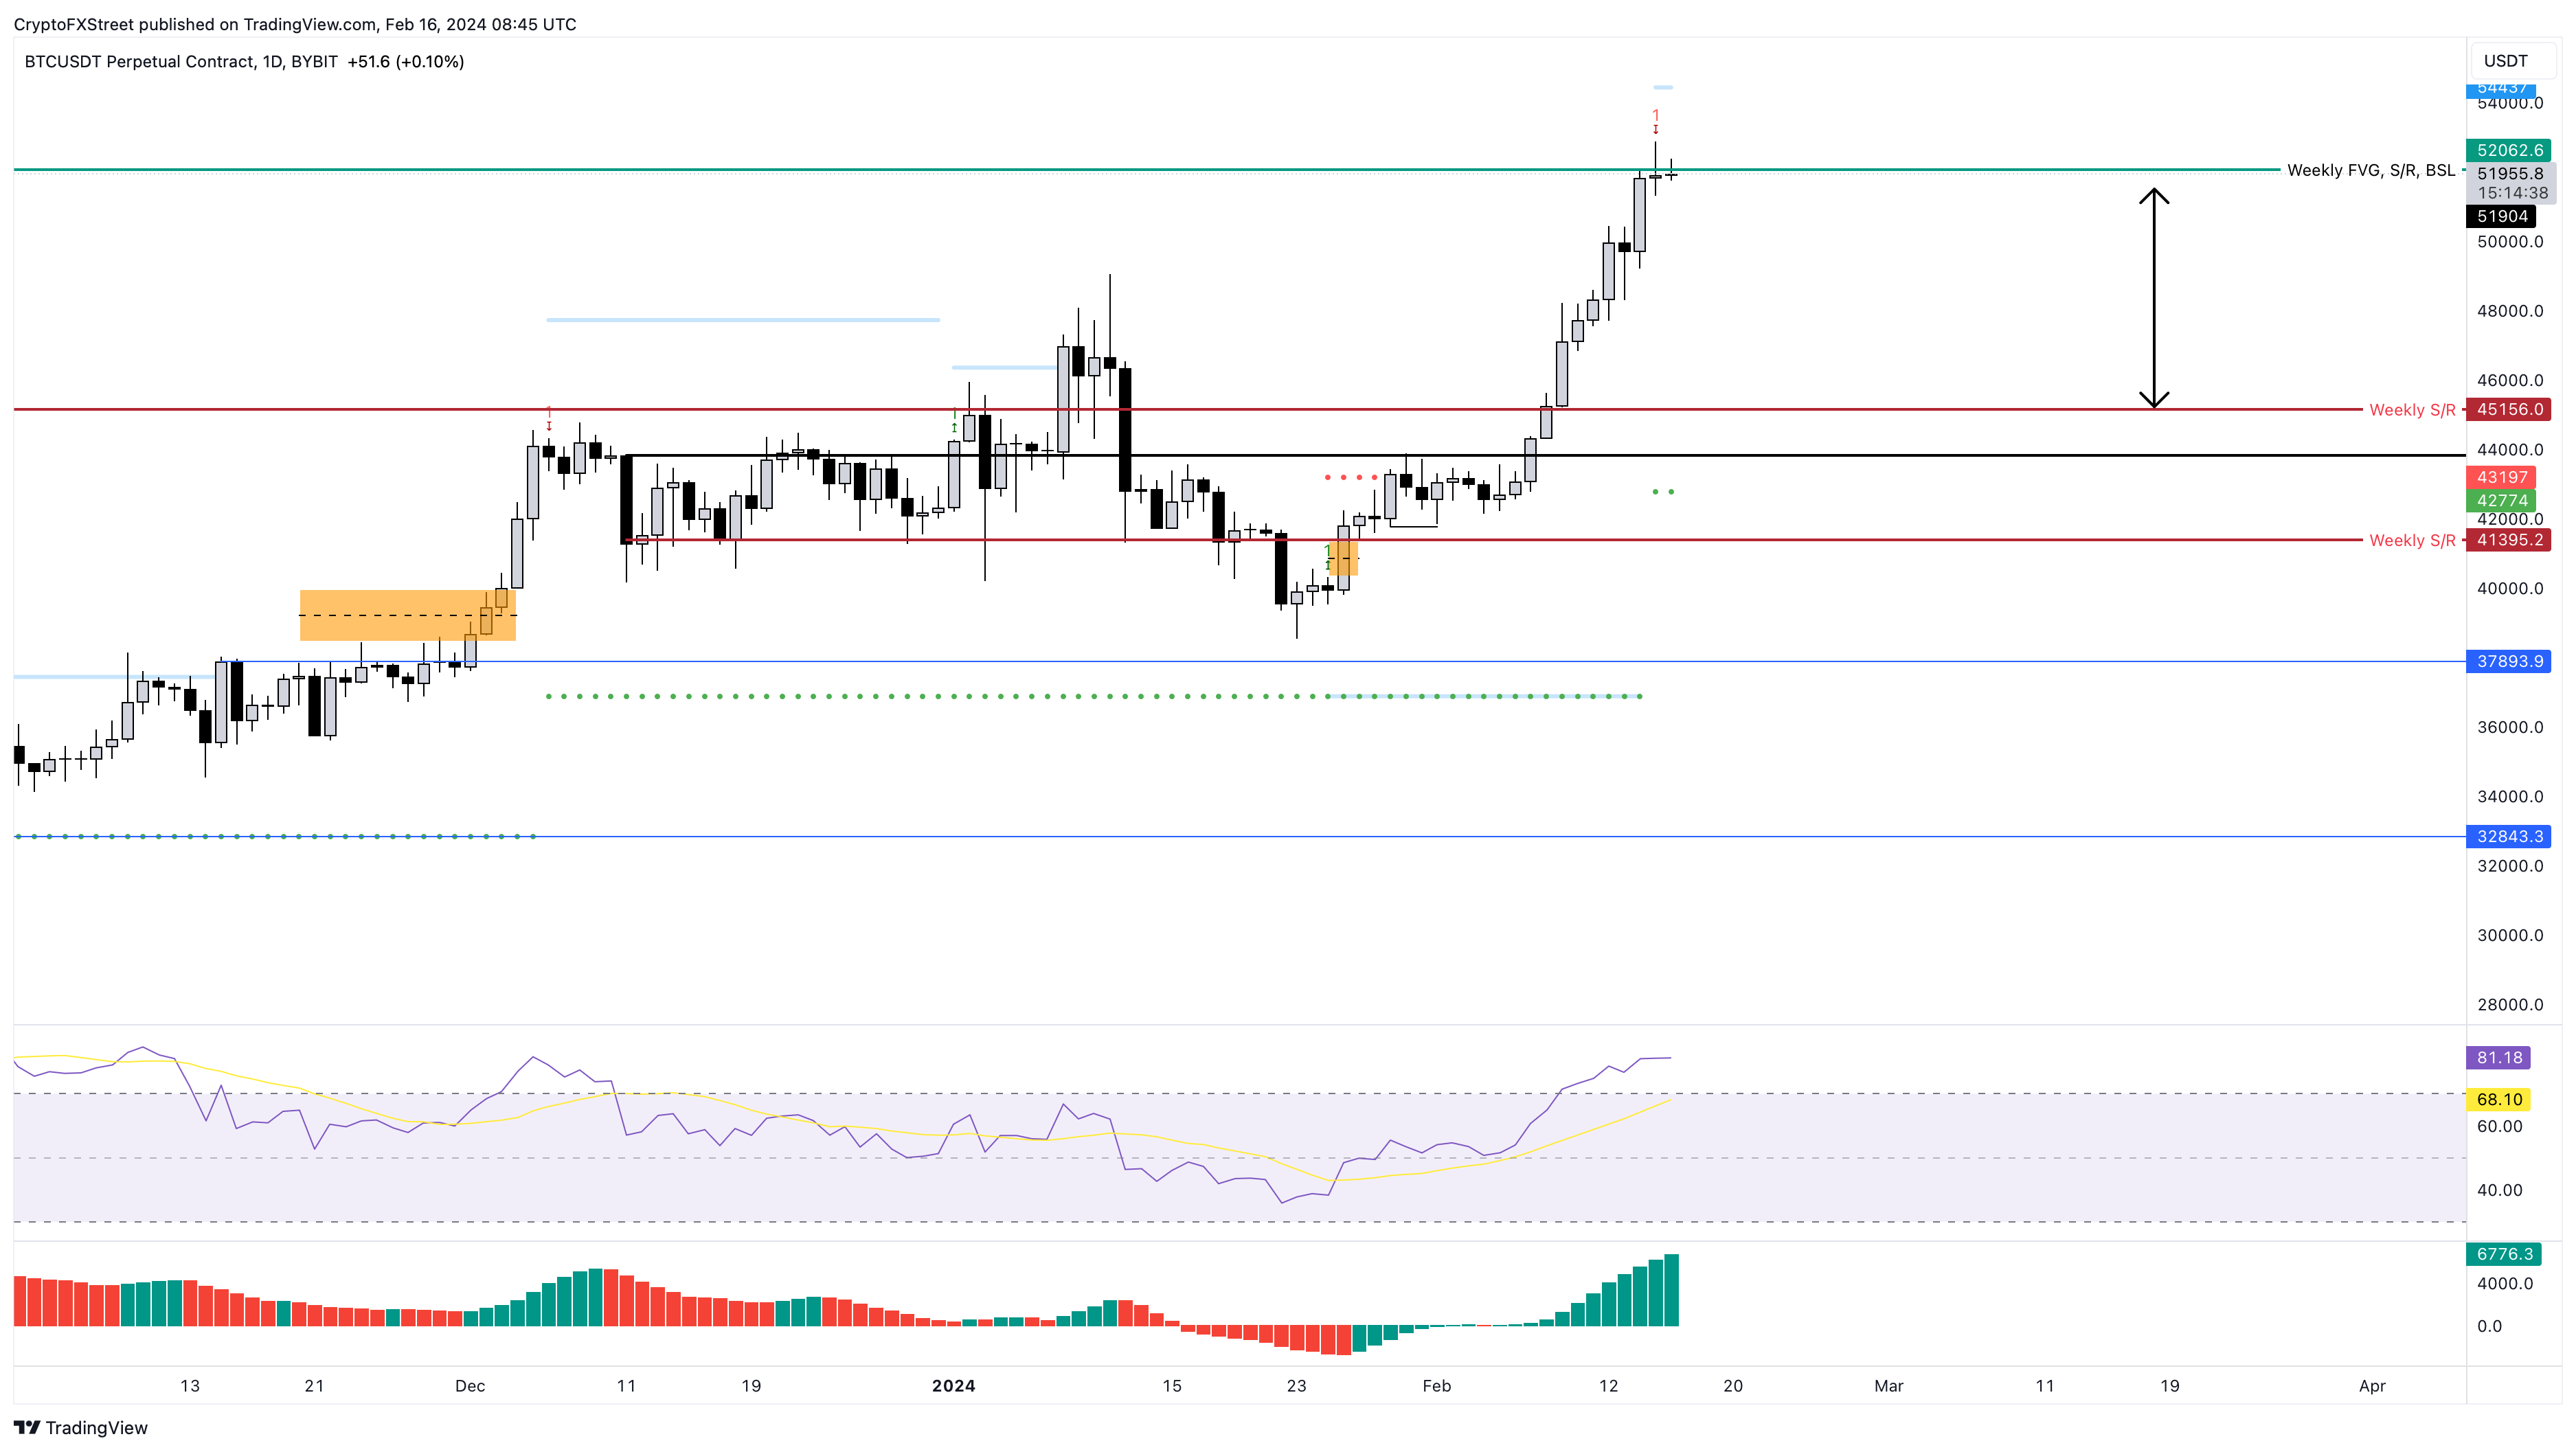
BTC/USDT 1-day chart
Lastly, as pointed out in the tweet attached below, Bitcoin price action from January 29, 2024, is eerily similar to what is playing out at the time of writing. Although fractals like these have a low probability of working out, it is interesting to note that different outlooks converge toward a potential crypto market correction.
Keeping it simple with #Bitcoin: Back with another $BTC fractal. @learn_charles https://t.co/tK3votoWXH pic.twitter.com/vIEZi6Vvlu
— MAXPAIN (@Mangyek0) February 15, 2024
The outlook for Bitcoin price remains bullish on the higher time frame and investors should not confuse a potential pullback to a market-spoiling correction. One risky development would be if BTC flips the $41,392 support level. This move would create a lower low for the weekly market structure, invalidating the bullish thesis. Such a move from BTC would suggest a potential correction to $37,893.
Author

Akash Girimath
FXStreet
Akash Girimath is a Mechanical Engineer interested in the chaos of the financial markets. Trying to make sense of this convoluted yet fascinating space, he switched his engineering job to become a crypto reporter and analyst.


