Bitcoin Weekly Forecast: BTC bulls plot the revenge
- Bitcoin ends the volatile week in a red zone, but the recovery in on the way.
- Correction, manipulations or technical issues - three usual suspects of price movements.
- Golden gross on a daily chart implies that bulls might have an upper hand during the next week.

This week Bitcoin (BTC) reminded about is volatile nature. The first digital coin moved from $10,300 to $9,300 and recovered to $9,800 by the time of writing. The 30-day volatility surpassed 36% mark and hit the highest level since the beginning of February, while 10-days volatility jumped as high as 65% when Bitcoin lost Nearly 10% of its value in a matter of hours.
Bitcoin's market capitalization settled at $176 billion, which is 62.8% of the total digital assets market. Bitcoin worth of $42 billion changes hands daily on average. Also, the number of large transactions stayed elevated even though the price decreased. Notably, large bears dominated the market in recent week. According to the Intotheblock data, 56 addresses sold more than 1% of the daily trading volume and only 53 qualified as bulls.
Three theories behind the price movements
While the true fundamental reasons for the market gyrations remain unknown, there are some factors that may be helpful in understanding what's going on on the market.
Technical factors: Bitcoin failed to clear a large number of sell-orders clustered around pivotal resistance at $10,500, which led to a technical correction amid a deeply overbought market. As protective orders triggered the downside started snowballing, squeezing weak hands out of the market. Notably, the coin has stayed inside the range, limited by $38.2% and 50% Fibo retracement for the downside move from July 2019 high to December 2019 low. Also, on a daily chart, the price has also been moving within an upside channel with the lower boundary currently at $9,425.
Manipulations: While downside corrections are natural after a strong rally, the sheer speed and the scale of the move raise some red flags and imply that the movement might have been caused by price manipulations. The same is implied by a potential Bart Simpson model on a 1-hour chart. This pattern is characterized by a sudden price increase, some period of sideways trading that is followed by a massive drop. They are fairly rare on other markets but appear regularly on crypto charts.
A large green candle that forms the first side of Bart's head caused massive shorts liquidation Sellers were forced out of their positions, which increased the upside pressure as a result. It is followed by a period of consolidation in a tight channel. Then comes another impressive move that erases all the previous gains and pushes the price back in the range that preceded the growth. This time around retail buy orders are liquidated.
Binance technical issues: The largest cryptocurrency exchange by average daily trading volume experienced several performance issues during the week and even was forced to stop operations of go to unscheduled maintenance. While the head of the exchange maintained healthy communication with the community and assured traders that all funds were safe (funds are #SAFU), the issues prevented traders from entering their accounts and adjusting positions. Many traders reported errors with orders and account balances. Considering that Binance is responsible for a lion's share of the market, these disruptions might have influenced the market movements.
BTC/USD: Looking forward
The further price momentum is heavily dependant on Bitcoin's ability to pass through an important resistance area of $9,800-$10,150. It is backed with strong technical indicators, including 50% Fibo retracement of the above-said move and a combination of SMA50 and SMA100 on 4-hour chart. Apart from that, it contains psychological $10,000 and a sloping trendline from February 13 high that has been limiting the recovery during the previous week.
Moreover, according to Intotheblock data, about 1 million addresses has a break-even point of around $9,800. This positioning turns the barrier into stiff resistance on the way to $10,000, as it means that a large number of traders may seek to break-even and close their positions.
However, once all barriers are out of the way, BTC/USD may head towards $10,500 and, potentially, to $11,000. The golden cross that appeared on a daily chart and an upward-looking RSI also implies that the bullish momentum is building.
On the downside a sell-off below $9,600 wi likely to slow down on approach to $9,400-$9,300 support area that is also packed with protective orders. Another 1 million of addresses are not interested in the price moving below this area as they bought around these levels.
BTC/USD daily chart
-637178920587359746.png)
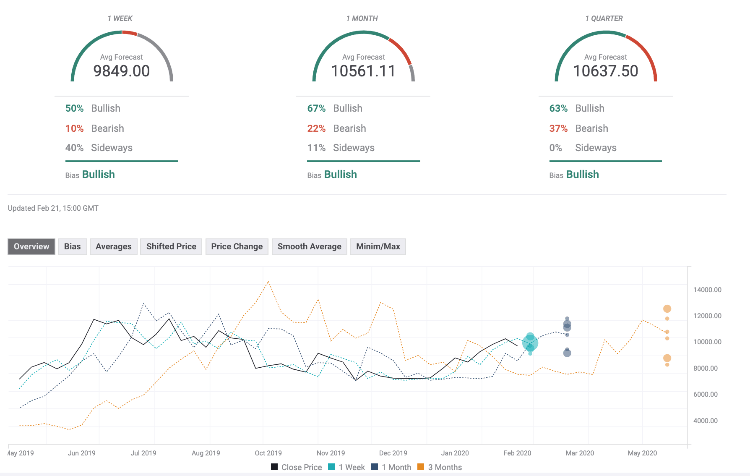
The Forecast Poll of experts has worsened slightly since the previous week. However, weekly expectations turned bullish, which may signal that the short-term sentiments have improved. Though the percentage of investors with positive long-term sentiments decreased below 70%. The average price forecast on all timeframes except weekly stayed above 10,000. Notably, the quarterly price forecast dropped below $11,000.
Author

Tanya Abrosimova
Independent Analyst


