Bitcoin Weekly Forecast: Assessing chances of one last bear market rally for 2022
- Bitcoin price continues to consolidate around $16,500, supported by a trend line.
- Investors can expect bullish convergence to play out when combined with optimistic on-chain metrics.
- Invalidation of the bullish thesis will occur on the flip of the $15,550 support level.

Bitcoin price is in a good place to trigger another bear market rally from a high-time frame perspective. This development, combined with the optimistic outlook seen in on-chain metrics, further strengthens the possibility of a happy ending to 2022.
Bitcoin price and potential plays
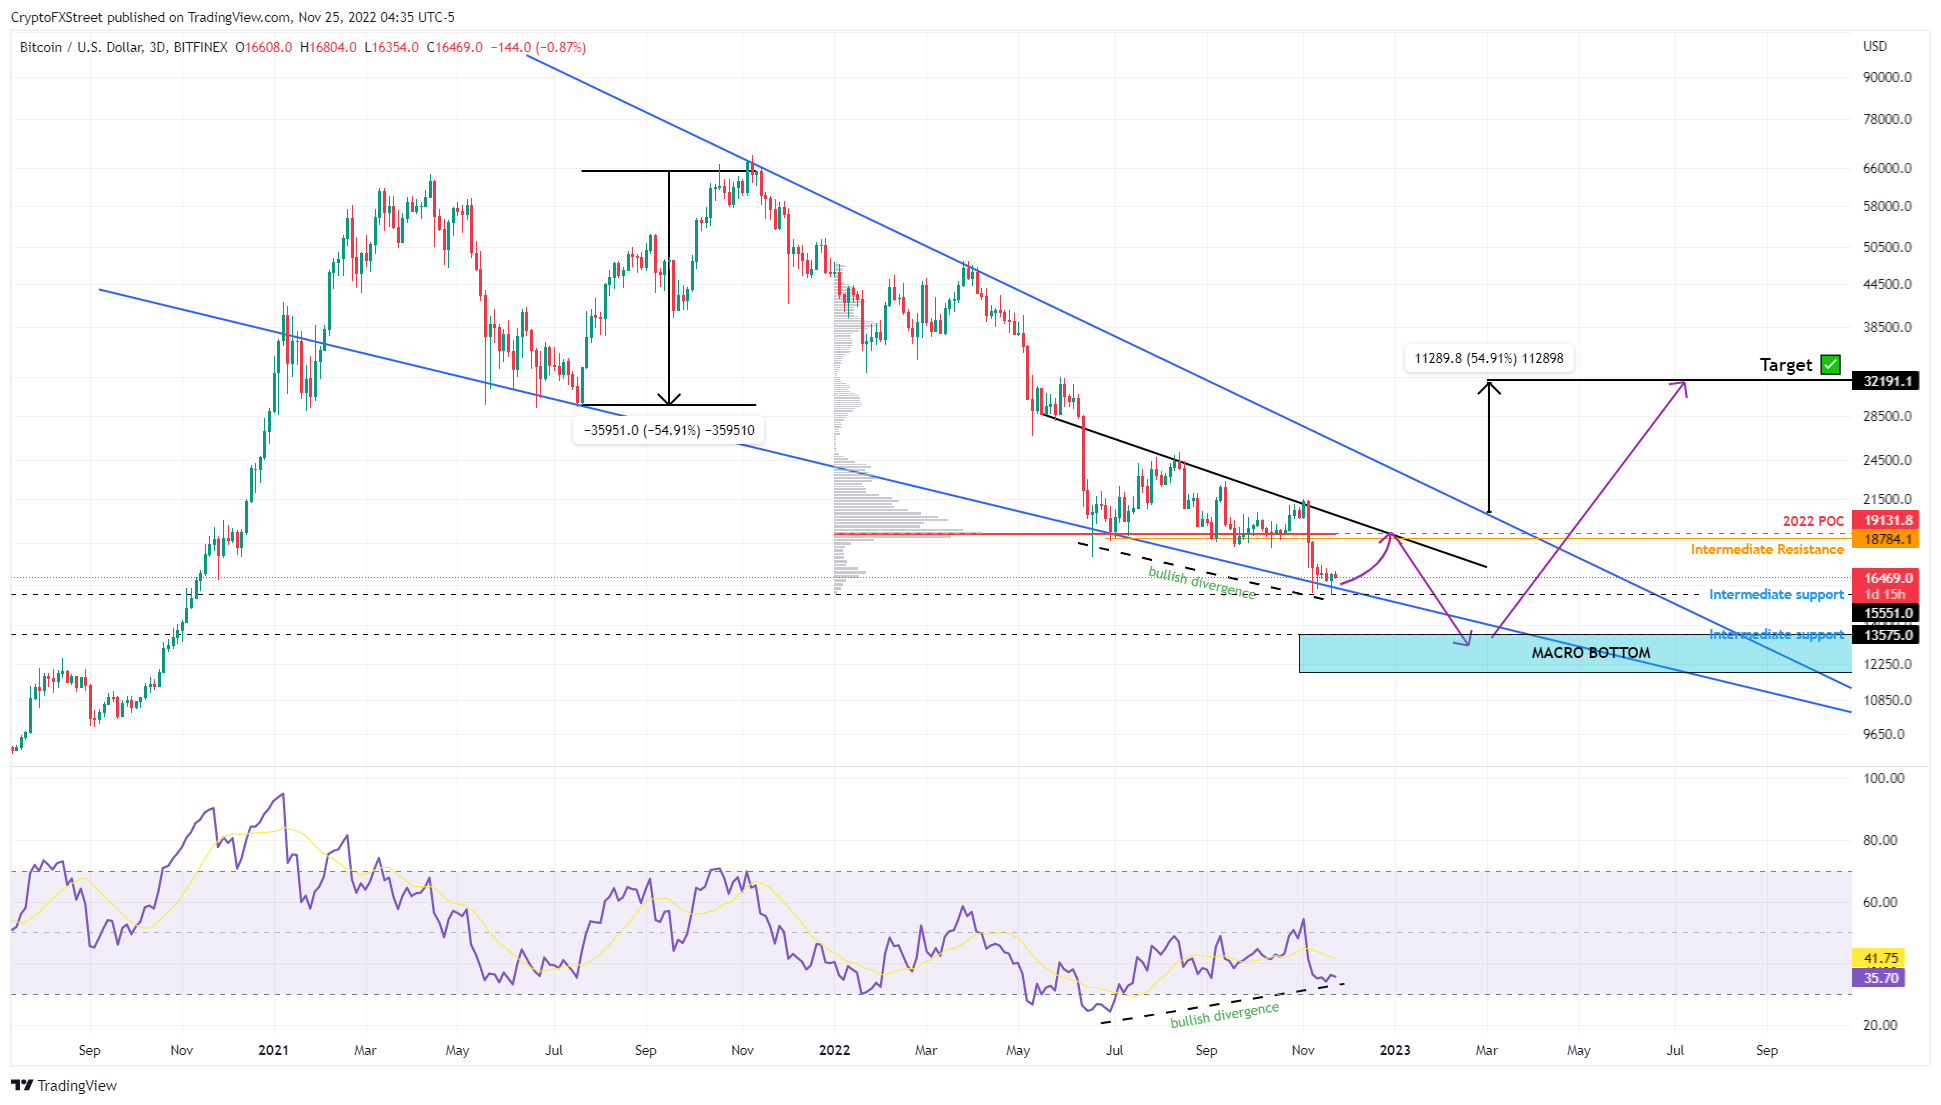
Bitcoin price shows a falling wedge formation on the three-day chart described by using trend lines to connect with two lower highs and three lower lows. The third retest of the lower trend line is still in play as BTC hovers around $16,500.
As mentioned in a previous article, Bitcoin price has produced lower lows for the last five months while the popular momentum indicator Relative Strength Index (RSI) has set up higher lows. This nonconformity or ‘convergence’ is a sign of budding bullish momentum and is indicative of a market reversal.
Therefore, investors can expect Bitcoin price to climb 17% and tag 2022’s highest traded volume level at $19,011, aka Point of Control (POC).
Since investors are still reeling from the Luna, Three Arrows Capital and FTX collapses, this outlook might seem hard to come to terms with. But an even more bullish outlook could unfold should Bitcoin price flip the POC into a support level.
This development could attract sidelined investors, causing a spike in buying pressure. Such a scenario could propel BTC to tackle and overcome the declining trend line of the falling wedge. This trend line connects the November 2021 and March 2022 levels.
Hence, a decisive three-day candlestick close above this blockade will signal a shift in the narrative and kick-start a 54% upswing to $32,191. The target for this breakout is obtained by measuring the distance between the first swing high and swing low of the falling wedge and adding it to the breakout point at $20,560.
BTC/USDT 1-day chart
Post-Thanksgiving on-chain landscape for BTC
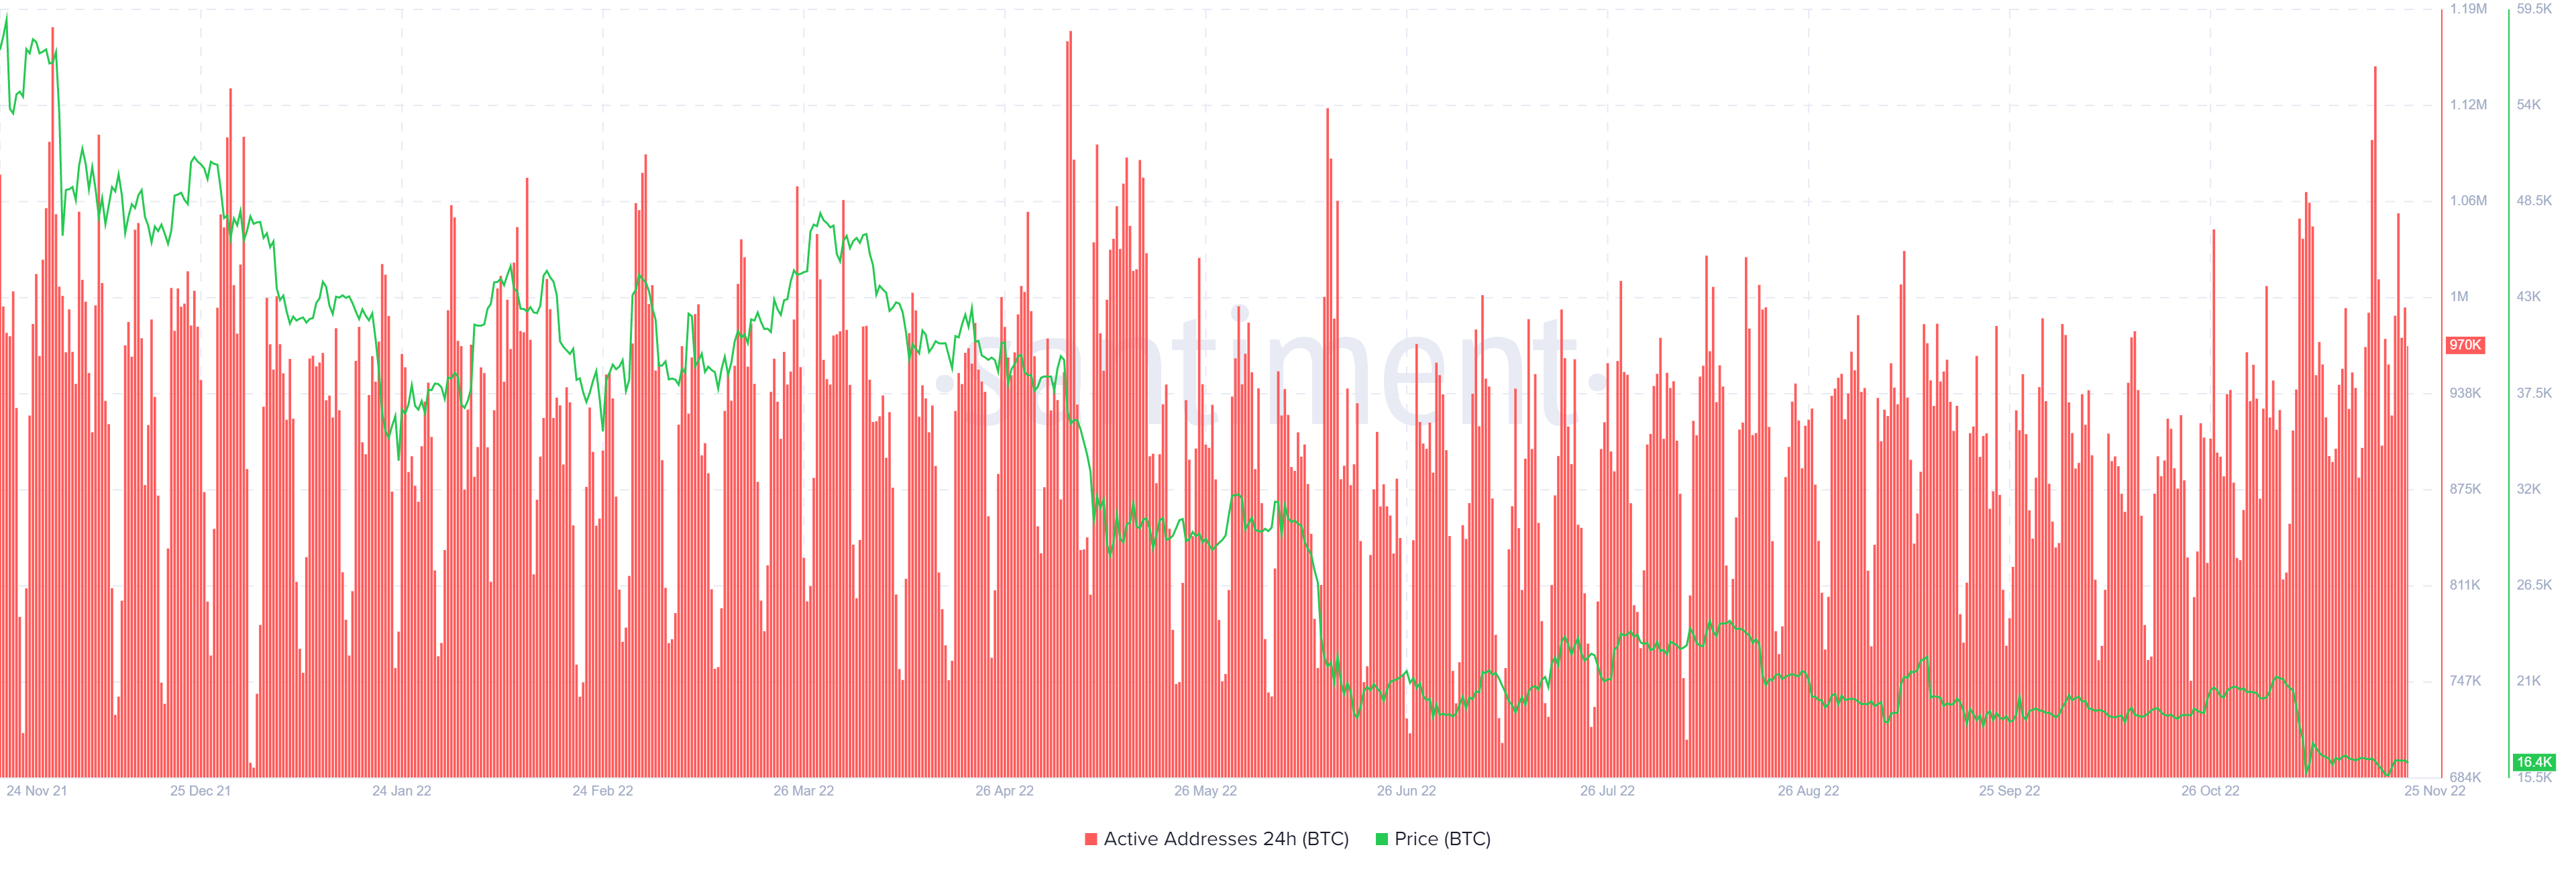
Supporting this illustrative outlook for Bitcoin price is the 24-hour active addresses index, which spiked up to 1.15 million on November 20. The last time this indicator hit 1.15 million was in May 2022. This on-chain metric suggests that despite multiple major crashes in the crypto industry, investors are still interacting with the Bitcoin blockchain and are highly active.
BTC 24-hour active addresses
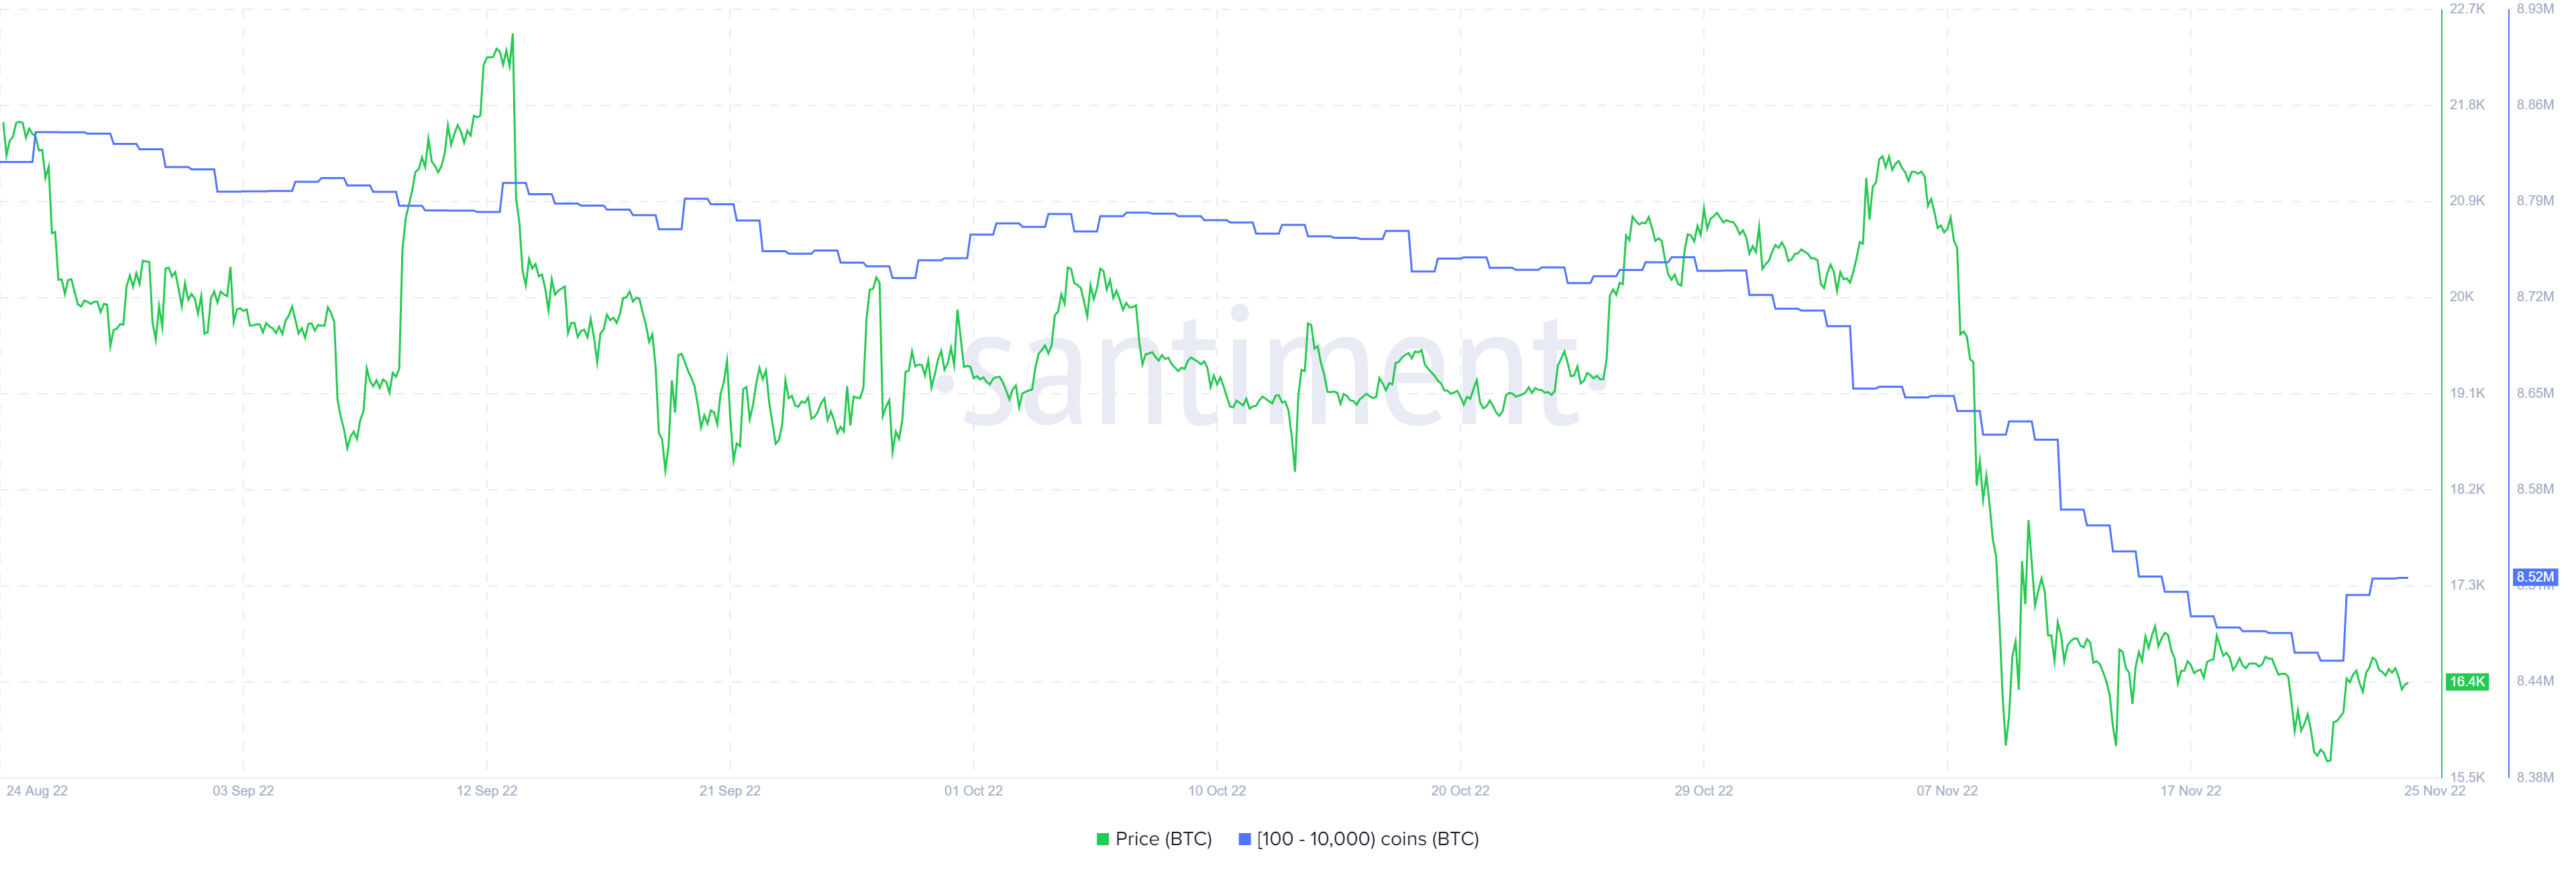
Taken alone, the active addresses metric does not mean anything, however, when combined with the Supply Distribution indicator developed by Santiment, the two provide a fuller picture. The proverbial ‘whales’ show strong signs of strong accumulation after the November 22 crash. Over the past three days, the combined balance of 100 to 10,000 BTC addresses has spiked by roughly 60,000 BTC, indicating that these investors are clearly buying the dip.
BTC supply distribution
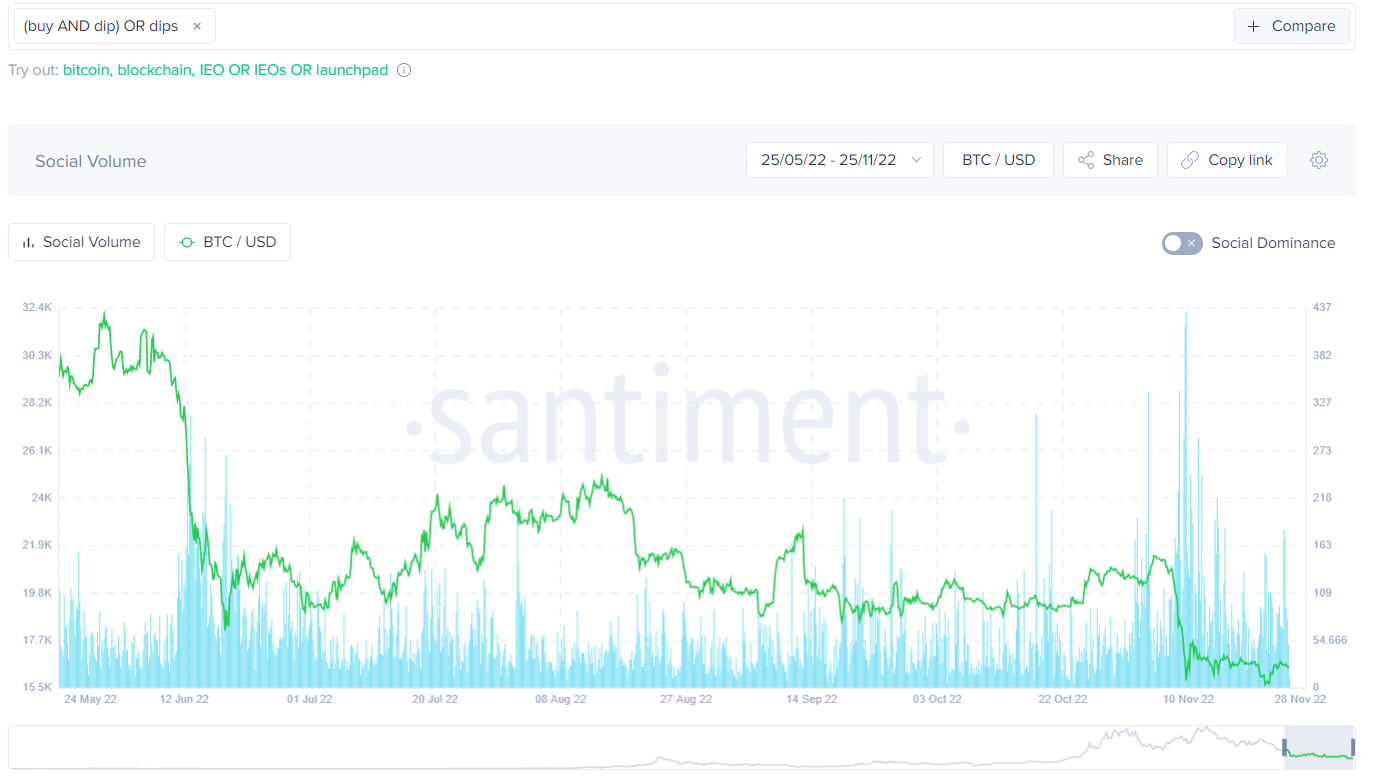
It is interesting to note that the ‘buy the dip’ keyword does not have the same momentum on November 22 as it did during the November 10 crash. This decline in the Social Volume metric indicates that retail investors got burned during the second nosedive on November 22.
Combining this knowledge with the fact the accumulation is seen in whales holding 100 to 10,000 BTC, one can assume that this is a wealth transfer from weak hands to strong hands, and ‘smart money’.
BTC social volume
To sum it up, a year-end rally seems to be cooking for Bitcoin price. Whether it is a 17% upswing to $19,011 or an explosive move to $32,191, investors need to stay prepared.
On the other hand, if Bitcoin price fails to react to the bullish indications and produces a three-day or weekly candlestick close below the $15,550 support level, it will invalidate the bullish outlook. This development will create a lower low, sowing fear into the minds of investors and triggering a selling frenzy.
In such a situation, investors can expect Bitcoin price to revisit the support area, extending from $13,575 to $11,898.
Author

Akash Girimath
FXStreet
Akash Girimath is a Mechanical Engineer interested in the chaos of the financial markets. Trying to make sense of this convoluted yet fascinating space, he switched his engineering job to become a crypto reporter and analyst.


