Bitcoin Technical Analysis: BTC/USD return to $12,000 won’t come easy – Confluence Detector
- Bitcoin loses almost $1,000 in less than a day following another rejection at $12,000.
- Recovery from $11,155 encounters intense selling pressure under $11,500.
- Price action to $12,000 will not be easy, especially with the strong confluence resistances at $11,565 and $11,684

Bitcoin price lock-step trading in the last week of August culminated in significant gains on September 1. BTC/USD soared above the stubborn resistance at $11,800 and closed the day above $12,000. The move was also reflected in other major cryptocurrencies like Ethereum and Ripple. The former broke several barriers to trade a new yearly high at $489 while Ripple reclaimed the position above $0.30.
Unfortunately, the bullish move was cut short because of little fundamental support. The trading volume was also not enough to contain the gains above $12,000. A reversal followed with Bitcoin losing almost $1,000. The primary support at $11,100 came in handy to stop the declines at $11,155.
Meanwhile, a recovery ensued sending Bitcoin marginally above $11,400. However, intense selling pressure below $11,500 is not giving the bulls a chance to stage action towards the psychological $12,000.
It is apparent that recovery will not come as highlighted by various technical levels including the RSI and the MACD. Moreover, the gap between the 50 SMA and the 200 SMA in the 1-hour range is narrowing as a signal for a strengthening bearish grip. For now, the path of least resistance is downwards; a return to $11,100 support is likely before BTC restarts the journey back to $12,000.
BTC/USD 1-hour chart
 (31)-637347057289991559.png)
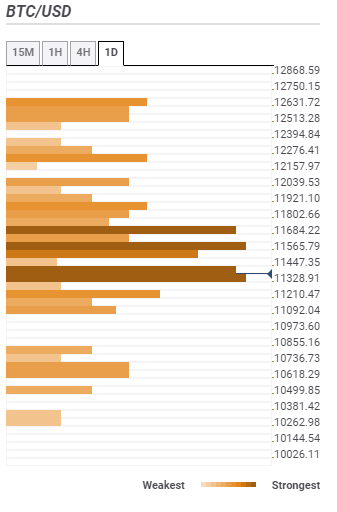
Bitcoin confluence levels
Resistance one: $11,447 – As highlighted by the previous high 15-minutes, the Bollinger Band 15-minutes middle, the SMA five and the Bollinger Band 1-hour middle.
Resistance two: $11,565 – Home to the SMA 50 4-hour, the SMA 200 1-hour, the Fibo 61.8% one-week and the SMA ten one-day.
Resistance three: $11,684 – Highlighted by the Bollinger Band 4-hour middle, the Bollinger one-day middle, the SMA 200 15-minutes and the SMA one-hour.
Support one: $11,328 – This the strongest support zone and home to the previous low 1-hour, the previous low 4-hour, the Fibo 23.6% one-day, the Bollinger Band 15-minutes lower and the Fibo 38.2% one-week.
Support two: $11,210 – Highlighted by the pivot point one-week support one, the previous low one-day and the Bollinger Band 1-hour lower curve.
Support three: $11,092 – Hots the SMA 50 one-day and the pivot point one-day support one.
Author

John Isige
FXStreet
John Isige is a seasoned cryptocurrency journalist and markets analyst committed to delivering high-quality, actionable insights tailored to traders, investors, and crypto enthusiasts. He enjoys deep dives into emerging Web3 tren


